MARINEMAX (HZO)·Q1 2026 Earnings Summary
MarineMax Revenue Beats but Margins Collapse as Boat Market Stays Choppy
January 29, 2026 · by Fintool AI Agent
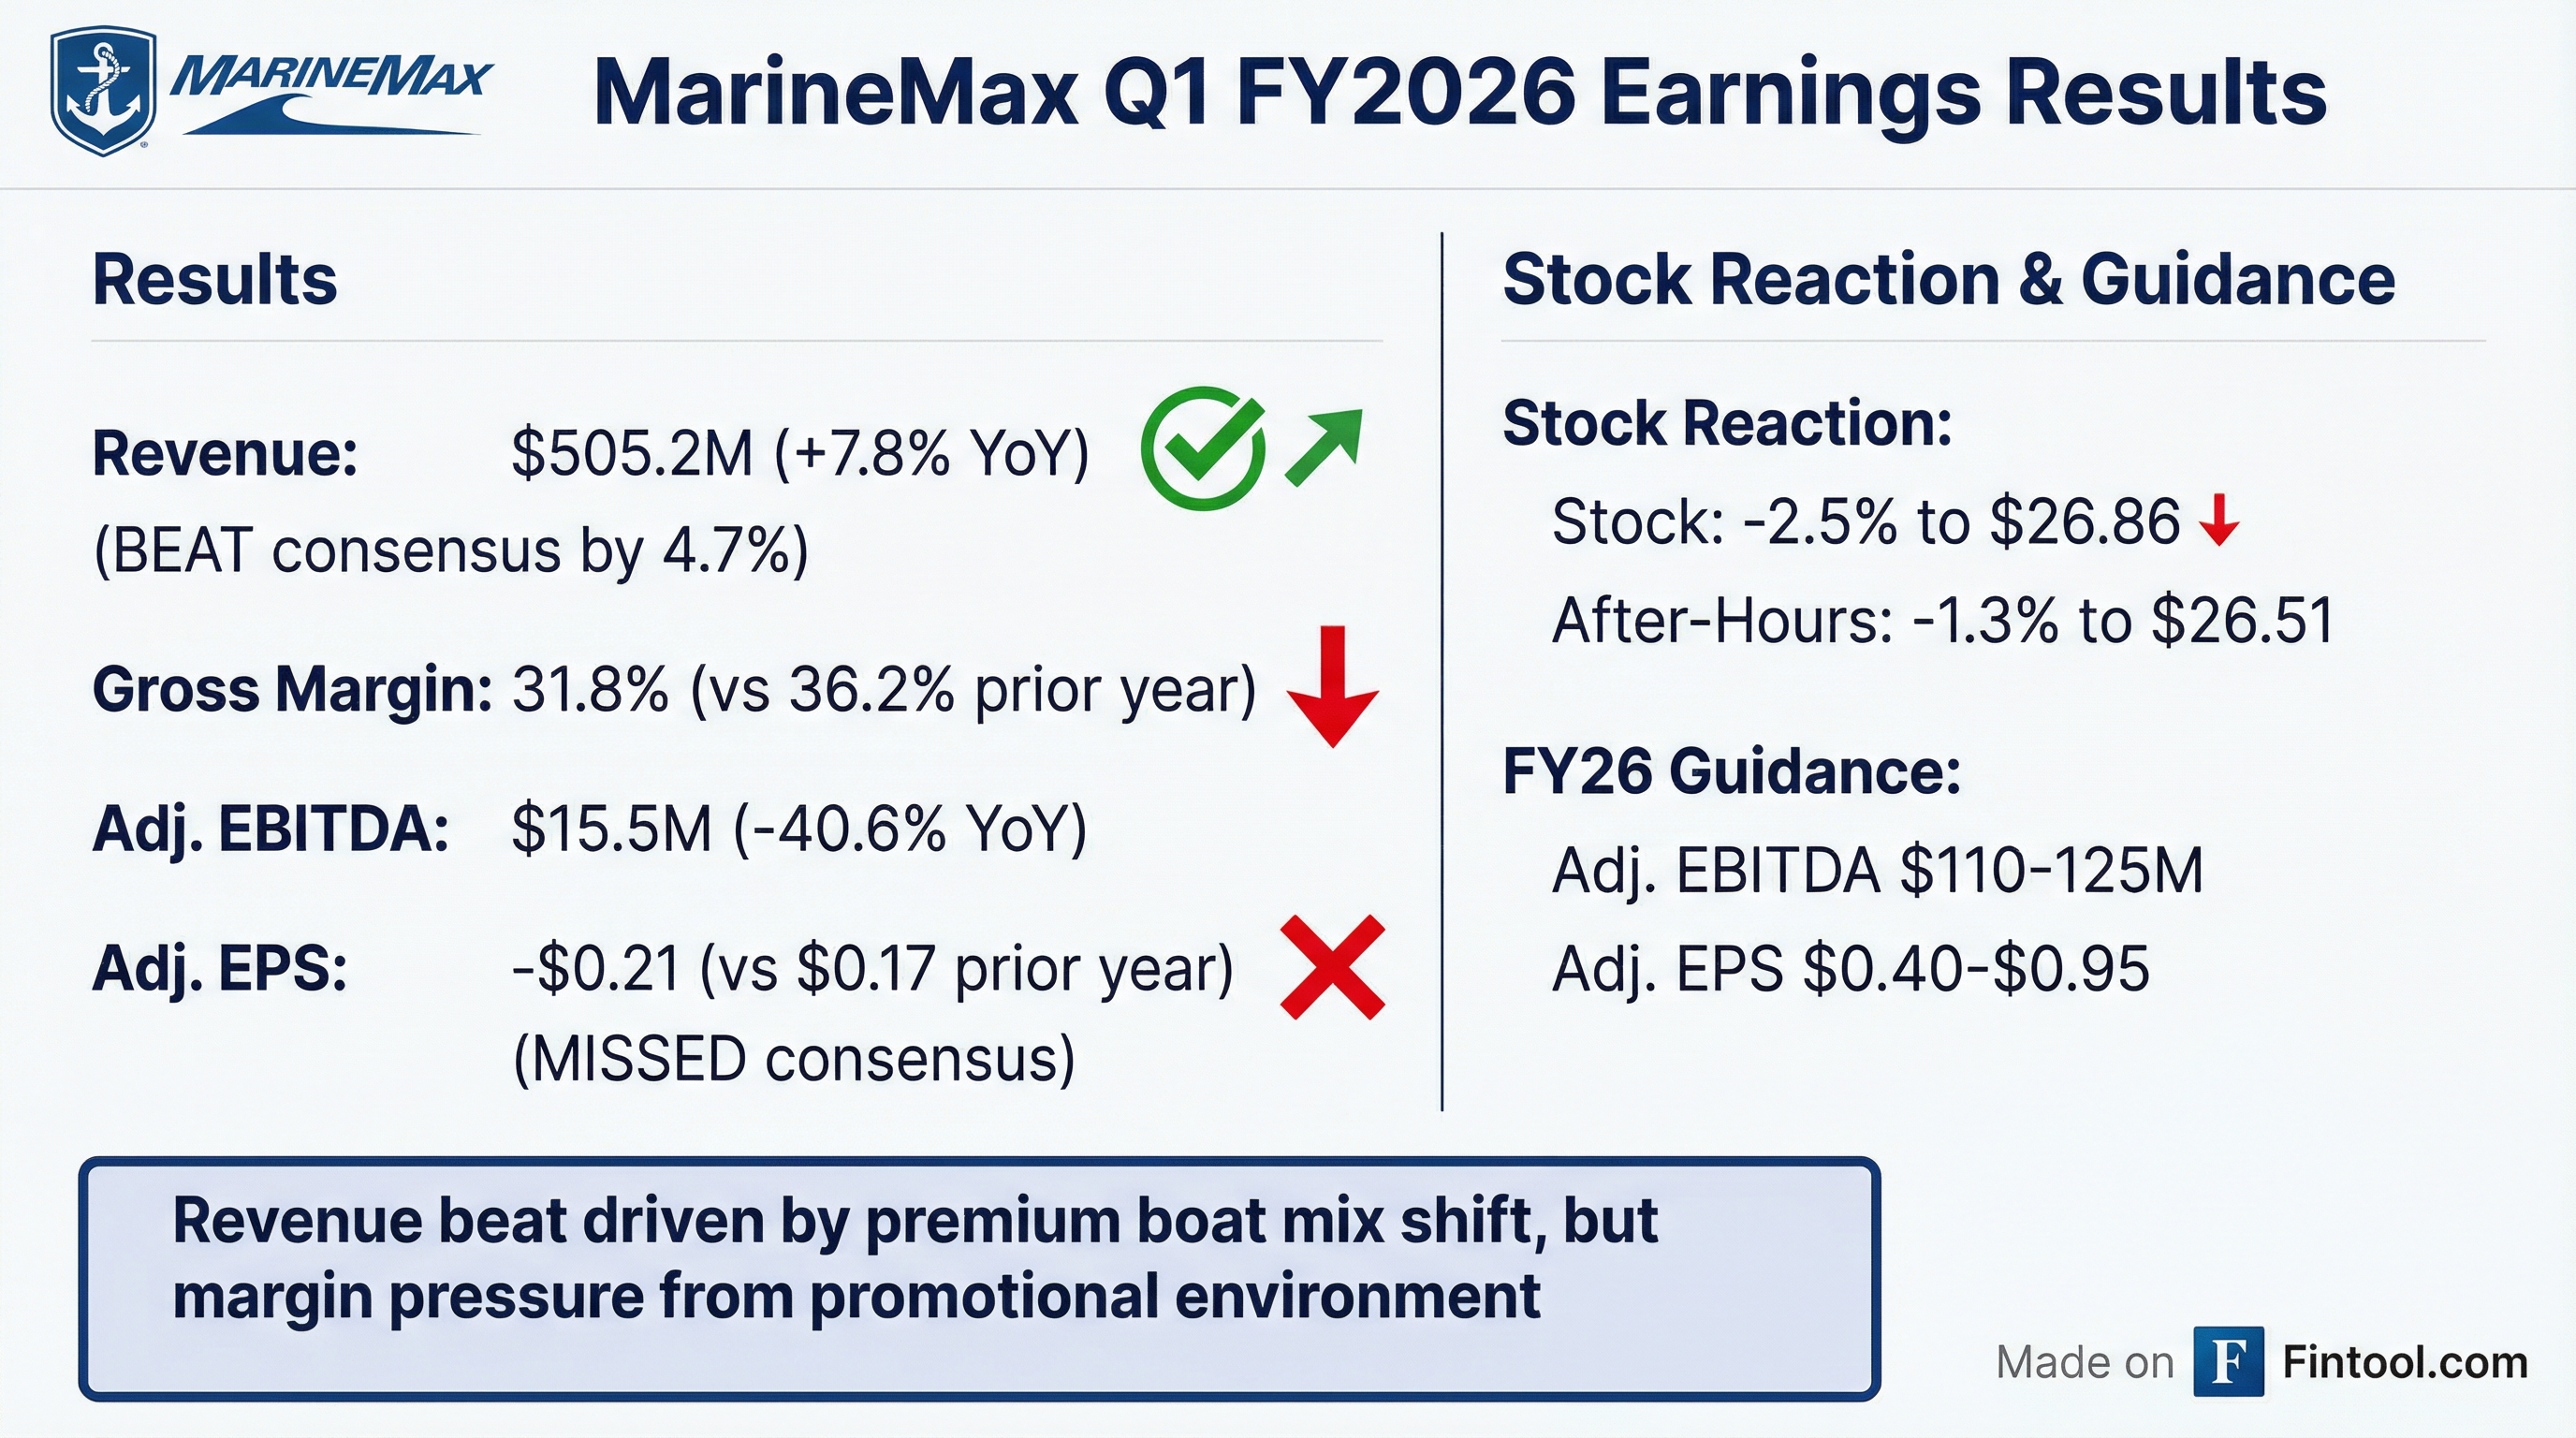
MarineMax (NYSE: HZO) reported mixed Q1 FY2026 results this morning, with revenue beating consensus expectations but earnings falling well short as gross margins compressed sharply amid a challenging promotional environment. The stock dropped 2.5% in regular trading and continued lower in after-hours.
Did MarineMax Beat Earnings?
Revenue: Beat by 4.7% — MarineMax posted revenue of $505.2 million versus consensus estimates of approximately $482.6 million.* The beat was driven by increased comparable store sales with a shift toward larger, premium products.
Adjusted EPS: Missed by $0.13 — Adjusted diluted EPS came in at -$0.21 versus consensus expectations of -$0.08.* The miss was driven by gross margin compression as the company increased promotional activity to move inventory in a soft retail environment.
*Values retrieved from S&P Global
Key Operating Metrics:
- Same-store sales: +10.9% YoY
- Unit volume: Down low-to-mid single digits
- Average unit price: Significant increase driven by mix and Fort Lauderdale Boat Show strength
- Inventory: Down $170M YoY to $868M
- Inventory turns: Below 2x (targeting above 2x by year-end)
- Customer deposits: Flat YoY — an encouraging sign given the environment
How Did the Stock React?
HZO shares fell 2.5% to close at $26.86 on the day, with trading volume of approximately 220,000 shares. The stock continued lower in after-hours trading, dropping an additional 1.3% to $26.51.
The negative reaction despite the top-line beat reflects investor concerns about the sustainability of margins and the company's ability to return to profitability in a challenged retail environment.
52-Week Range: $16.85 - $31.51 Current Price: $26.86 (-2.5%) Market Cap: ~$587M
What Changed From Last Quarter?
The key delta this quarter was gross margin deterioration. Gross margin fell from 36.2% in Q1 FY2025 to 31.8% in Q1 FY2026, a compression of 440 basis points.
Management attributed this to:
- Increased promotional environment — The challenging retail conditions forced more aggressive discounting to move inventory
- Mix shift — While revenue benefited from larger, premium boat sales, the overall product mix pressured margins
- Partially offset by higher-margin businesses — The company's diversified service businesses provided some cushion
On the positive side, inventory management showed progress:
- Inventories decreased to $867.9M from $1.0B YoY
- Actions taken to reduce orders, eliminate brands, and increase turns
What Did Management Guide?
MarineMax maintained its FY2026 guidance:
The guidance excludes potential impact from:
- Material acquisitions
- Changes in tariffs
- Broader global economic conditions
The guidance implies significant improvement in the remaining three quarters, requiring approximately $95-110M in adjusted EBITDA over Q2-Q4 to hit the low end.
Important context: CFO Mike McLamb noted that Q1 and Q2 of last year were relatively strong, but "Liberation Day" disruptions in early April caused demand to soften sharply during the critical June quarter — which is seasonally the most important period for the industry. This created the inventory overhang the industry is still working through. The front half comparisons are therefore more difficult, while the back half should benefit from easier year-over-year compares.
Q&A Highlights
On margin recovery timeline:
"During this quarter, which is during the wintertime, the promotional environment is still going to be pretty active and pretty aggressive. That's baked into our guidance numbers. We do think when you get into maybe late March, or early in the June quarter, the weeks on hand of inventory in the industry are expected to actually drop... I think in kind of early in the spring is the opportunity for margins to begin to recover from the levels that they're at today, which historically, very, very low." — Mike McLamb, CFO
On boat show momentum:
"With the boat shows, that's kind of what made the comment in our script there, that we called out a bunch of different shows from St. Pete to Boston and in between. And the reason we did that is, really across all markets, we saw a positive boat show." — Brett McGill, CEO
On consumer behavior:
"It's less about one segment being up or down... it's about kind of a start-stop thing. Different world news that comes out, we can see sales, buying trends change for two weeks after some crazy news that might get released. And so it's great Fort Lauderdale show, and then a couple weeks of crazy news, and the buyers all stop. So it's really the uncertainty right now that's out there that's causing people to either be buying or slowing down for a little bit." — Brett McGill, CEO
On premium vs. entry-level demand:
"The data tells you that the premium product, the higher price point, the premium end, is performing better overall than the value or entry-level ends. They're both challenged. The value end and the more entry level is more challenged for sure than the premium end." — Mike McLamb, CFO
On January trends:
"Looking at current business conditions, January trends have been solid, thanks in large part to successful boat shows, and the month will finish with positive same-store sales." — Mike McLamb, CFO
Balance Sheet Highlights
The company's balance sheet shows mixed signals — cash improved and inventory is coming down (a positive), but leverage increased and shareholders' equity declined due to losses and share repurchases.
Capital allocation highlights from FY2025:
- Repurchased approximately 6% of shares outstanding
- Acquired Shelter Bay Marina in the Florida Keys
- Invested in growth initiatives including IGY Savannah opening, Stuart Marina expansion, and Fort Myers operation enhancements
Interest expense declined due to lower inventory borrowings and lower rates — expected to be a tailwind throughout FY2026.
Quarterly Revenue Trend
Looking at the trailing 8 quarters, MarineMax has faced a challenging normalization from peak pandemic-era demand:
*Values retrieved from S&P Global
The company has seen revenue pressure as the boat market normalizes, though margins have been volatile quarter-to-quarter as they balance inventory management with pricing.
Strategic Context
MarineMax continues to execute on its diversification strategy away from pure boat retail:
- 70+ boat dealerships featuring 30+ exclusively marketed brands
- 65+ marina and storage locations across 15+ countries (IGY Marinas)
- Superyacht services and brokerage operations
- Finance and insurance services
- Technology platform (New Wave Innovations)
Since 2019, the company has completed 20 acquisitions totaling roughly $700M of high-margin revenue. The strategic thesis is that these higher-margin businesses will provide earnings stability and growth even as the cyclical boat retail business faces headwinds.
Management highlighted achieving gross margins above 30% versus the historical industry standard of mid-20s, attributing this to the diversification efforts.
Boat Show Momentum: Early Season Read
Management provided encouraging commentary on the early selling season. Boat shows serve as leading indicators for demand:
Completed shows (positive results):
- Fort Lauderdale International Boat Show (kickoff to selling season)
- Boston, Atlanta, New York, Milwaukee, St. Petersburg, Minneapolis
Upcoming key shows:
- Miami Boat Show (February) — Important indicator for premium demand
- Palm Beach Show (March) — Further read on in-season activity
Management noted that Fort Lauderdale was a "very strong show" that skewed toward larger products, driving the significant increase in average unit selling prices this quarter. Historically, larger premium products have tended to lead recoveries in past cycles.
What to Watch Going Forward
-
Margin recovery trajectory — Management expects promotional pressure to persist through Q2, with margins potentially beginning to recover in the June quarter as industry inventory normalizes
-
Inventory normalization — Targeting inventory turns above 2x by fiscal year-end; progress will depend on retail demand
-
Tariff risk — Management flagged tariffs as a potential impact excluded from guidance
-
Consumer demand — The recreational marine market remains sensitive to consumer confidence and interest rates; management noted "start-stop" buyer behavior based on news headlines
-
M&A activity — Pipeline remains active but valuations are challenging given weak dealer earnings; acquired Shelter Bay Marina in the Keys this quarter
Report generated by Fintool AI Agent. Data sourced from company filings, S&P Global, and market data providers. Always verify information before making investment decisions.
Related: MarineMax Company Profile | Q1 FY2026 Earnings Presentation | Q4 FY2025 Earnings