KLA (KLAC)·Q2 2026 Earnings Summary
KLA Posts Record Year, Beats Q2, Stock Drops 7% After Hours
January 29, 2026 · by Fintool AI Agent
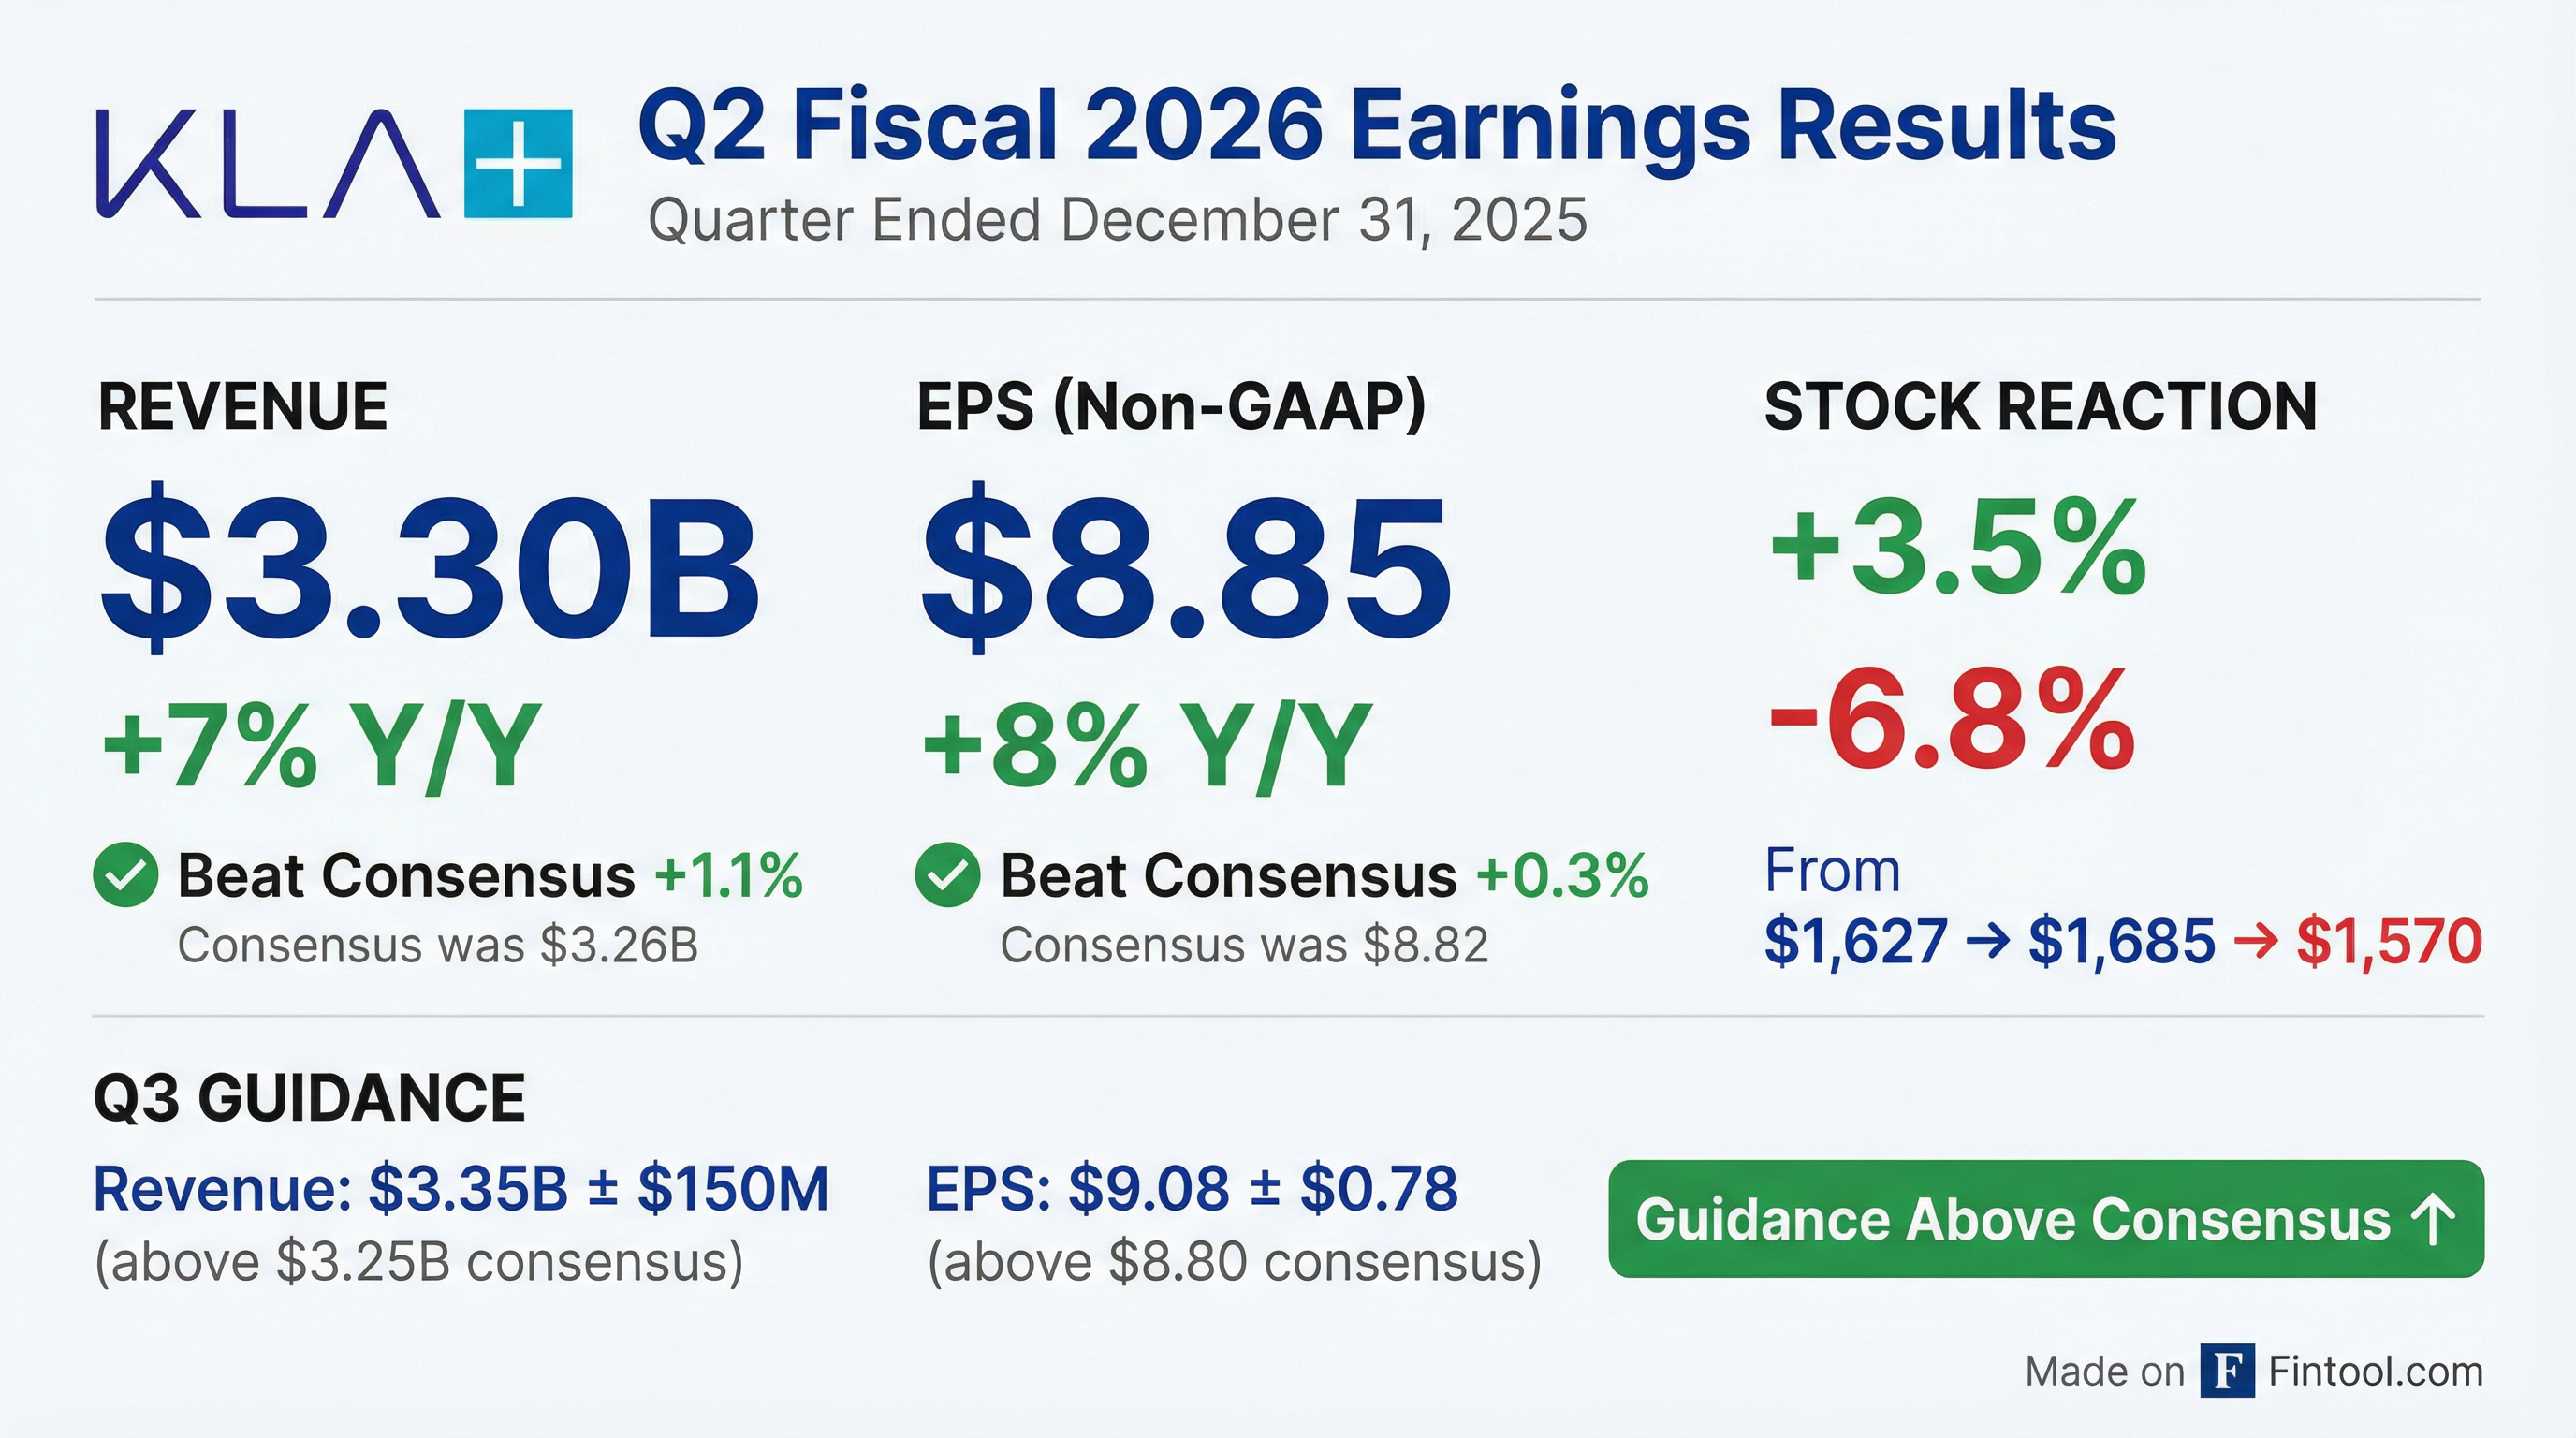
KLA Corporation (KLAC) delivered another quarter of beats, extending its winning streak to 8 consecutive quarters of outperformance. Q2 FY2026 revenue of $3.30B topped the $3.26B consensus by 1.1%, while non-GAAP EPS of $8.85 edged past the $8.82 estimate . The company also announced a record calendar year 2025 with $12.74B in revenue (+17% Y/Y) and $4.4B in free cash flow (+30% Y/Y) .
Despite the beat and above-consensus guidance for Q3, the stock dropped roughly 7% in after-hours trading to $1,570—suggesting elevated expectations after KLAC's 29% rally heading into the print .
Did KLA Beat Earnings?
Yes. KLA delivered its 8th consecutive quarterly beat:
The beat was narrower than recent quarters—KLA's trailing four-quarter average surprise was 5.86% . The modest outperformance may explain the muted market reaction.
Profitability remained exceptional:
*Values retrieved from S&P Global
What Did Management Guide?
KLA's Q3 FY2026 guidance came in above consensus on both revenue and EPS:
Key assumptions for Q3 :
- Semi PC Revenue by End Market: ~60% Foundry/Logic, ~40% Memory
- Memory mix: DRAM ~85%, NAND ~15%
- Non-GAAP Operating Expenses: ~$645M
- Effective Tax Rate: ~14.5%
Full-year CY2026 guidance :
- Non-GAAP Gross Margin: 61.5% - 62.5%
- Non-GAAP Operating Expenses: $2.67B
- Effective Tax Rate: 14.5%
The company noted that DRAM pricing escalation due to capacity constraints may impact gross margin for the March quarter and calendar 2026 .
How Did the Stock React?
The market's initial response was positive, but after-hours trading told a different story:
The stock hit a new all-time high during regular trading ($1,692.86) before reversing sharply after hours. The ~8.6% after-hours decline (or ~5.4% from prior close) likely reflects:
- Narrow beat: EPS beat of just 0.3% vs. trailing 4-quarter average surprise of 5.86%
- Gross margin headwind: 75-100 bps DRAM pricing impact for CY2026
- Elevated expectations: Stock was up 29% heading into earnings
What Changed From Last Quarter?
Revenue acceleration continued:
- Q2 FY2026 revenue of $3.30B was +3% Q/Q and +7% Y/Y
- Semi Process Control (91% of revenue) grew +4% Q/Q and +9% Y/Y
- Specialty Semiconductor rebounded +17% Q/Q after declining in Q1
Margin expansion:
- Non-GAAP gross margin improved to 62.6% from 61.3% in Q1
- Operating margin expanded to 42.8% from 41.7%
Cash generation accelerated:
- Q2 FCF of $1.26B represented 108% FCF conversion (FCF/Net Income)
- FCF margin of 38% was the highest in recent quarters
Capital returns remained strong:
- $548M in share repurchases in Q2
- $250M in dividends paid
- CY25 total capital returns: $3.0B ($2.03B buybacks + $983M dividends)
Revenue Breakdown: Where Is Growth Coming From?
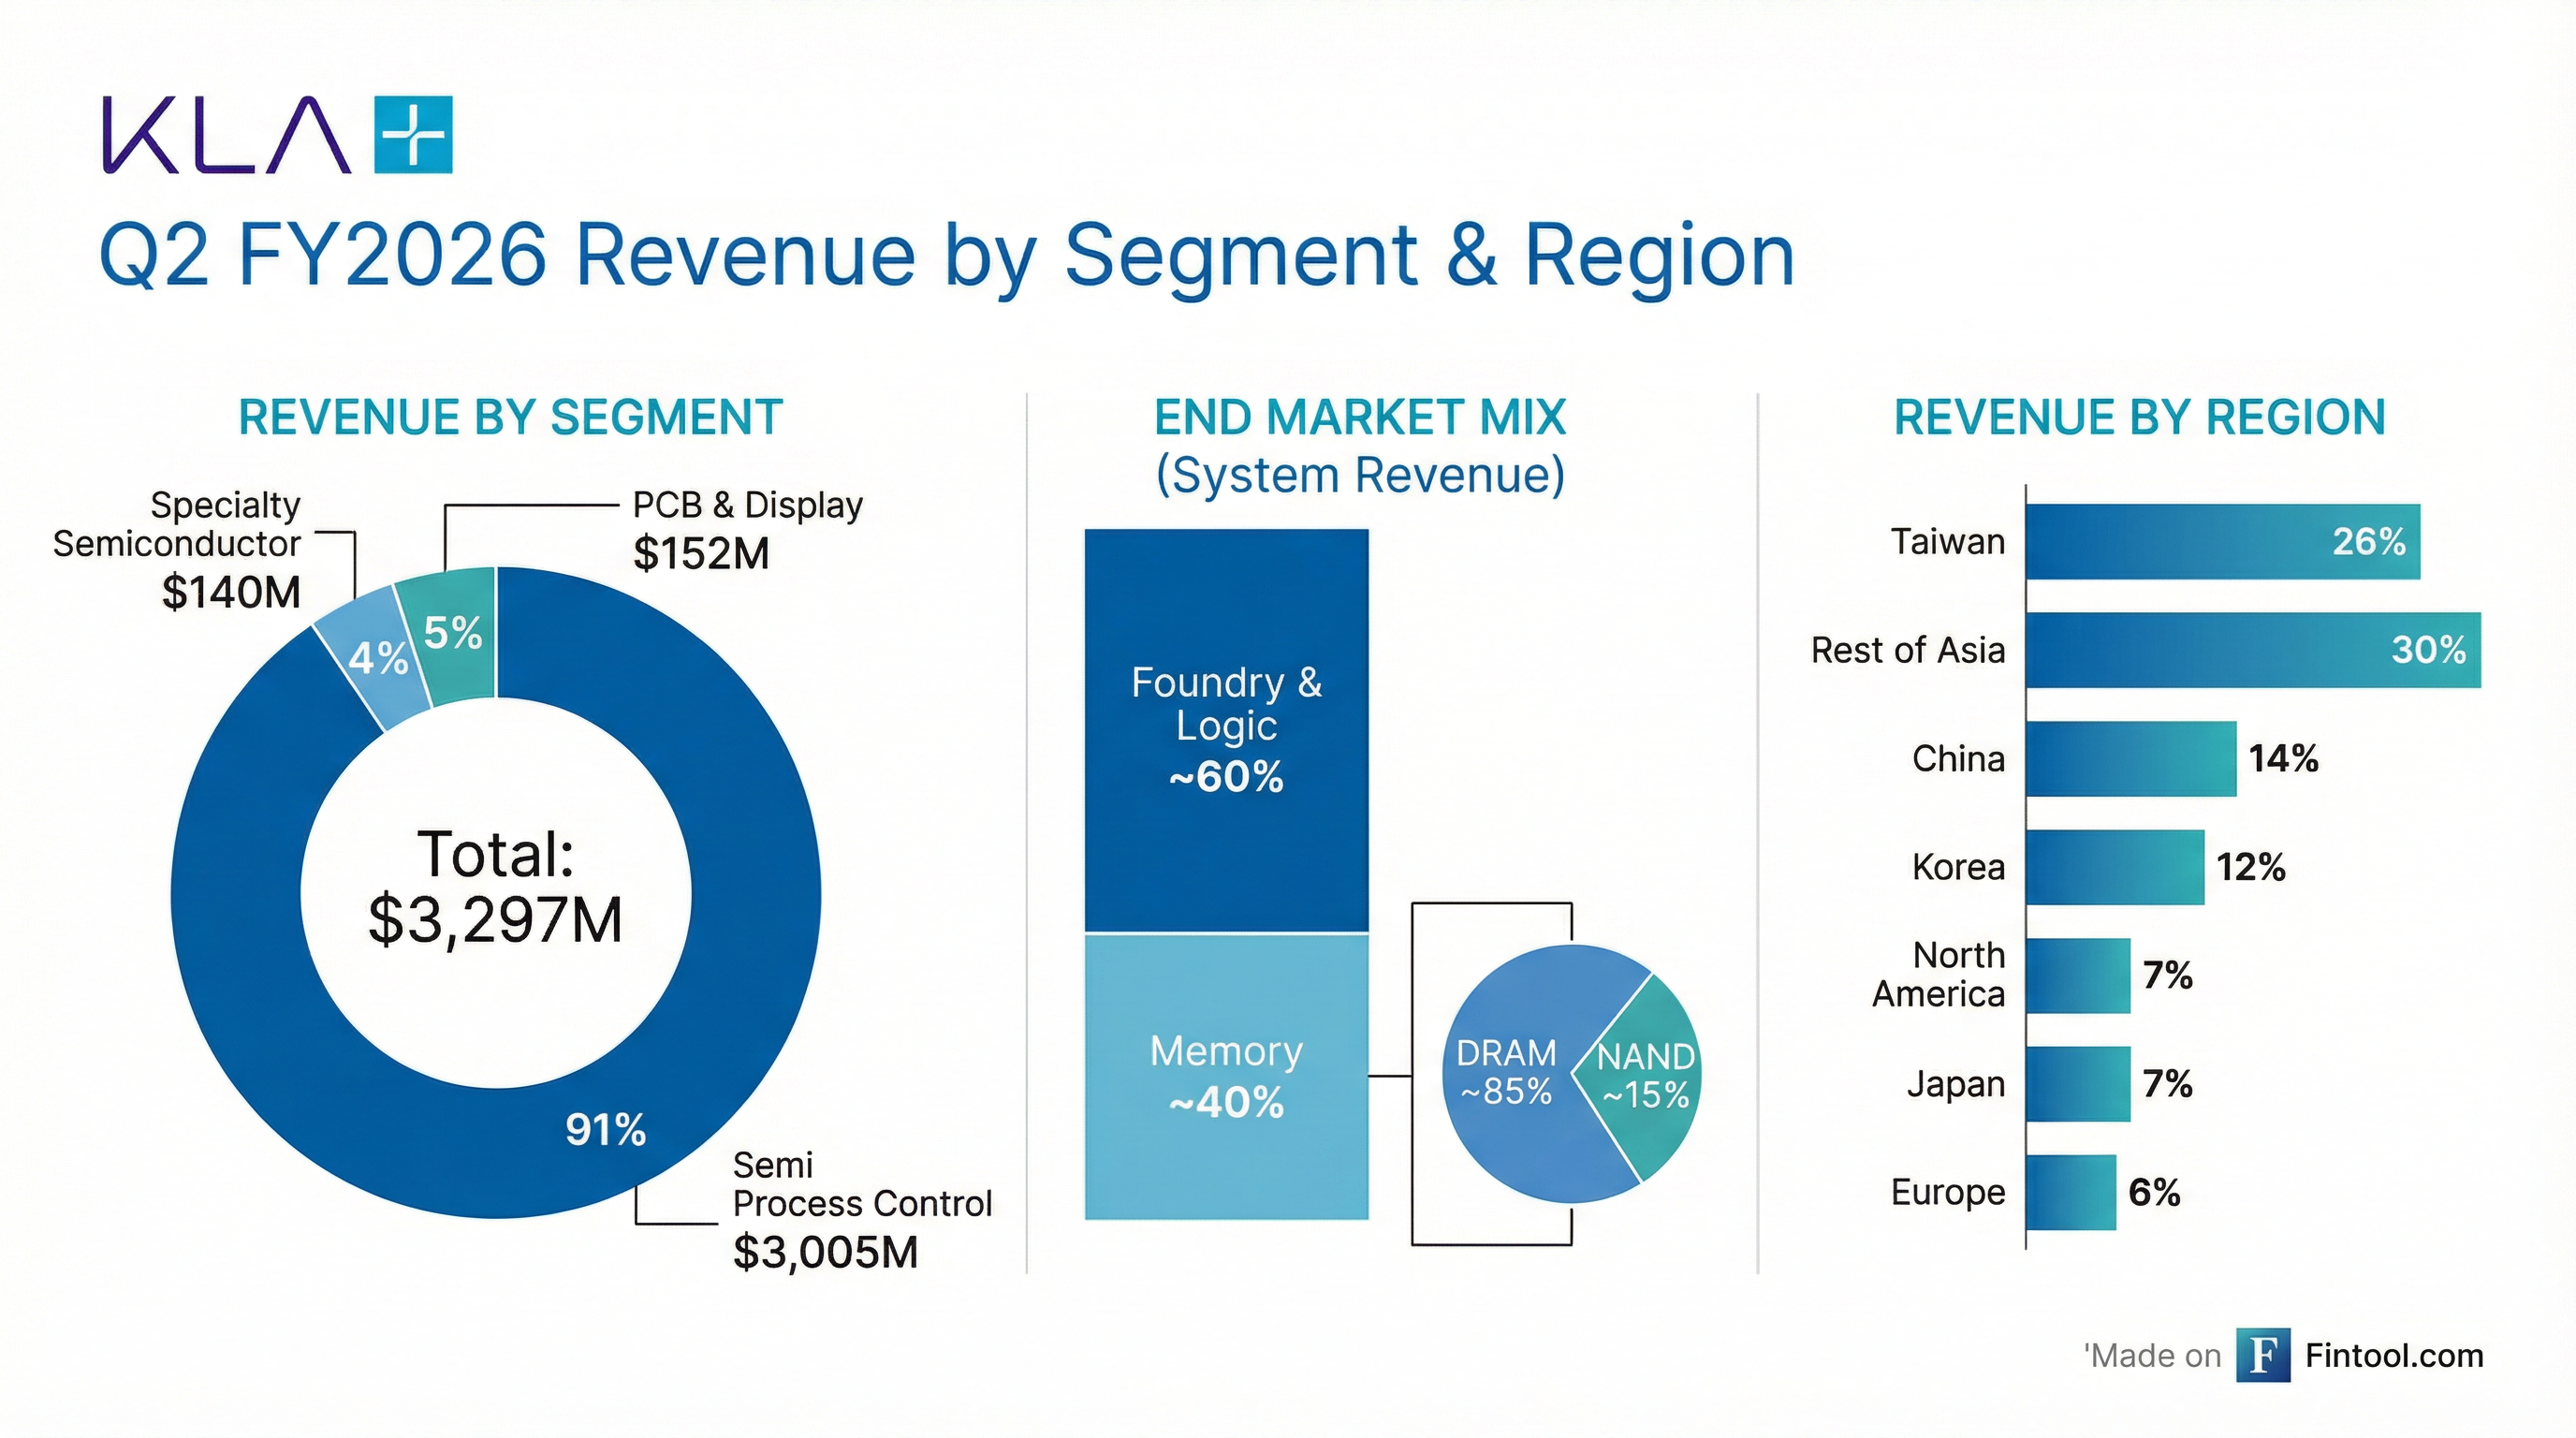
By Segment (Q2 FY2026) :
By End Market (System Revenue) :
- Foundry & Logic: ~60%
- Memory: ~40% (primarily DRAM)
By Region :
- Taiwan: 26%
- Rest of Asia: 30%
- China: 14%
- Korea: 12%
- North America: 7%
- Japan: 7%
- Europe: 6%
China revenue at 14% is down from historical levels following U.S. export restrictions—a headwind the company continues to navigate .
Record Calendar Year 2025: The Numbers
KLA delivered a record year across key metrics :
The company highlighted that its GEN 5 (39xx Series) products played a critical role in defect discovery for advanced devices and the transition to EUV lithography .
Balance Sheet & Capital Allocation
Strong investment-grade balance sheet :
Shareholder returns commitment:
- Target: >85% of FCF returned to shareholders
- 16th consecutive annual dividend increase announced (April 2025): +12% to $1.90/share quarterly
- ~15% dividend CAGR since 2006
Q&A Highlights: What Analysts Asked
The Q&A session revealed critical forward-looking insights:
WFE Market Outlook for 2026
CFO Bren Higgins provided detailed WFE market forecasts :
This clarifies the apparent disconnect with Lam Research's 23% WFE growth forecast—KLA separates core WFE from advanced packaging, while some peers aggregate them .
Supply Constraints Limiting First-Half Growth
KLA is "virtually sold out across most products" for H1 2026 . Key constraints:
- Long lead times: Optical components require decisions made in mid-2025 for H1 2026 shipments
- Extending lead times: Customer demand has accelerated in recent months, stretching delivery schedules
- Facility constraints: Customers are "frustrated with the shelves they have available"—they can't build fabs fast enough
CEO Rick Wallace noted: "They are constrained by the ability to build new fabs and new shelves... The setup for 2027 is pretty remarkable."
Half-Over-Half Growth Trajectory
DRAM Pricing Headwind on Gross Margins
A significant new headwind emerged: DRAM chip pricing for KLA's image processing computers has escalated sharply :
- Impact: 75-100 bps negative gross margin impact for CY2026
- Timing: Pricing environment "changed profoundly over the past 2-3 months"
- Duration: Expected to persist through 2026, normalize as DRAM capacity additions accelerate
- CY2026 gross margin guide: ~62% ± 50 bps (vs historical 63%+)
CFO Higgins emphasized this is transitory: "As DRAM capacity additions accelerate over the next several quarters, we expect this cost dynamic to improve as we exit the calendar year."
Advanced Packaging: From 10% to 50% Market Share
KLA's process control share in advanced packaging has transformed :
Advanced packaging revenue hit ~$950M in CY2025 (+70% Y/Y) with mid-to-high teens growth expected for CY2026.
China: Stable Outlook, Affiliate Revenue Returning
China expectations for 2026 :
- KLA China revenue: Mid-20% to high-20% of total revenue
- China WFE market: Mid-to-high $30B range (including restricted fabs)
- Growth: Flat to modestly positive (vs modestly negative in 2025)
- Affiliate rule revenue: ~$300-350M returning after restrictions lifted
Memory Intensity Rising—DRAM Looking More Like Logic
DRAM process control intensity is increasing dramatically :
Drivers:
- Less redundancy—higher device value means no real estate for backup circuits
- More metallization layers for data movement requiring more inspection
- Increased EUV adoption requiring more inspection
- High-performance compute demands tight specs with no binning flexibility
CFO Higgins: "The intensity of DRAM... looks much more similar to what logic did not that long ago."
End Market Growth Expectations
Key Risks Flagged
Management highlighted several risk factors :
- DRAM pricing pressure: Capacity constraints driving 75-100 bps gross margin headwind for CY2026
- China export restrictions: Bureau of Industry and Security rules continue to impact ability to sell to certain Chinese customers; also unfair competitive dynamics where non-US companies can sell to restricted fabs
- Facility constraints: Customers can't build fabs fast enough—limits near-term equipment demand
- Cyclicality: Semiconductor industry remains inherently cyclical with concentrated customer base
- Geopolitical risks: War in Ukraine, Middle East tensions, and Taiwan relations create uncertainty
What's Next for KLA?
Near-term catalysts:
- KLA Investor Day: March 12, 2026—management will present 2030 targets and detailed market sizing
- Q3 FY2026 earnings (expected late April 2026)
- H2 2026 acceleration as supply constraints ease
- Continued AI infrastructure investment driving process control demand
- HBM growth expected to outpace overall logic/foundry
2027 setup is "remarkable": Management emphasized multiple times that conversations with customers about new orders are predominantly for late 2026 and 2027 deliveries . Foundry logic customers are facility-constrained today, setting up significant expansion potential next year .
Long-term targets :
- 40-50% incremental non-GAAP operating margin leverage on revenue growth
- Gross margins returning to 63%+ as DRAM pricing normalizes
- Market share expansion in advanced packaging and reticle inspection
- Process control intensity rising as chip complexity increases across all segments
For the full earnings call transcript, see KLA Q2 FY2026 Earnings Call. For prior quarter analysis, see Q1 FY2026 Earnings.