Earnings summaries and quarterly performance for KLA.
Executive leadership at KLA.
Richard Wallace
President and Chief Executive Officer
Ahmad Khan
President, Semiconductor Products and Customers
Bren Higgins
Executive Vice President and Chief Financial Officer
Brian Lorig
Executive Vice President, KLA Global Services
Mary Beth Wilkinson
Executive Vice President, Chief Legal Officer and Corporate Secretary
Virendra Kirloskar
Senior Vice President and Chief Accounting Officer
Board of directors at KLA.
Research analysts who have asked questions during KLA earnings calls.
Harlan Sur
JPMorgan Chase & Co.
9 questions for KLAC
Timothy Arcuri
UBS
9 questions for KLAC
Vivek Arya
Bank of America Corporation
6 questions for KLAC
Brian Chin
Stifel Financial Corp.
5 questions for KLAC
Joe Quatrochi
Wells Fargo
5 questions for KLAC
Shane Brett
Morgan Stanley
5 questions for KLAC
Thomas O’Malley
Barclays Capital
5 questions for KLAC
Charles Shi
Needham & Company
4 questions for KLAC
CJ Muse
Cantor Fitzgerald
4 questions for KLAC
Jim Schneider
Goldman Sachs
4 questions for KLAC
Tom O'Malley
Barclays
4 questions for KLAC
Atif Malik
Citigroup Inc.
3 questions for KLAC
Blayne Curtis
Jefferies Financial Group
3 questions for KLAC
Chris Caso
Wolfe Research LLC
3 questions for KLAC
Christopher Muse
Cantor Fitzgerald
3 questions for KLAC
Joseph Quatrochi
Wells Fargo Securities, LLC
3 questions for KLAC
Sreekrishnan Sankarnarayanan
Wolfe Research, LLC
3 questions for KLAC
Srinivas Pajjuri
Raymond James & Associates, Inc.
3 questions for KLAC
Timm Schulze-Melander
Rothschild & Co Redburn
3 questions for KLAC
C J Muse
Tanner Fitzgerald
2 questions for KLAC
Edward Yang
Oppenheimer & Co. Inc.
2 questions for KLAC
Robert Burns
H.C. Wainwright & Co.
2 questions for KLAC
Saurabh Arya
Bank of America
2 questions for KLAC
Stacy Rasgon
Bernstein Research
2 questions for KLAC
Yu Shi
Susquehanna International Group, LLP
2 questions for KLAC
Chris Casso
Wolfe Research
1 question for KLAC
Chris St. Mark
TDK
1 question for KLAC
Christopher Caso
Wolfe Research
1 question for KLAC
Joe Quattrocki
Wells Fargo
1 question for KLAC
Joseph Moore
Morgan Stanley
1 question for KLAC
Melissa Weathers
Deutsche Bank
1 question for KLAC
Michael Mani
Bank of America
1 question for KLAC
Shane Moore
Morgan Stanley
1 question for KLAC
Recent press releases and 8-K filings for KLAC.
- Report forecasts global semiconductor manufacturing equipment market will grow from USD 166.35 billion in 2025 to USD 344.36 billion by 2032 at a CAGR of 11.0%.
- Growth driven by automotive semiconductor demand for EV traction inverters, battery‐management systems and ADAS processors, boosting spending on lithography, deposition and metrology tools.
- Outsourced semiconductor assembly and test (OSAT) companies expected to register the highest CAGR as advanced packaging and high-density testing accelerate for AI, ML, HPC and 5G applications.
- China set to dominate the Asia Pacific market through 2032, supported by “Made in China 2025” initiatives and heavy investment in fabs, equipment and infrastructure.
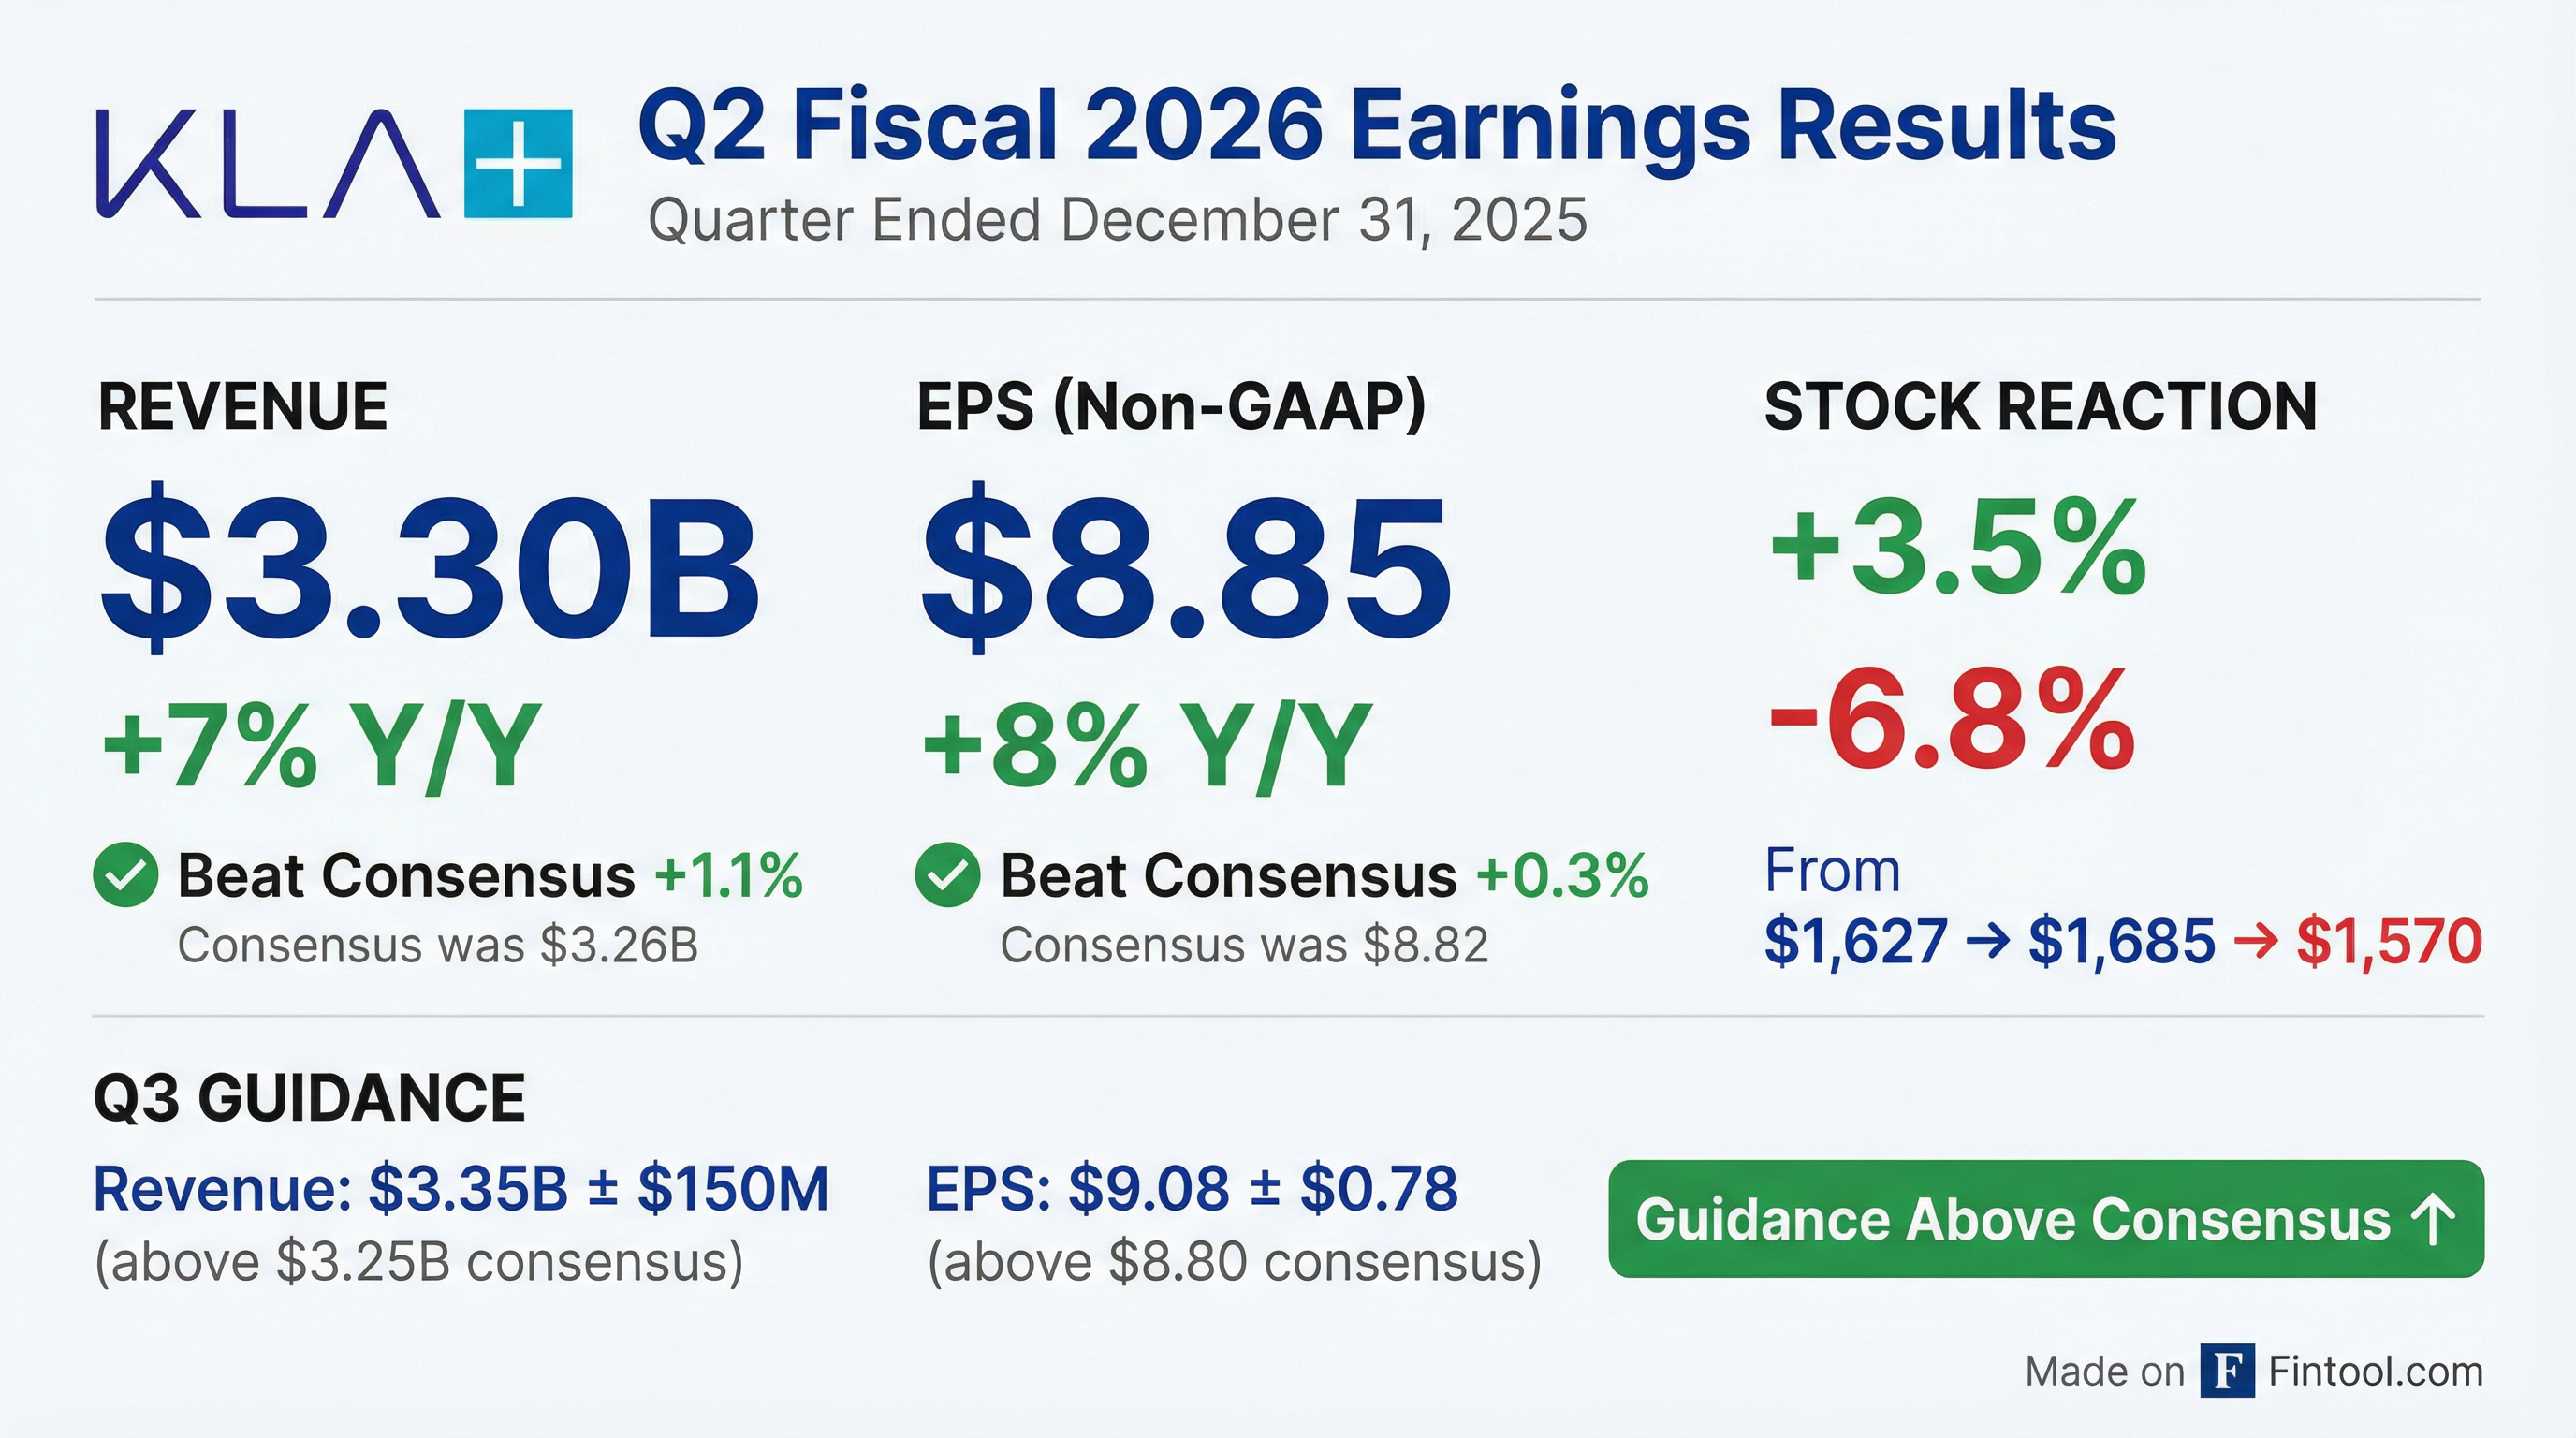
- KLA reported fiscal Q2 revenue of $3.3 billion (up ~7% YoY) and adjusted EPS of $8.85, topping consensus estimates.
- On a GAAP basis, net income was $1.15 billion (EPS $8.68), alongside strong cash generation: operating cash flow of $1.37 billion and free cash flow of $1.26 billion.
- Management guided Q3 revenue to roughly $3.35 billion and EPS near $9.08.
- Shares dipped ~7% in after-hours trading as investor expectations had outpaced consensus and concerns over China local-sourcing rules and U.S. export restrictions emerged.
- Revenue of $3.3 billion, up 17% y/y; non-GAAP EPS $8.85 and GAAP EPS $8.68, each above guidance.
- Gross margin 62.6%, operating margin 42.8%, and record free cash flow of $1.26 billion.
- Advanced packaging systems drove $950 million in 2025 revenue (+70% y/y); service revenue reached $786 million in Q2 (+18% y/y).
- Returned $797 million to shareholders in Q2 via $548 million in share buybacks and $250 million in dividends.
- Q3 2026 outlook: revenue $3.35 billion ± $150 million, non-GAAP EPS $9.08 ± $0.78, gross margin 61.75% ± 1 pp.
- Q2 2026 results: $3.3 B revenue; non-GAAP EPS $8.85, GAAP EPS $8.68; gross margin 62.6%, operating margin 42.8%
- FY 2025: revenue +17% to $12.745 B, EPS +29%; gross margin 62.8%; free cash flow +30% to $4.4 B; $3 B returned to shareholders
- Q3 2026 guidance: revenue $3.35 B ± $150 M; gross margin 61.75% ± 1 pp; non-GAAP EPS $9.08 ± $0.78, reflecting a 75–100 bp DRAM cost headwind
- 2026 market outlook: core WFE to low-$120 B and advanced packaging to $12 B (total mid-$130 B), with H2 growth accelerating; KLA expects to outpace the market
- KLA delivered $3.3 billion in December quarter revenue, up 17% YoY; non-GAAP EPS was $8.85 and GAAP EPS was $8.68; gross margin stood at 62.6% with a 42.8% operating margin.
- For full-year 2025, revenue grew 17% to $12.745 billion and EPS rose 29%; free cash flow increased 30% to $4.4 billion, and the company returned $3 billion to shareholders, including $797 million in the December quarter (share repurchases of $548 million and $250 million in dividends).
- Guidance for the March quarter forecasts $3.35 billion ± $150 million in revenue, gross margin of 61.75% ± 1 pp, and non-GAAP EPS of $9.08 ± $0.78; planning tax rate is 14.5% for 2026.
- KLA ended the quarter with $5.2 billion in cash and equivalents versus $5.9 billion in debt, generated $1.37 billion of operating cash flow, and anticipates mid-single-digit H1 2026 growth versus H2 2025 with acceleration in H2 2026 as process control intensity and advanced packaging drive market outperformance.
- Revenue of $3.3 B, 62.6% gross margin, 42.8% operating margin, and net income of $1.2 B with non-GAAP EPS of $8.85 in the December quarter.
- Record FY 2025 revenue of $12.74 B (+17% YoY) and free cash flow of $4.4 B (+30%), with 62.8% gross profit margin and EPS of $35.44.
- Q3 FY 2026 guidance: $3.35 B ± $150 M revenue, 61.75% ± 1% non-GAAP gross margin, GAAP EPS $8.85 ± 0.78, non-GAAP EPS $9.08 ± 0.78.
- CY 2025 capital returns include $3.94 B share repurchases, $983 M dividends paid, and a 16th consecutive dividend increase to $1.90/share.
- December quarter free cash flow of $1.26 B (38% margin, 108% conversion), with $548 M share buyback and $250 M dividends.
- KLA delivered $3.30 billion in total revenues, above the midpoint of guidance, with GAAP diluted EPS of $8.68 and non-GAAP diluted EPS of $8.85.
- Generated $1.37 billion of operating cash flow and $1.26 billion of free cash flow in the quarter (last twelve months: $4.77 billion and $4.38 billion, respectively).
- Returned $797.4 million of capital in Q2 and $3.01 billion over the last twelve months through dividends and share repurchases.
- Provided Q3 FY2026 guidance: revenues of $3.35 billion ± $150 million, GAAP gross margin 60.62% ± 1%, non-GAAP gross margin 61.75% ± 1%, GAAP EPS $8.85 ± $0.78, and non-GAAP EPS $9.08 ± $0.78.
- KLA posted $3.30 billion in Q2 FY2026 revenues, with GAAP diluted EPS of $8.68 and non-GAAP diluted EPS of $8.85, all above guidance midpoints.
- Operating cash flow was $1.37 billion for the quarter ($4.77 billion LTM) and free cash flow was $1.26 billion for the quarter ($4.38 billion LTM).
- Returned $797 million of capital in Q2 and $3.01 billion over the last twelve months via dividends and share repurchases.
- Q3 FY2026 guidance includes $3.35 billion ± $150 million in revenues, GAAP diluted EPS of $8.85 ± $0.78, and non-GAAP diluted EPS of $9.08 ± $0.78.
- KLA delivered mid-teens revenue growth and high-20% EPS growth in 2025, alongside share gains in the overall WFE market.
- For 2026, KLA expects low- to mid-single-digit WFE growth in H1, with an acceleration into H2 driven by expanded leading-edge (including 2nm and N3) and high-bandwidth memory investments.
- Its advanced packaging business reached $925 million in 2025 (up ~70% YoY), with 70% of that revenue from process control, as KLA adapts front-end tools for panel-level packaging.
- China exposure is set to decline from ~40% of revenue in 2024 to the mid-20s percent in 2026, after a $300 million BIS Affiliate Rule impact, which KLA plans to reslot over the year.
- The service business is growing 12-14%, is 75% contract-based, and supports incremental operating margins of 60-65%, providing a stable, high-visibility revenue stream.
- At UBS’s 2025 Global Tech & AI Conference, CFO Brian Higgins projected low–mid single-digit WFE growth in H1 2026, with stronger acceleration in H2 2026, driven by leading-edge design, large-die challenges, high-bandwidth memory, and advanced packaging demand.
- The overall WFE market is estimated at $105–110 billion in 2025 with advanced packaging adding $11 billion; KLA anticipates a continued strong environment that could approach $150 billion by 2027.
- KLA’s service revenue—75% contract-based—is growing 12–14%, providing stable, high-margin cash flow, with incremental operating margins around 60–65% and forecast gross margins near 62.5% for 2026.
- China revenue exposure (41% in 2024) is expected to decline to the mid-20% range in 2026; a $300 million BIS-related deferral in late 2025 is slated to be reslotted, with China WFE down modestly but stabilizing.
Fintool News
In-depth analysis and coverage of KLA.

Quarterly earnings call transcripts for KLA.
Ask Fintool AI Agent
Get instant answers from SEC filings, earnings calls & more