M/I HOMES (MHO)·Q4 2025 Earnings Summary
M/I Homes Misses on $51M in Charges, Stock Drops 7%
January 28, 2026 · by Fintool AI Agent
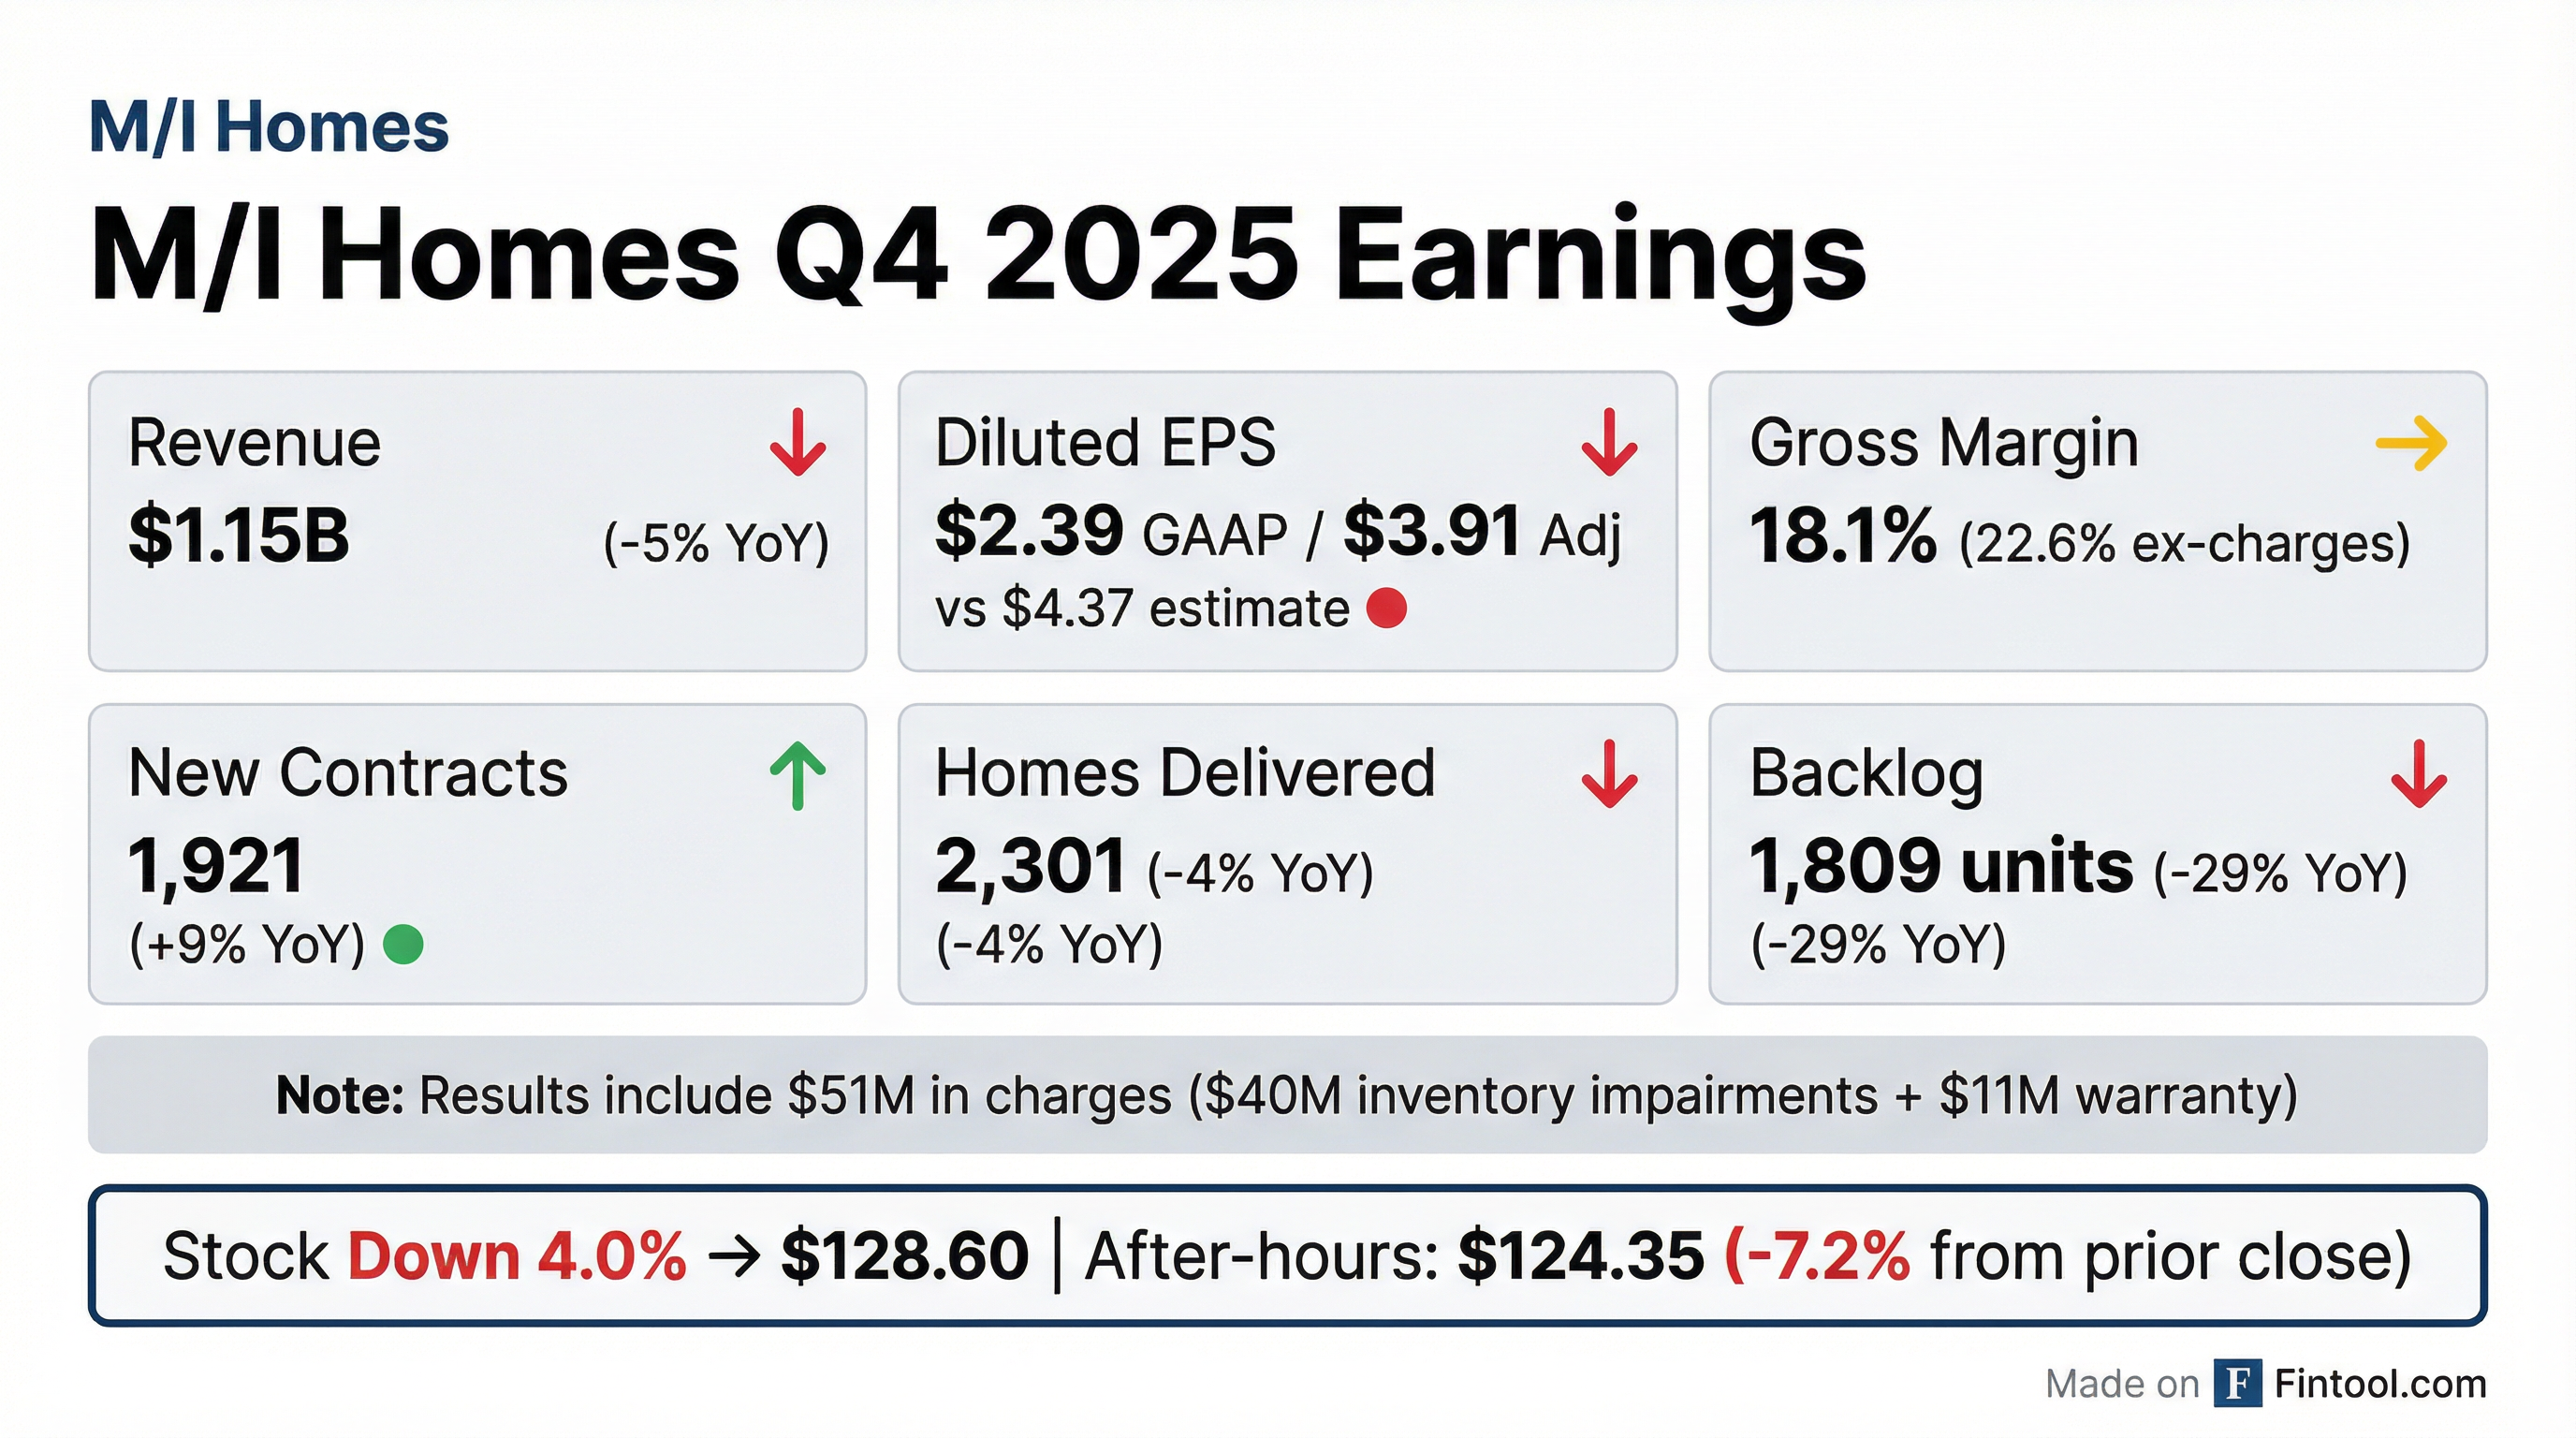
M/I Homes reported Q4 2025 results that missed expectations on both revenue and earnings, weighed down by $51 million in inventory impairments and warranty charges. The company is celebrating its 50th anniversary amid challenging conditions, though management struck a cautiously optimistic tone on the earnings call, noting "important improvement in traffic" heading into the spring selling season.
Did M/I Homes Beat Earnings?
No — MHO missed on both EPS and revenue.
The miss was driven by $51 million in charges:
- $40M inventory impairments ($30M impairments + $10M lot deposit write-offs)
- $11M warranty charges (two Florida communities)
Excluding these items, gross margin would have been 22.6% instead of the reported 18.1%.
What's Driving the Weakness?
Three factors pressured Q4 results:
1. Volume & Price Pressure
- Homes delivered: 2,301 (-4% YoY)
- Average selling price: $484K (-1% YoY)
- Housing revenue: $1.11B (-5% YoY)
2. Smart Series Mix Shift
- Smart Series (most affordable): 49% of Q4 sales vs 52% a year ago
- First-time buyers: 48% of sales vs 50% a year ago
- Entry-level margins under most pressure
3. Targeted Impairments Management framed the impairments as a deliberate reset rather than forced write-downs: "Our impairment covered about 1,000 lots... about 1,000 of the 25,000 lots." The $30K per lot charge clears problem communities to start 2026 with "all cylinders as strong as they can possibly be."
What's Working?
Despite the headline miss, several metrics showed improvement:
Monthly order trend showed acceleration:
- October: +18% YoY
- November: +6% YoY
- December: +4% YoY
Buyer quality remains strong:
- Average credit score: 747
- Average down payment: ~17% ($90,000+)
The 9% contract growth and improving sales pace are encouraging signals for 2026 deliveries. The high mortgage capture rate (94%) demonstrates the effectiveness of the buydown strategy.
How Did the Stock React?
MHO has now missed EPS estimates for four consecutive quarters after three straight beats:
The stock closed at $128.60 (-4.0%) and fell to $124.35 in after-hours trading (-7.2% from prior close).
Full Year 2025 Summary
Despite a challenging year, the company nearly matched record delivery volume of 9,000 homes. Financial services had a record year with $56M pre-tax income and 93% capture rate.
Balance Sheet Strength
Despite operating headwinds, the balance sheet remains solid — management called it "the best financial condition in our 50-year history":
The company has zero borrowings on its $900M credit facility. Debt maturities are well-spaced: bank line in 2030, public debt in 2028 and 2030.
What Did Management Say?
CEO Bob Schottenstein opened by highlighting a major milestone — M/I Homes celebrates its 50th year in business in 2026:
"Over the past 5 decades, our company has grown to become one of the nation's largest and most respected homebuilders... We are in the best financial condition in our history, have a group of leadership teams that are as strong as we've ever had, and we are well-positioned in our 17 markets."
On early 2026 demand signals:
"We certainly have seen an important improvement in traffic... It always does this time of year. Just feels a little better than even a year ago, though, to me."
On margin outlook:
"The margins are likely to remain under pressure, but it's not clear to me at this point that the pressure in 2026 will be as much as it was in 2025. So hopefully, those things are starting to level off a bit."
On the rationale for taking impairments now:
"Let's start 2026 with all cylinders as strong as they can possibly be. Whatever thing we think might be a problem, let's deal with it now."
Q&A Highlights: Market-by-Market Performance
Florida Markets — Orlando outperforming, Tampa rebounding:
- Orlando: "Clearly held up the best" — demand stronger than Tampa and Sarasota
- Tampa: "Was the toughest market for a while... business has picked up, very importantly"
- Sarasota: "So-so... C plus, B minus"
- Fort Myers/Naples: New market with "significant growth" — expecting "meaningful growth over the next several years"
Texas Markets — Bifurcated performance:
- Dallas & Houston: "Stayed pretty solid"
- Austin & San Antonio: "Weaker markets" — drove majority of impairments
Carolinas — Strength in the Southeast:
- Charlotte & Raleigh: "Have done very well"
Mortgage Buydown Strategy
The company detailed its incentive approach on the call:
Mortgage capture rate hit 94% in Q4, up from 91% a year ago.
CFO Phil Creek on customization: "We're able to deal individually with customers... So we're able to customize whatever we need to do with an individual customer, as opposed to throwing all kind of money to every customer that may or may not need that."
Where Did Impairments Concentrate?
The $40M inventory impairment was targeted:
- Price point: Entry-level communities with ASP below $375,000
- Geography: Led by Austin and San Antonio
- Scope: ~1,000 lots of 25,000 total owned (~4%)
- Per-lot charge: ~$30,000 average
Management framed it as a business decision: "We could have continued grinding through these communities... maybe at 10, 12% margins. But our view is when you look at the landscape of the business and the difficulty, especially at those lower price points... we decided to go to that last lever of dropping price."
Business Model Shift: Specs Dominate
A significant structural change is underway in MHO's sales mix:
CEO Schottenstein explained why: "The ability to provide a favorable rate buydown at any kind of a reasonable or at least acceptable cost... is, one of the conditions is that you can get the home closed within 60-90 days of the purchase of the buydown money, which means it's only going to really work for specs."
Operational improvements supporting the shift:
- Construction costs down 2% YoY
- Cycle time improved 5%
- Seeing "slight pickup in to-be-built business" recently
Capital Allocation
The company continued returning capital to shareholders:
- Q4 2025 Buybacks: $50 million
- FY 2025 Buybacks: $200 million
- 3-Year Buyback Total: 13% of outstanding shares
- Remaining Authorization: $220 million
- No dividend (M/I Homes does not pay a dividend)
With shares at $124 and book value at $123, MHO now trades at approximately 1.0x book value.
Regional Performance
New Contracts by Region:
The Southern region drove Q4 growth with a 13% increase, led by the Carolinas and recovering Florida markets. Nashville and Fort Myers/Naples, newer markets for MHO, are starting to contribute to the Southern region's growth.
Land Position by Region:
- Northern Region: 30% of owned lots
- Southern Region: 70% of owned lots
Lot Control: Company-wide, MHO owns ~26,000 lots (~3-year supply) and controls an additional 24,000 via options, totaling ~50,000 lots (5-6 year supply). 49% are option-controlled, providing flexibility.
2026 Outlook
Guidance provided on the call:
- Average community count: +5% YoY (vs +6% in 2025)
- Effective tax rate: ~23.5%
- No specific margin, revenue, or EPS guidance provided
Management tone on 2026:
- "We're optimistic about the first four or five months of this year in terms of demand and the selling season"
- Traffic improvements seen in late Q4 continuing into early 2026
- "Hopefully, spring selling season will be a little better than it has been"
- Planning to open more than 80 new communities this year
Key Risks to Monitor
-
Continued Margin Pressure: Gross margin of 18.1% was well below 24.3% in Q4 2024. Even excluding charges, 22.6% shows compression. Management expects pressure to continue but potentially moderate.
-
Entry-Level Exposure: Most impairments were in communities with ASP <$375K. "We've seen a little more pressure on prices and margins on the real entry-level, lower price for us."
-
Spec-Heavy Model: With 75-80% of sales from specs, the company is highly dependent on weekly traffic and closes. "We're relying on sales every week, every month."
-
Texas Weakness: Austin and San Antonio remain "weaker markets" and drove the majority of impairments.
-
Backlog Visibility: A 29% YoY decline in backlog units reduces near-term revenue visibility.
-
Weather Impact: "The last 5 days, things aren't very good anywhere because most people are frozen solid or snowed in."
The Bottom Line
M/I Homes delivered a disappointing quarter on reported numbers, but the Q&A revealed a more nuanced picture. New contracts grew 9% with accelerating monthly trends, traffic is improving, and management proactively cleared problem communities ahead of 2026. The impairments were concentrated in entry-level Austin/San Antonio communities — not a broad-based land problem.
The bull case: At 1.0x book value with $689M in cash, zero net debt, and a 50-year track record, MHO offers downside protection while spring traffic trends point to stabilization. Margins may have troughed as management noted "it's not clear... that the pressure in 2026 will be as much as it was in 2025."
The bear case: Four consecutive EPS misses, a spec-heavy model dependent on weekly sales, and persistent Texas weakness suggest earnings risk remains. The shift to 75-80% spec sales means the company is more exposed to demand volatility than its historical backlog-driven model.
Watch for: Spring selling season results (April earnings), community count growth execution (81 opened in 2025, more planned for 2026), and whether impairments are truly behind them.
Related Links: