Selwyn Joffe
About Selwyn Joffe
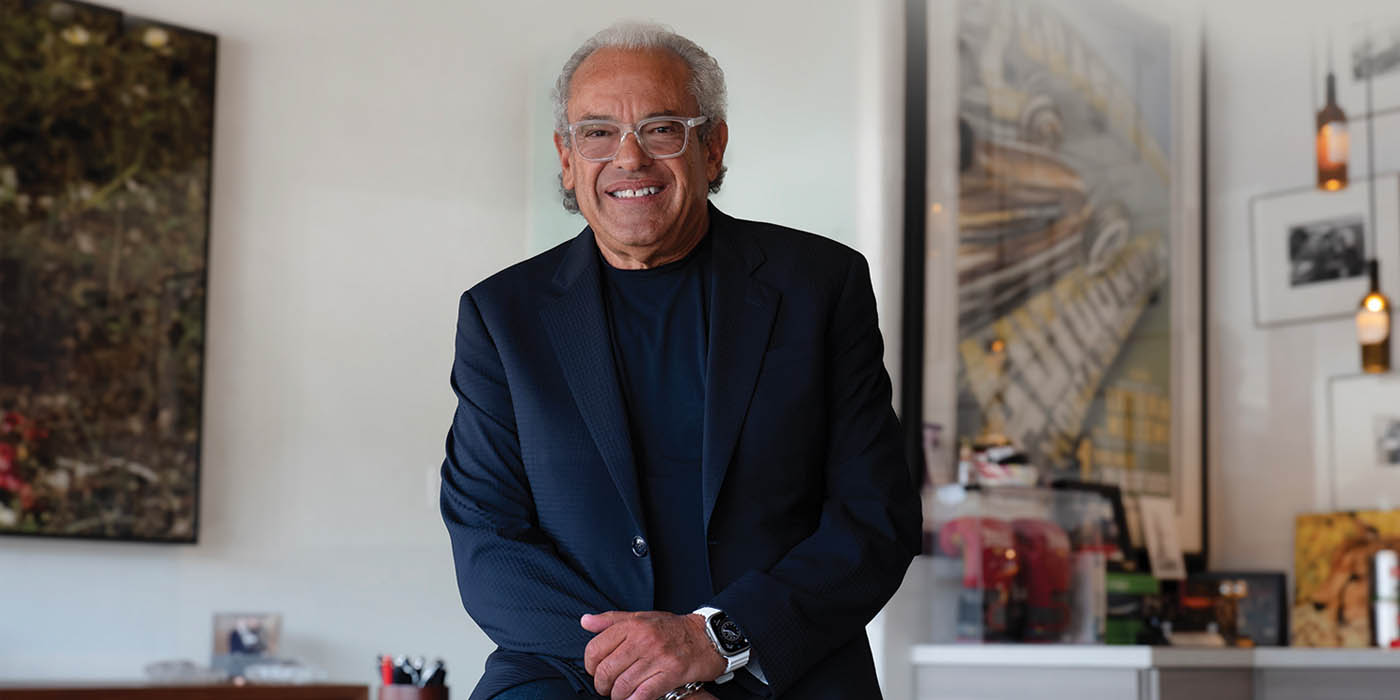
Selwyn Joffe, 67, is Chairman, President and Chief Executive Officer of Motorcar Parts of America (MPAA). He has been a director since 1994, Chairman since November 1999, and CEO since February 2003; he holds Business and Law degrees from Emory University and is a Certified Public Accountant . Fiscal 2025 performance included net sales up 5.5% to $757.4M, record gross profit of $153.8M, cash from operations of $45.5M, and net bank debt reduced to $81.4M; the company repurchased 542,134 shares for $4.8M and was added to the Russell 3000 index subsequent to year-end . Total shareholder return (SEC PVP framework) shows an initial $100 investment measured at $75 for FY2025 versus $264 for the peer group, indicating relative underperformance over the disclosed horizon .
Past Roles
| Organization | Role | Years | Strategic Impact |
|---|---|---|---|
| Protea Group, Inc. | Chairman & CEO (consulting and acquisition services) | Prior to Feb 2003 | M&A/roll-up and advisory background brought to MPAA |
| Netlock Technologies | President & CEO | Sep 2000–Dec 2001 | Led network security-focused company, adding technology/infosec exposure |
| Palace Entertainment, Inc. | Co-founder; President & COO | 1997–Aug 2000 | Executed an amusement parks roll-up; operating and M&A integration experience |
| Wolfgang Puck Food Company | President & CEO | 1989–1996 | Scaled consumer/brand-driven operations; P&L leadership |
External Roles
| Organization | Position | Years | Notes |
|---|---|---|---|
| California, Arizona & Nevada Automotive Wholesaler’s Association (CAWA) | Director | n/a | Industry trade association role; supports aftermarket network and advocacy |
Fixed Compensation
| Metric | FY2023 | FY2024 | FY2025 |
|---|---|---|---|
| Base Salary ($) | 828,256 | 828,256 | 828,256 (includes $24,000 disability premium) |
| Target Annual Cash Incentive (% of Salary) | n/d | n/d | 120% (per employment agreement amendments) |
- Employment agreement extended in March 2023 to July 1, 2027; benefits include $1,500/month auto allowance, optional medical allowance, and $24,000/year disability insurance payment (included in salary) .
Performance Compensation
Annual Cash Incentive (FY2025)
| Item | Detail |
|---|---|
| Company Metrics | Net Income after Adjustments; Net Sales; Cash from Operating Activities |
| Target Opportunity (FY2025) | $993,907 (grant date 06/03/2025) |
| Actual Paid (FY2025) | $1,185,731 |
Notes: Beginning FY2024, individual goals were removed so NEOs are measured as “One Team” on company goals; targets derived from Board-approved budget; payouts interpolate between threshold (50%), target (100%), and maximum (150%) per metric weighting .
Equity Incentive Structure (FY2025 grants)
| Grant Type | Grant Date | Target/Number of Units | Vesting/Performance | Grant Date Fair Value ($) |
|---|---|---|---|---|
| RSUs | 06/21/2024 | 44,795 | Time-vested, 1/3 on each anniversary | 299,679 |
| PSUs (relative TSR) | 06/21/2024 | 44,795 (Target) | 3-year performance; Relative TSR threshold/target/max at 30th/55th/80th percentile | 387,477 |
| RSUs | 11/25/2024 | 29,864 | Time-vested, 1/3 on each anniversary | 208,749 |
| PSUs (relative TSR) | 11/25/2024 | 29,864 (Target) | 3-year performance; Relative TSR threshold/target/max at 30th/55th/80th percentile | 265,192 |
| PSU Performance Metric (FY2025 long-term design) | Weighting | Threshold | Target | Maximum |
|---|---|---|---|---|
| Relative TSR vs defined Russell 3000 screen | 100% | 30th percentile | 55th percentile | 80th percentile |
PSU Outcomes (prior 2022 grant)
| Metric Outcome Basis | Result |
|---|---|
| EBITDA after Adjustments (40% weight) | Below threshold; 0% credit |
| Net Sales after Adjustments (30% weight) | $768.0M = 62.3% of target |
| Relative TSR (30% weight) | 35th percentile = 60% of target |
| Overall Company Performance Credit | 36.7% |
| Joffe PSUs (2022 grant) – Target vs Vested | 38,061 target; 13,964 vested |
Total Compensation (Summary Compensation Table)
| Fiscal Year | Salary ($) | Bonus ($) | Stock Awards ($) | Option Awards ($) | Non-Equity Incentive ($) | All Other ($) | Total ($) |
|---|---|---|---|---|---|---|---|
| 2023 | 828,256 | 100 | 1,909,131 | — | — | 93,264 | 2,830,752 |
| 2024 | 828,256 | 100 | 588,269 | 313,875 | 745,430 | 50,132 | 2,526,062 |
| 2025 | 828,256 | 100 | 1,161,097 | — | 1,185,731 | 56,837 | 3,232,021 |
Equity Ownership & Alignment
Beneficial Ownership and Guidelines
| Item | Value |
|---|---|
| Beneficial Ownership (shares) | 879,662 (includes 338,266 currently exercisable options under 2010 Plan and 27,900 under 2022 Plan) |
| % of Outstanding Shares | 4.5% (out of 19,352,135 shares) |
| Stock Ownership Guidelines (CEO) | 3x base salary requirement; Joffe in excess of 3x as of Mar 31, 2025 |
| Hedging & Pledging | Prohibited; 10b5-1 governed by Insider Trading Policy |
| Clawback | Adopted per Nasdaq/SEC; applies to performance- and time-vested equity and cash |
Unvested Equity and Outstanding Awards (as of 3/31/2025)
| Category | Count/Value |
|---|---|
| Unvested RSUs (selected lines) | 12,687 ($120,527) |
| Unvested RSUs (selected lines) | 44,795 ($425,553) |
| Unvested RSUs (selected lines) | 29,864 ($283,708) |
| Unearned PSUs (selected lines) | 13,964 ($132,658) |
| Unearned PSUs (selected lines) | 93,302 ($886,369) |
| Unearned PSUs (selected lines) | 67,193 ($638,329) |
| Unearned PSUs (selected lines) | 44,796 ($425,562) |
Vesting mechanics: RSUs vest one-third annually from grant date; PSUs vest solely on 3-year relative TSR performance against a defined Russell 3000 screen .
Stock Options – Expirations and Strikes (Joffe)
| Options (Exercisable/Unexercisable) | Exercise Price ($) | Expiration |
|---|---|---|
| 26,200 (exercisable) | 31.13 | 09/03/2025 |
| 51,200 (exercisable) | 28.68 | 06/23/2026 |
| 54,800 (exercisable) | 27.40 | 06/19/2027 |
| 83,400 (exercisable) | 19.00 | 06/17/2028 |
| 88,875 (exercisable) | 19.93 | 07/01/2029 |
| 33,791 (exercisable) | 15.12 | 06/16/2030 |
| 27,900 (exercisable) / 55,800 (unexercisable) | 9.32 | 09/20/2033 |
Employment Terms
| Term | Key Provision |
|---|---|
| Agreement Term | Extended March 2023 to July 1, 2027 |
| Base Salary | $828,256; CEO salary reviewed periodically |
| Annual Awards Eligibility | Discretionary equity awards under 2022 Plan (options, RSUs, PSUs, etc.) |
| Benefits | 4 weeks vacation; $1,500/mo auto allowance; medical allowance if opting out of company plan; $24,000/yr disability insurance |
| Termination – Cause | Accrued salary, bonus if any, reimbursables, and benefits through termination |
| Death/Disability | Accrued amounts; vested but undistributed equity; disability policy benefits |
| Termination w/o Cause or Good Reason (Outside CIC Period) | Salary at annual rate for two years; average bonus for two years; benefits; accrued amounts; vested but undistributed equity |
| Change in Control (CIC) | Table shows scenarios with/without termination; equity acceleration shown even upon CIC (separate column), with higher amounts if CIC with involuntary termination |
| Clawback | Dodd-Frank/Nasdaq-compliant; covers equity and cash |
| Deferred Compensation | Non-qualified plan with company match up to 3% of cash comp for participants |
Potential Payments Upon Termination or Change in Control (illustrative as of 3/31/2025)
| Scenario Component | Voluntary Good Reason or Company w/o Cause (Outside CIC) | After CIC: Good Reason or w/o Cause | CIC with Involuntary Termination | CIC (no termination) |
|---|---|---|---|---|
| Salary Contribution | $1,656,512 | $1,656,512 | — | — |
| Bonus | $1,931,162 | $1,931,162 | — | — |
| Executive Awards | $3,442,805 | $1,492,545 | $1,492,545 | $1,950,260 |
| Healthcare | $56,110 | $56,110 | — | — |
| Auto Allowance | $36,000 | $36,000 | — | — |
| Equity | — | — | $1,492,545 | $1,950,260 |
Board Governance (including dual-role implications)
- Board leadership: CEO and Chairman roles combined under Joffe; Board believes this facilitates agenda-setting and unified communication; a Lead Independent Director (Joseph Ferguson) presides at executive sessions, coordinates agendas, liaises with independents, and can call meetings of independent directors .
- Independence/Committees: Snapshot lists Joffe as not independent; committee memberships show independent directors on Audit, Compensation, and Nominating/Governance with chairs designated (e.g., Compensation Chair: Jeffrey Mirvis; Nominating/Governance Chair: Barbara Whittaker; Audit Chair: Philip Gay) .
- Governance policies: Majority voting for directors, annual elections, no poison pill; insider trading policy prohibits hedging and pledging; director and officer ownership guidelines require 3x salary/cash retainer within ~5 years .
Board Service Details (Joffe)
| Item | Details |
|---|---|
| Board Tenure | Director since 1994; Chairman since 1999 |
| Committee Roles | None listed for Joffe; not independent |
| Lead Independent Director | Joseph Ferguson (functions listed) |
| Independence | Not independent (CEO/Chair) |
Performance & Track Record
| Indicator | FY2025 Result |
|---|---|
| Net Sales | $757.4M (+5.5% YoY) |
| Gross Profit | $153.8M (+16.1% YoY) |
| Cash from Operations | $45.5M |
| Net Bank Debt | Reduced to $81.4M (-$32.6M) |
| Share Repurchases | 542,134 shares at avg $8.91; $4.8M |
| Index Addition | Added to Russell 3000 after FY end |
| Pay vs Performance – TSR | Value of $100 investment: Company $75; Peer group $264 (FY2025) |
Compensation Structure Analysis
- Mix shift and risk: FY2025 equity grants split 50/50 between time-based RSUs and PSUs; PSUs vest solely on 3-year relative TSR with 30th/55th/80th percentile hurdles, increasing external market alignment and variability of realized pay .
- Annual incentive design: FY2025 cash plan based entirely on company metrics (Net Income after Adjustments, Net Sales, Cash from Operating Activities), reinforcing “One Team” focus; Joffe’s target was $993,907 and payout was $1,185,731, indicating above-target performance vs the plan .
- Prior PSU results: The 2022 PSU tranche vested at 36.7% (EBITDA below threshold; net sales 62.3% of target; TSR 35th percentile), showing downside sensitivity to results .
- Governance safeguards: Hedging/pledging prohibited; clawback policy adopted per SEC/Nasdaq; CEO ownership exceeds 3x salary guideline .
Risk Indicators & Red Flags
- Combined CEO/Chairman requires strong counterbalances; Lead Independent Director structure, majority-independent board, committee independence, and ownership/hedging policies mitigate governance risk .
- Option expirations: Multiple legacy options expiring 2025–2027 and thereafter (e.g., $31.13 in 2025; $28.68 in 2026; $27.40 in 2027) could concentrate potential exercise activity around expirations; most recent option grant (2033) at $9.32 includes unexercisable tranches, indicating ongoing equity-motivated retention .
- Pledging/Hedging: Explicitly prohibited, reducing misalignment risk and margin-call-related forced selling .
Compensation Committee Analysis
- Membership and independence: Compensation Committee comprises independent directors; current members include Chair Jeffrey Mirvis, Anil Shrivastava, and Patricia (Tribby) Warfield; the committee reviewed CD&A and recommended inclusion in the proxy .
- No interlocks: No compensation committee interlocks or insider participation disclosed .
Equity Ownership Detail (beneficial and awards)
| Category | Detail |
|---|---|
| Beneficial Stake | 879,662 shares (4.5%); includes 338,266 (2010 Plan) and 27,900 (2022 Plan) currently exercisable options |
| Unvested/Unearned Equity | RSUs and PSUs outstanding as listed; market values provided as of FY-end |
| Ownership Alignment | CEO exceeds ownership guideline; directors/officers subject to strict anti-hedging/pledging rules |
Employment & Contracts Essentials
- Agreement through July 1, 2027; benefits include car allowance, medical allowance (if opting out), disability insurance; annual award eligibility under 2022 Plan at Compensation Committee discretion .
- Severance economics: If terminated w/o cause or for good reason (outside CIC period), two years of salary and average bonus, plus benefits and vested equity deliverables; after CIC, tabular amounts show cash and equity components with differing treatment depending on whether a termination occurs, indicating enhanced protection in a CIC context and some equity acceleration upon CIC .
Investment Implications
- Pay-for-performance alignment: A heavier emphasis on PSUs tied solely to relative TSR and removal of individual goals in cash incentives increases external and budget-linked accountability; the 2022 PSU payout at 36.7% and FY2025 above-target cash payout illustrate the plan’s sensitivity to both capital markets and operating execution .
- Retention and selling dynamics: Significant unvested RSUs/PSUs and staggered vest dates (Jun/Nov for FY2025 grants), combined with multiple option expirations (2025–2027), create identifiable calendar windows for potential insider activity; however, hedging/pledging prohibitions and ownership guidelines reduce adverse alignment risks .
- Governance quality vs concentration risk: Combined CEO/Chairmanship is counterbalanced by a strong Lead Independent Director role, majority-independent board, committee independence, and clawback—mitigating governance discount concerns .
- Track record and execution: FY2025 delivered record gross profit, improved cash generation, debt reduction, and buybacks, but disclosed TSR underperformed peers on the SEC PVP basis—investors may require sustained operating momentum and TSR catch-up to rerate the equity despite Russell 3000 index inclusion .
Citations: [1:x] refer to MPAA DEF 14A filed 2025-07-29.