NorthEast Community Bancorp, Inc./MD/ (NECB)·Q4 2025 Earnings Summary
NECB Q4 2025: EPS Misses But Zero NPAs and New Buyback Lift Shares
January 30, 2026 · by Fintool AI Agent
NorthEast Community Bancorp (NASDAQ: NECB) reported Q4 2025 results that missed Street estimates on both the top and bottom lines, but investors focused on the bank's pristine credit quality and aggressive capital return program. Shares rose 2.7% to $23.45 the day after earnings were announced .
The quarter at a glance:
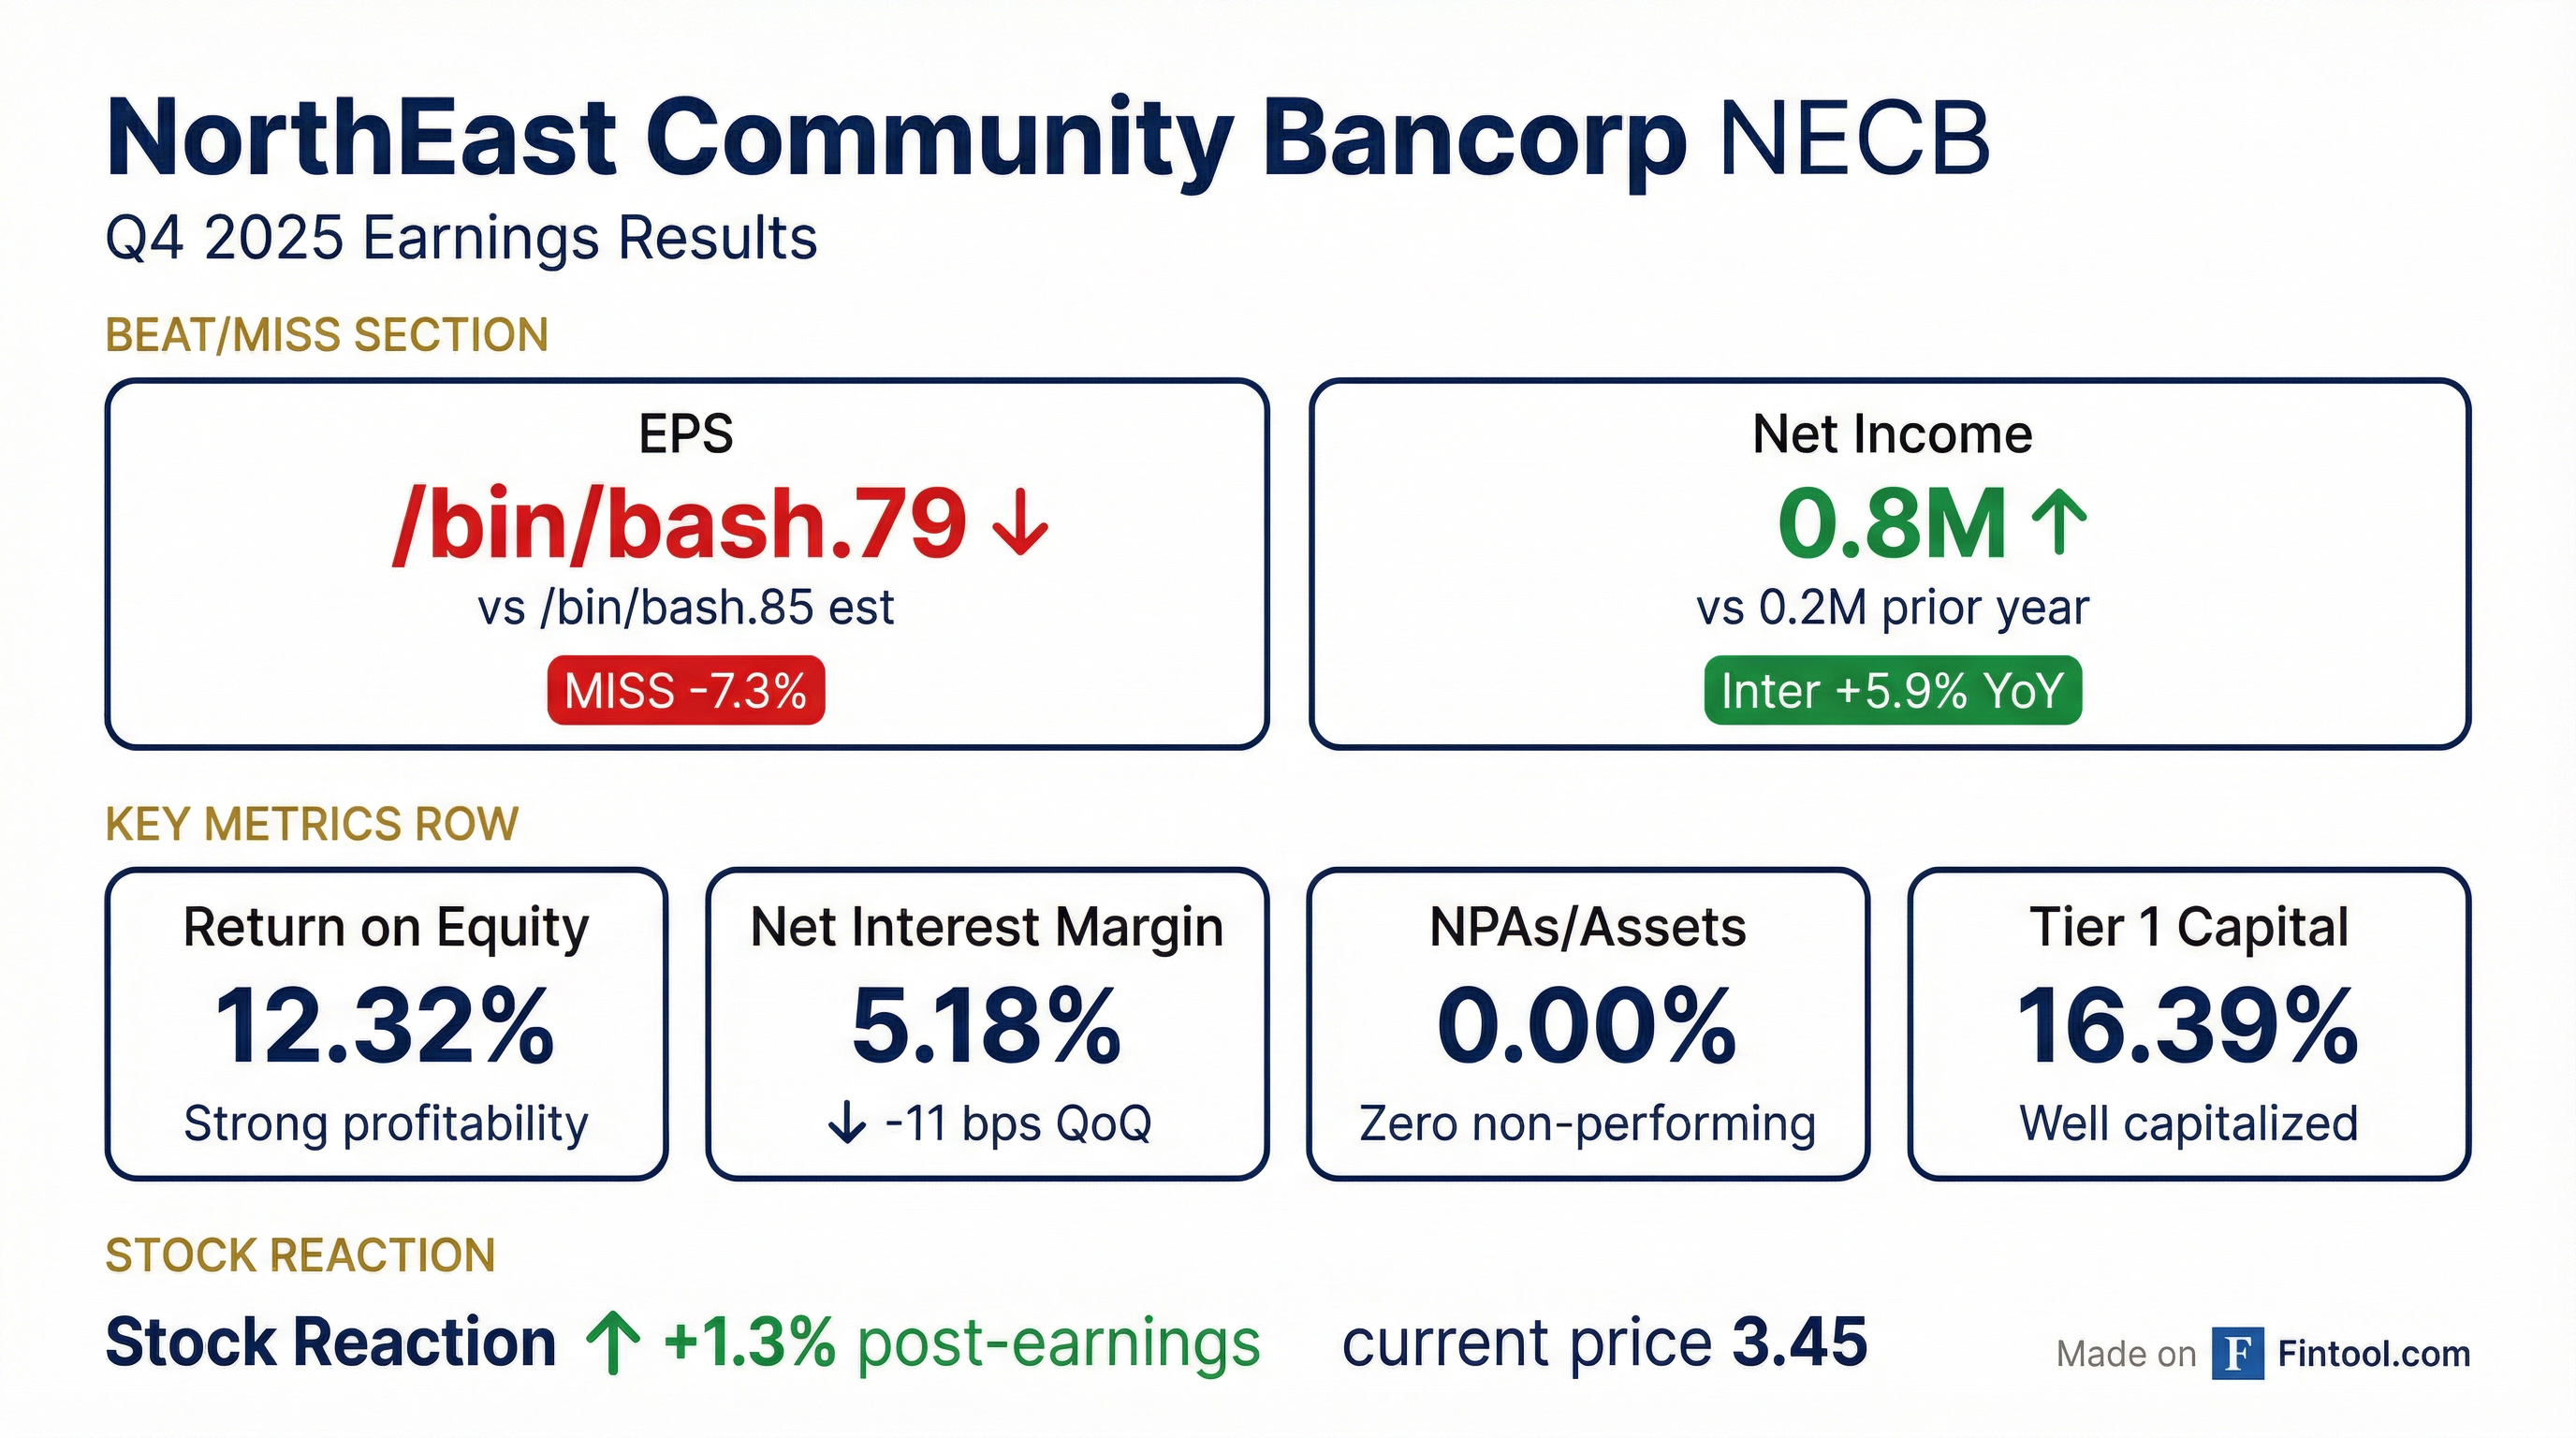
- EPS: $0.79 vs. $0.85 consensus (miss by 7.3%), but up from $0.75 in Q4 2024 (+5.3% YoY)
- Net Income: $10.8M vs. $10.2M prior year (+5.9% YoY)
- Net Interest Income: $25.5M vs. $25.3M prior year (+0.6% YoY)
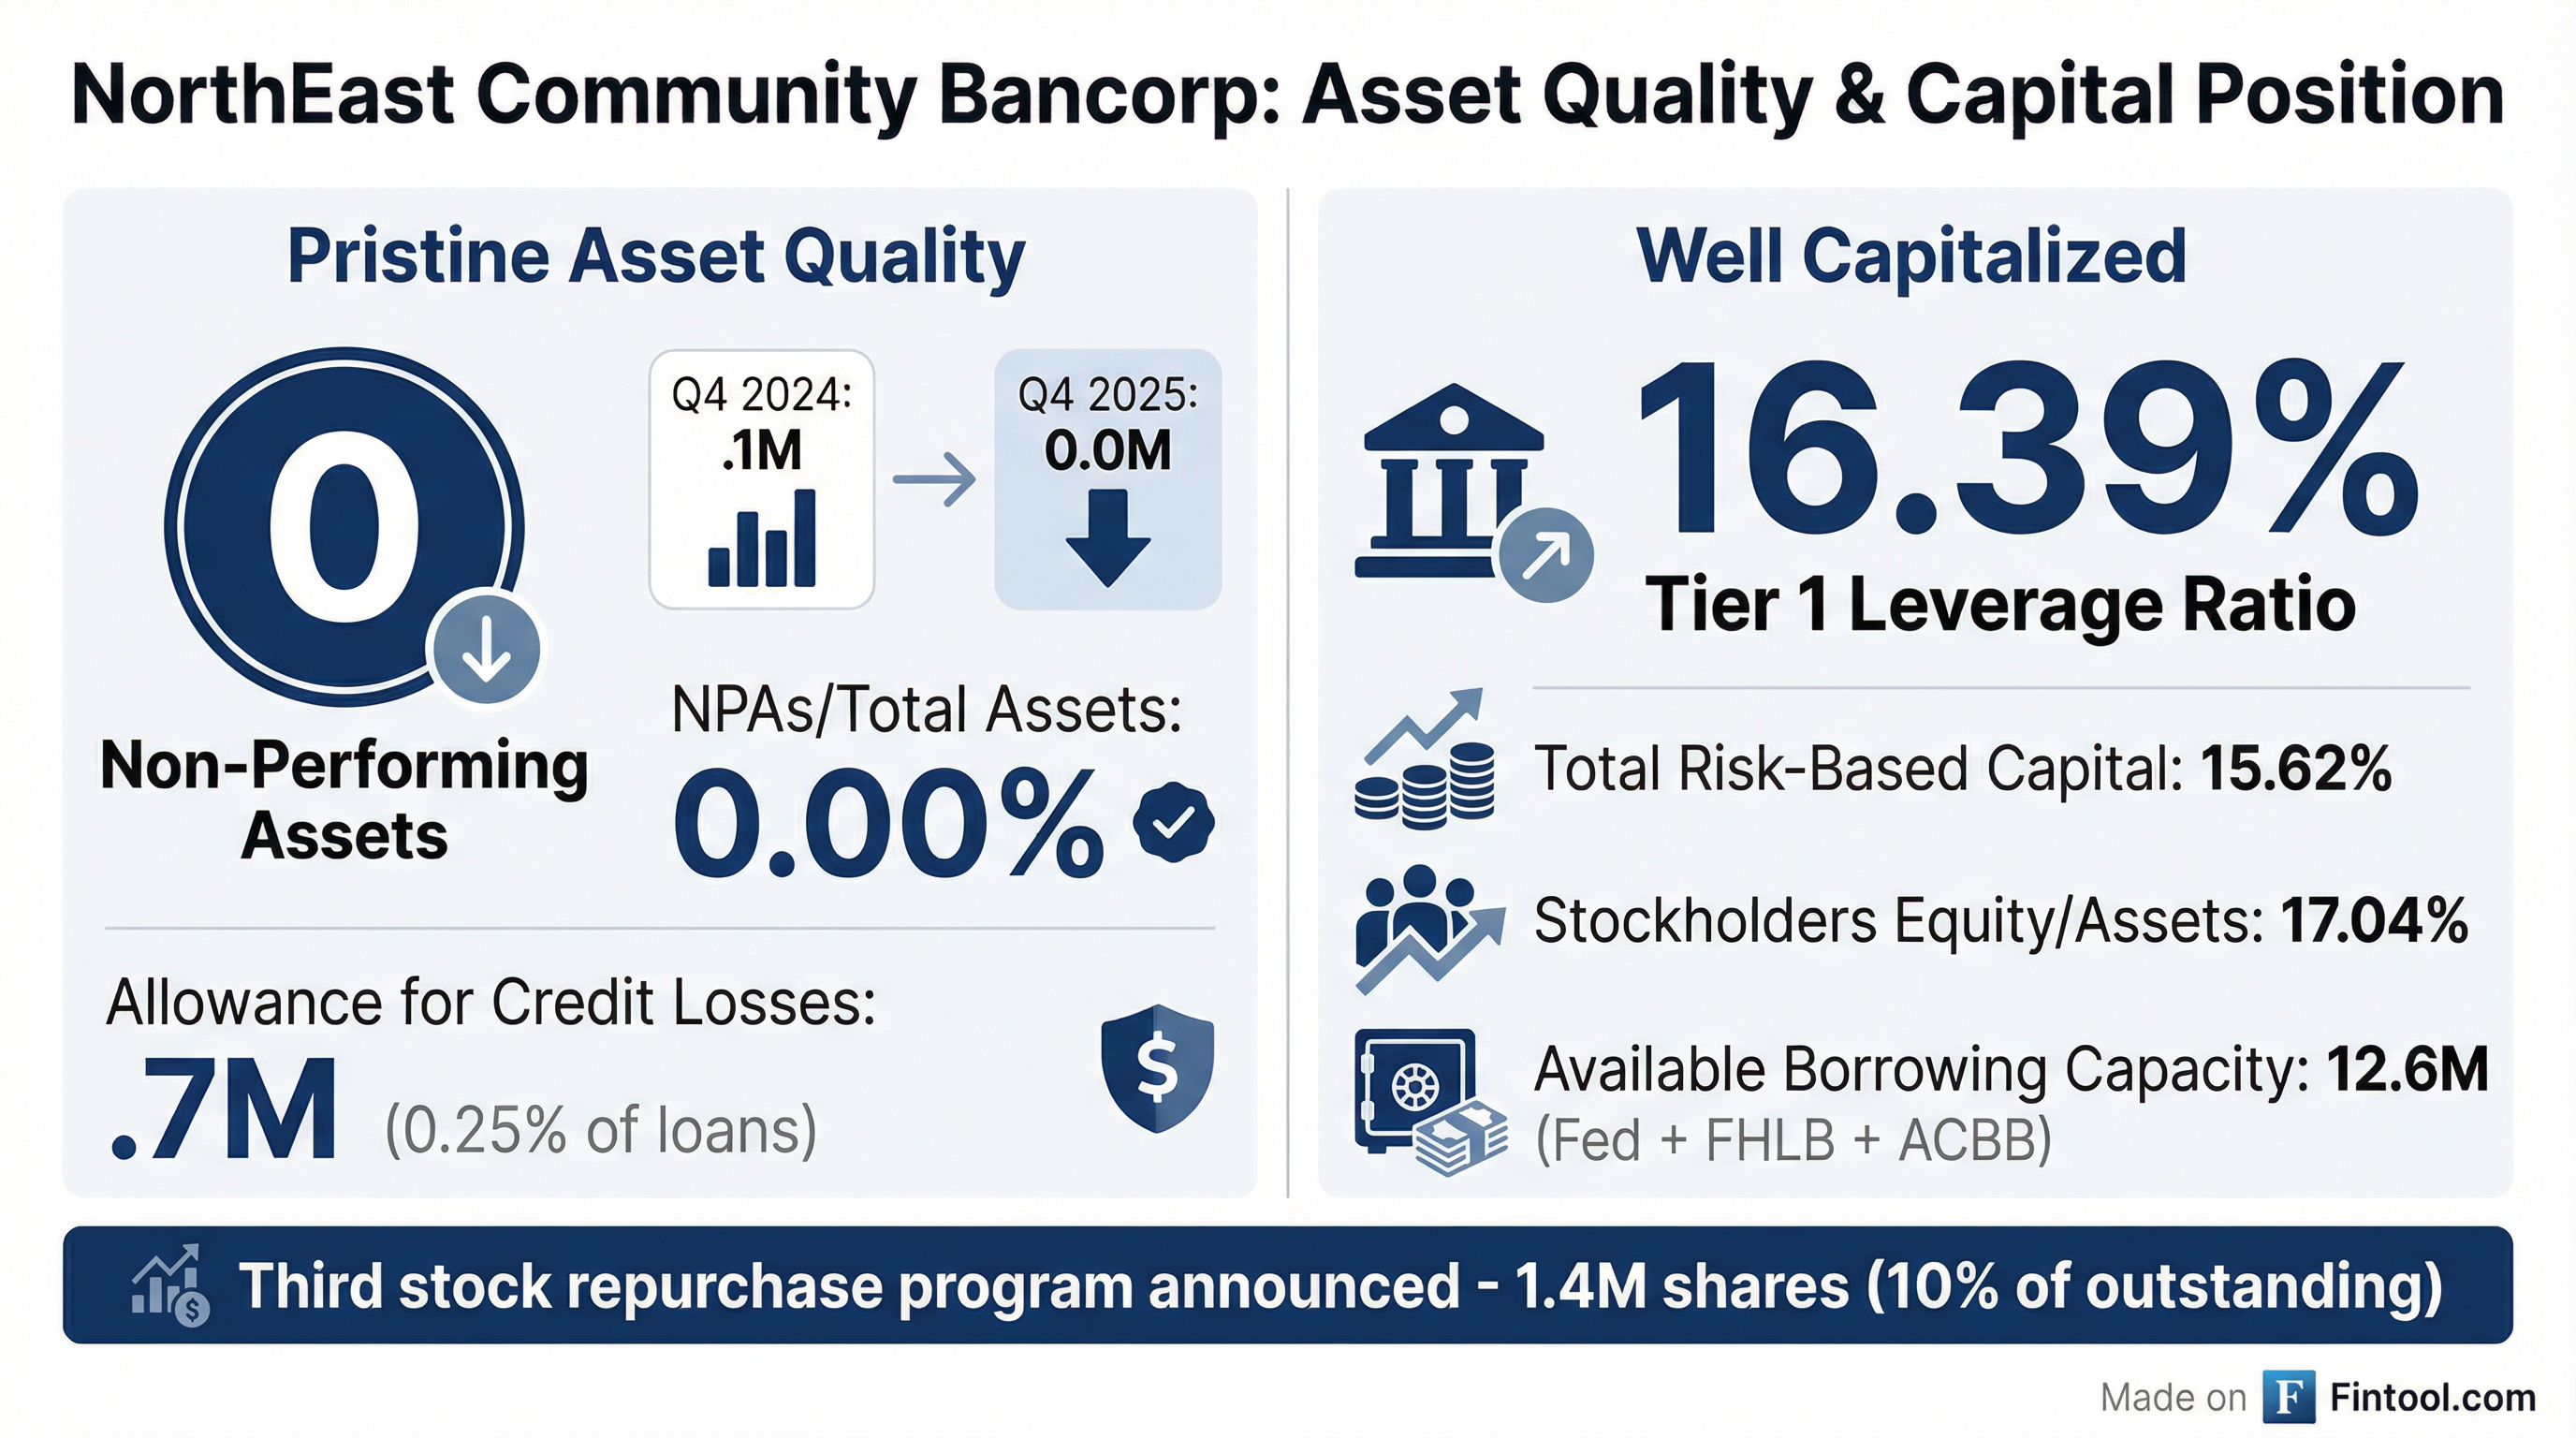
- Non-Performing Assets: $0, down from $5.1M a year ago
Did NECB Beat Earnings?
No. NECB missed consensus estimates on both EPS and revenue:
*Values retrieved from S&P Global
Despite the miss versus Street expectations, the company delivered year-over-year earnings growth. Net income increased 5.9% from $10.2M in Q4 2024 to $10.8M in Q4 2025 . The primary drivers were a $2.0M reduction in interest expense and a credit loss recovery of $334,000 (vs. a $1.0M credit loss expense in Q4 2024) .
Beat/Miss History (8 Quarters):
*EPS estimates from S&P Global
How Did the Stock React?
NECB shares were volatile around the announcement but ultimately finished higher:
- Pre-earnings (Jan 27): $23.15
- Earnings day (Jan 28): $22.82 (-1.4%)
- Post-earnings (Jan 29): $23.45 (+2.7%)
- 2-day net move: +1.3%
The positive reaction despite the earnings miss likely reflects investor focus on:
- Zero non-performing assets
- New stock buyback program
- Strong capital ratios supporting future returns
YTD Performance: +3.0% (vs. $22.77 on Jan 2, 2026)
What's the Net Interest Margin Story?
Net interest margin (NIM) compressed 11 basis points year-over-year, from 5.29% in Q4 2024 to 5.18% in Q4 2025 . This was driven by the 175 bps decrease in the Federal Funds rate from September 2024 to December 2025, which reduced yields on the bank's floating-rate loan portfolio faster than funding costs declined .
CEO Kenneth Martinek noted that "loan demand remains strong with outstanding unfunded commitments exceeding $680 million" , suggesting the lending pipeline remains robust despite rate pressure.
What's Special About Asset Quality?
NECB's credit quality is exceptional. The bank reported zero non-performing assets as of December 31, 2025 — a significant improvement from $5.1M a year ago .
Key Credit Metrics:
The bank sold two foreclosed properties during 2025: a Bronx property for no loss (with NECB providing financing for the buyer to complete the project), and a Pittsburgh property at a $273,000 loss .
What Changed From Last Quarter?
Positive developments:
- Non-interest income surged 562% QoQ to $987K, driven by unrealized gains on equity securities ($55K gain vs. $554K loss in Q4 2024) and higher loan fees
- Credit loss recovery of $334K (vs. $1.0M expense in Q4 2024) from unused interest reserve deposits
- Stockholders' equity increased 10.5% YoY to $351.7M
Areas of concern:
- Non-interest expense increased 12.8% to $11.2M, driven by a $980K increase in salaries and benefits
- Efficiency ratio deteriorated to 42.31% from 38.99% in Q4 2024
- Total deposits declined 3.2% YoY to $1.6B as certificates of deposit decreased $101.3M
What's the Capital Return Story?
NECB announced its third stock repurchase program in December 2025, authorizing the buyback of 1.4 million shares (10% of outstanding) . As of December 31, 2025, the company had already repurchased 40,924 shares at a cost of $938,000 .
Capital Position:
The bank is significantly over-capitalized, with capital ratios roughly 3-4x regulatory minimums. Combined with available borrowing capacity of $812.6M from the Fed, FHLB, and ACBB , NECB has substantial flexibility for continued buybacks and potential special dividends.
What Did Management Emphasize?
CEO Kenneth Martinek highlighted several themes:
"We are once again pleased to be able to report continued strong performance throughout our entire loan portfolio, with continuing focus on construction lending in high demand, high absorption sub-markets."
Key strategic priorities mentioned:
- Construction lending focus: Outstanding unfunded commitments exceed $680M, with 41.2% of new construction loans disbursed at closing
- NYC cooperative lending growth: The cooperative corporation lending program continues to expand
- Massachusetts multi-family expansion: Growing presence in Eastern Massachusetts
The company also announced a board transition: Linda M. Swan retired after 28 years, and Lynette Bennett was appointed as a new director .
Full-Year 2025 Summary
Full-year profitability metrics declined from record 2024 levels due to NIM compression and higher operating expenses, but remain strong on an absolute basis. The bank's ROA of 2.21% and ROE of 13.12% are well above industry averages.
Forward Catalysts
Near-term:
- Fed rate trajectory — additional cuts would further compress NIM but benefit asset quality
- $680M+ unfunded construction pipeline provides visibility into future loan growth
- Stock buyback execution pace
Longer-term:
- NYC and Massachusetts market expansion
- Deposit repricing as high-rate CDs mature
- Potential for special dividend given excess capital
Read the full Q4 2025 8-K filing | View NECB Company Profile | Compare to Q3 2025 Earnings