Paymentus Holdings (PAY)·Q4 2025 Earnings Summary
Paymentus Beats Q4 But Stock Falls 6% as Growth Decelerates to 16-18%
February 23, 2026 · by Fintool AI Agent
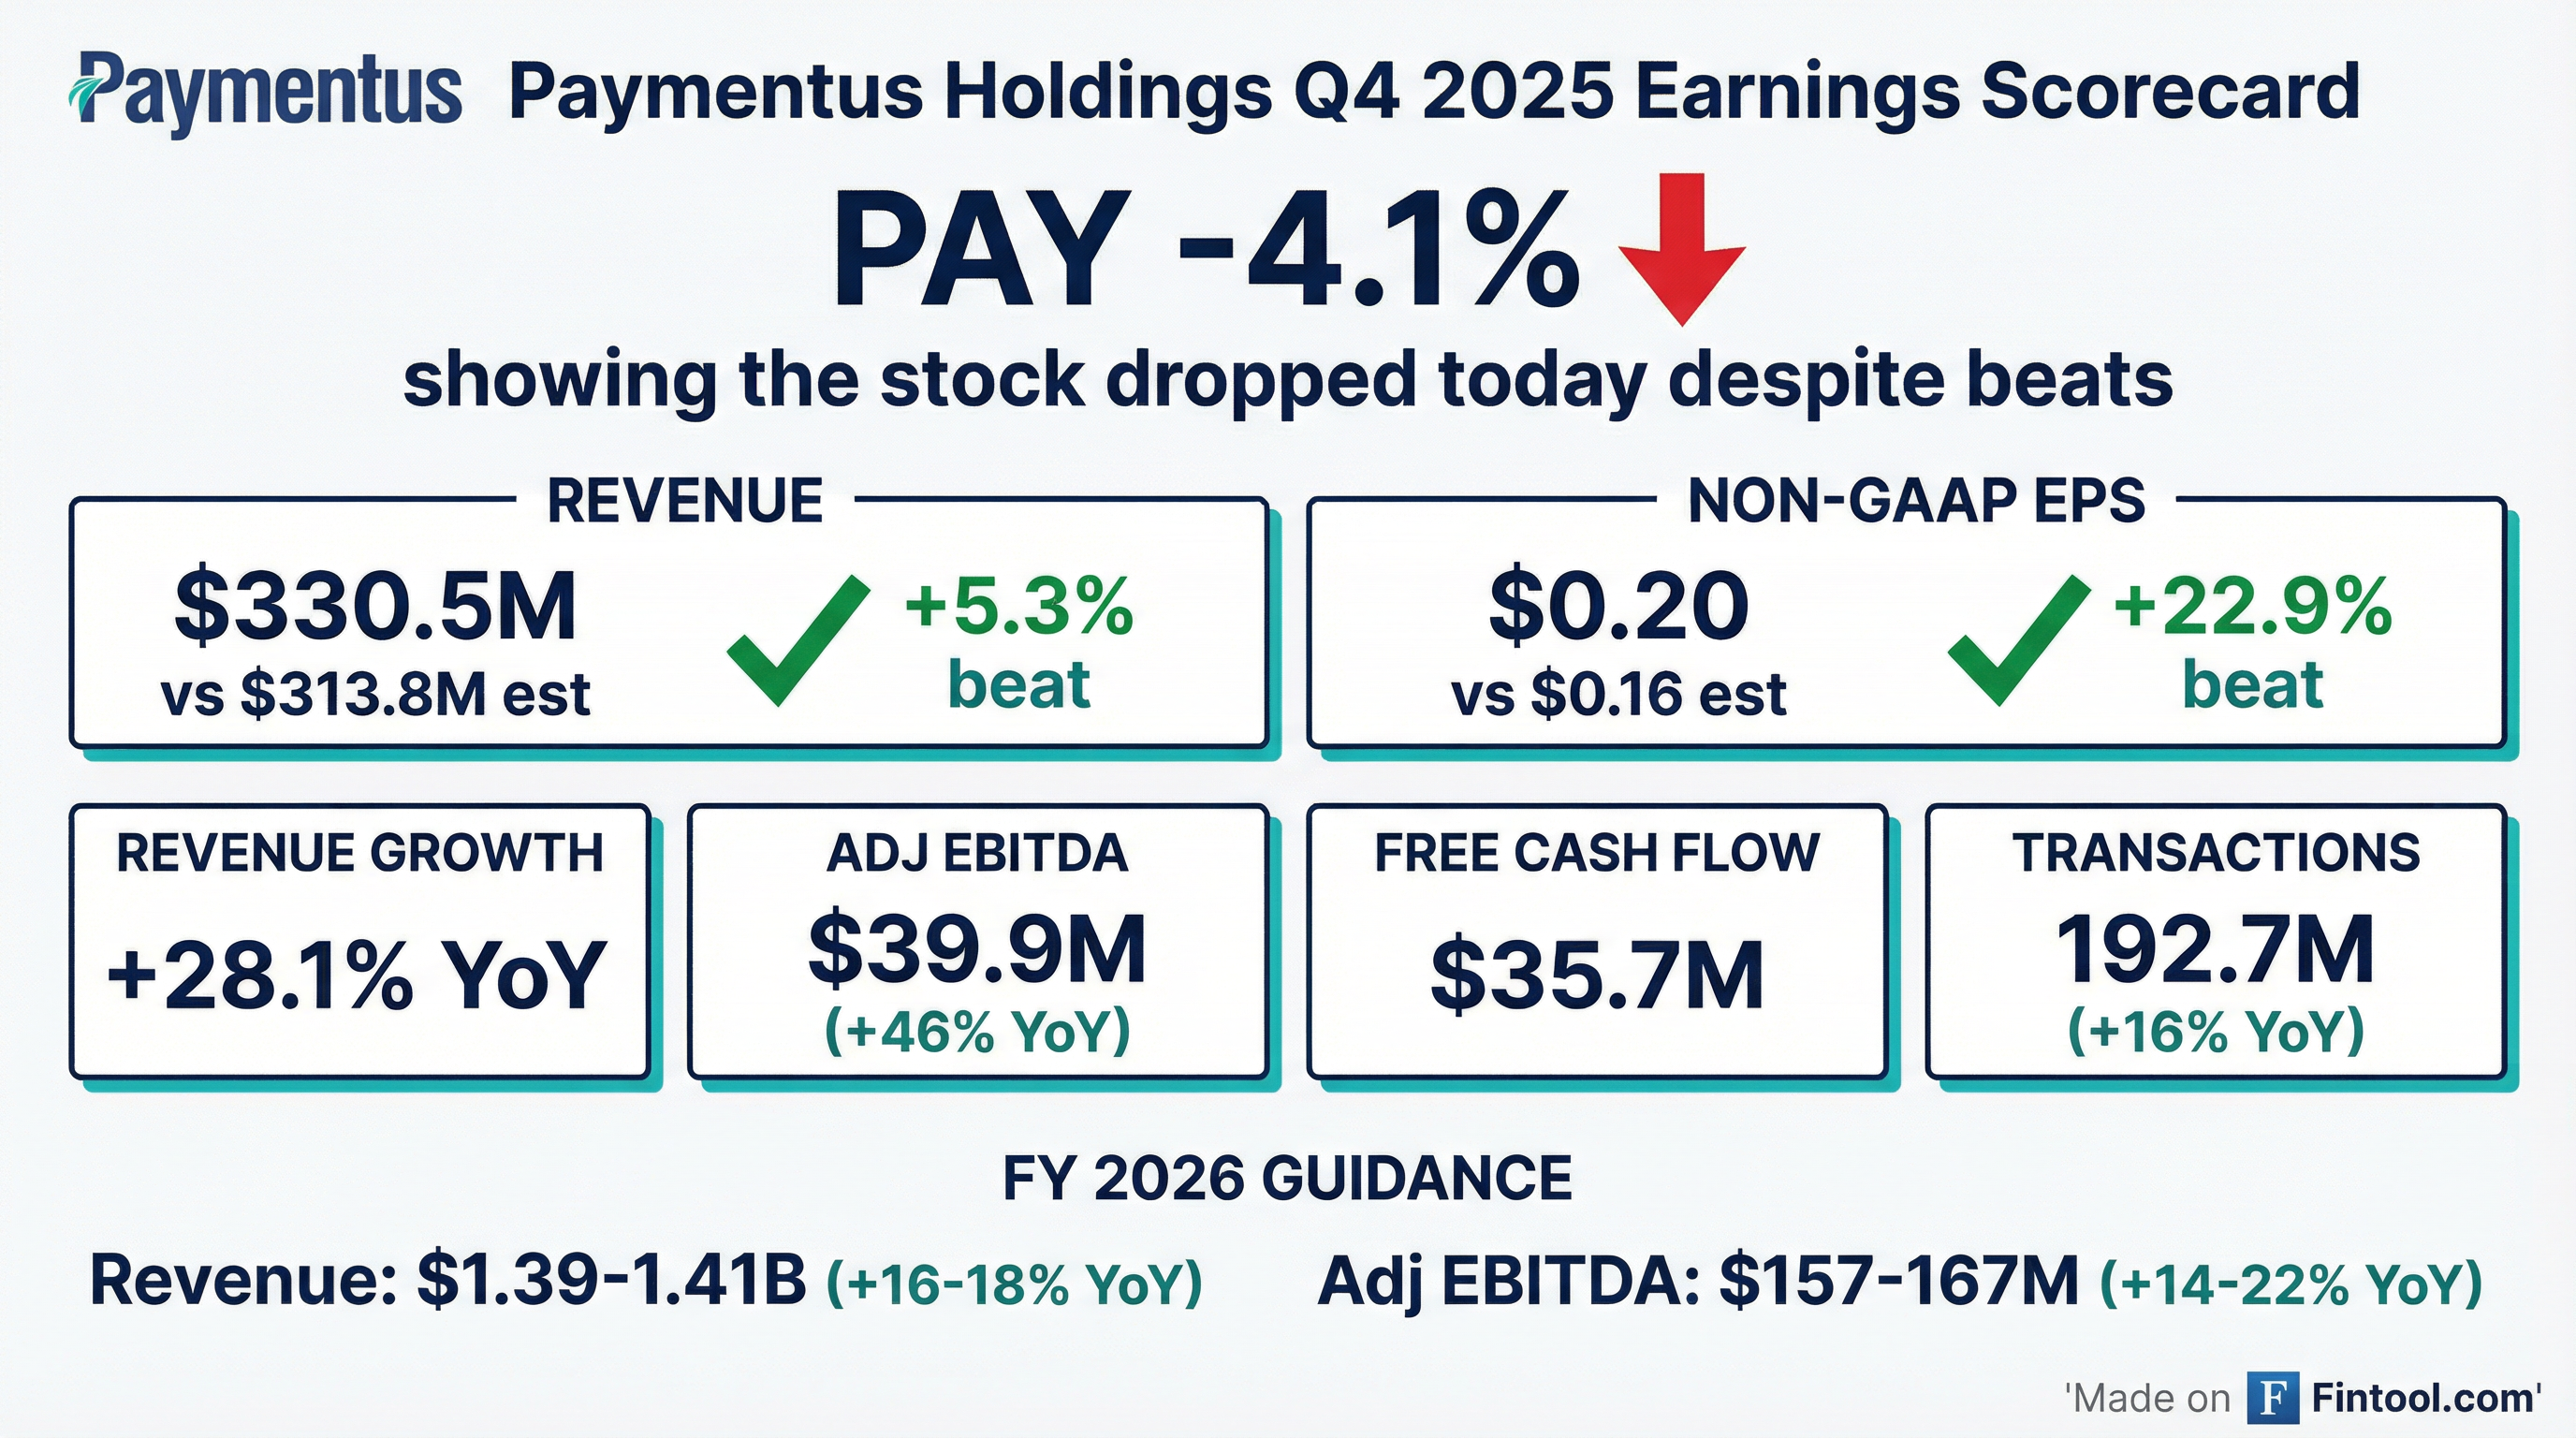
Paymentus delivered its 8th consecutive quarterly beat with Q4 2025 revenue of $330.5M (+28.1% YoY) and non-GAAP EPS of $0.20, topping estimates by 5.3% and 22.9% respectively . Despite the strong results, the stock fell ~6% as FY 2026 guidance implies a significant growth deceleration to 16-18%, down from 37.3% revenue growth in FY 2025 .
Did Paymentus Beat Earnings?
Yes — Paymentus beat on both top and bottom line, extending its perfect beat streak:
Estimates from S&P Global
The beat was driven by strong transaction growth of 16.1% YoY to 192.7M transactions and continued momentum across multiple verticals including utilities, telecommunications, government agencies, and healthcare .
Full year 2025 results were equally impressive: revenue of $1.2B (+37.3% YoY) and adjusted EBITDA of $137.4M (+45.9% YoY) .
How Did the Stock React?
Despite beating estimates, PAY stock fell 5.9% to $24.40 on earnings day and dropped further in after-hours trading to $23.10 (-10.9% from prior close of $25.92). This marks the third consecutive quarter of negative stock reaction despite beating estimates.
Values retrieved from S&P Global
The stock has beaten estimates every quarter but delivered negative returns in 3 of the last 4 quarters, suggesting the market is focused on forward growth rather than backward-looking beats.
What Did Management Guide?
Paymentus provided guidance that disappointed investors with an implied growth deceleration :
The key concern: FY 2026 revenue guidance of $1.39-1.41B implies 16-18% growth, a steep deceleration from:
- FY 2025: +37.3% revenue growth
- Q4 2025: +28.1% YoY growth
Q1 2026 revenue guidance of $330-340M is essentially flat to Q4 2025's $330.5M, reflecting normal seasonality in the bill payment business.
What Changed From Last Quarter?
Contribution Profit Margin Compression: The contribution profit margin declined to 32.3% in Q4 2025 vs 33.4% in Q4 2024 — down 110bps YoY . For FY 2025, the margin was 32.3% vs 35.8% in FY 2024 (-350bps), reflecting the mix shift from interchange-heavy transactions.
EBITDA Margin Expansion: Despite contribution margin pressure, adjusted EBITDA margin expanded to 37.3% in Q4 2025 vs 31.6% in Q4 2024, demonstrating operating leverage .
Cash Generation Improved Dramatically: Free cash flow surged to $125.0M in FY 2025, up from $27.1M in FY 2024 (+361% YoY), driven by improved working capital with DSO declining from 43 to 28 days .
Balance Sheet Strength: Cash and equivalents reached $324.5M (+55% YoY) with zero debt .
Key Performance Indicators
Key Q4 2025 Highlights
Management highlighted several accomplishments :
- Strong Backlog: Exited the quarter with strong bookings and significant backlog providing visibility into 2026
- Demand Momentum: Continued strength across utilities, telecommunications, government agencies, educational institutions, banking, property management, healthcare, insurance, and new verticals
- Channel Partnerships: Signed new partnerships in consumer finance and utilities
- Client Implementations: Implemented clients across utilities, government agencies, telecommunications, insurance, and healthcare
- Revenue Per Transaction: Increased 11% YoY to $1.72, driven by large enterprise billers with higher average payment amounts
What Did Management Say About AI?
In a detailed Q&A exchange, CEO Dushyant Sharma positioned Paymentus as a beneficiary of the AI revolution, not a victim :
"We actually believe we are going to be the ultimate beneficiary of the AI revolution in our space... Our business model is designed in a way where we offer a world-class platform to our clients at no cost. We are only getting paid for consumption of our platform."
Key points on AI positioning :
- No subscription fee exposure: Unlike SaaS companies that charge subscription fees and hope customers don't use the product, Paymentus only gets paid on consumption
- AI as opportunity: "AI has opened the floodgates of opportunity for Paymentus. Everywhere we look, we are seeing opportunities."
- Agentic AI in bill pay: Management sees agentic AI playing a "big role in bill payments" given the recurring, low-risk nature of bill pay transactions
- Historical AI focus: Company has been focused on AI for years and once attempted to acquire an AI company
Q&A Highlights
On Growth Vectors (Darrin Peller, Wolfe Research): CFO Sanjay Kalra ranked the four growth vectors :
- New implementations — Largest driver, will remain so
- Same-store sales — Second largest, "doing really well"
- Early implementations — Potential upside
- IPN network — "Strong vector" with good recent performance
On Same-Store Sales Opportunity (Tien-Tsin Huang, J.P. Morgan): CEO Sharma noted the company could "more than double our business in our existing customer base and still not be done 100%" — highlighting the massive embedded growth opportunity .
On Enterprise Billers Driving Revenue Per Transaction (Will Nance, Goldman Sachs): The 11% YoY increase in revenue per transaction reflects large enterprise clients with higher average payment amounts. Contribution profit per transaction also improved 5.8% YoY .
On Guidance Conservatism (Madison Suhr, Raymond James): Management emphasized their prudent approach — they need four full quarters of experience with new large enterprise billers before fully baking trends into guidance. Notably, the high end of FY 2026 guidance can be achieved without booking any new customers .
Market Share and TAM
A key bull case element: Paymentus has captured only 4.3% market share at the end of 2025, despite being a $1.2B revenue business . The bill payment market remains large and relatively untapped:
- Disruption track record: At inception, "vintage bank bill pay" dominated digital payments — now it's a fraction of overall volume
- 100% revenue growth achieved twice: From $300M (IPO 2020) to $600M (2023) to $1.2B (2025)
- "Still just getting started": CEO believes the company is strategically better positioned now than even a few years ago
Investment Highlights
The company emphasized its key investment thesis :
- Strong business model: Consistently meets or exceeds long-term CAGR model of 20% top-line growth and 20-30% adjusted EBITDA dollar growth
- Large, non-discretionary market: Bill payment TAM is vast and still relatively untapped
- Ever-growing technology footprint: State-of-the-art platform with innovative DNA
- Proprietary IPN ecosystem: Network effects from instant payment network
- Operating leverage: Scalable model demonstrating margin expansion
- Diversified customer base: Large and growing across multiple verticals
- Fortress balance sheet: $324.5M cash, zero debt, $125M free cash flow in 2025
Forward Catalysts
Positive:
- Strong backlog should support revenue visibility
- New vertical expansion (consumer finance, insurance)
- Operating leverage driving margin expansion despite top-line deceleration
- Zero debt balance sheet provides flexibility
Risks to Monitor:
- Growth deceleration may continue beyond FY 2026
- Contribution margin compression from transaction mix shift
- Client implementation timing and seasonality
- Macro sensitivity to discretionary payment volumes
The Bottom Line
Paymentus delivered another beat with Q4 2025 revenue +5.3% and EPS +22.9% above estimates, but the stock fell ~6% as FY 2026 guidance implies a sharp growth deceleration from 37% to 16-18%. The company is transitioning from hypergrowth to mature growth, with improving cash generation and EBITDA margins partially offsetting contribution margin pressure.
The bull case remains intact: Only 4.3% market share captured, same-store sales can "more than double" the existing business, and management can hit the high end of FY 2026 guidance without signing any new clients. The AI/agentic discussion suggests management sees its consumption-based model as defensible against disruption.
The bear case: Growth deceleration may persist, contribution margins are compressing, and the stock has now fallen on 3 of the last 4 earnings despite beating estimates. At ~$23/share in after-hours trading (down ~11% from pre-earnings), investors are recalibrating to a lower-growth profile.
Analysis based on Paymentus Q4 2025 earnings call transcript and S&P Global estimates data.