Earnings summaries and quarterly performance for PRINCIPAL FINANCIAL GROUP.
Executive leadership at PRINCIPAL FINANCIAL GROUP.
Deanna Strable
President and Chief Executive Officer
Amy Friedrich
President, Benefits and Protection
Christopher Littlefield
President, Retirement and Income Solutions
Joel Pitz
Executive Vice President and Chief Financial Officer
Kamal Bhatia
President and Chief Executive Officer, Principal Asset Management
Natalie Lamarque
Executive Vice President, General Counsel and Secretary
Board of directors at PRINCIPAL FINANCIAL GROUP.
Alfredo Rivera
Director
Blair Pickerell
Director
Clare Richer
Director
Claudio Muruzabal
Director
Diane Nordin
Director
Elizabeth Mitchell
Director
Jocelyn Carter-Miller
Director
Jonathan Auerbach
Director
Maliz Beams
Director
Roger Hochschild
Director
Scott Mills
Lead Independent Director
Research analysts who have asked questions during PRINCIPAL FINANCIAL GROUP earnings calls.
Joel Hurwitz
Dowling & Partners Securities, LLC
8 questions for PFG
Suneet Kamath
Jefferies
8 questions for PFG
John Barnidge
Piper Sandler
7 questions for PFG
Ryan Krueger
KBW
6 questions for PFG
Jack Matten
BMO Capital Markets
5 questions for PFG
Thomas Gallagher
Evercore
5 questions for PFG
Wesley Carmichael
Autonomous Research
5 questions for PFG
Wilma Burdis
Raymond James Financial
5 questions for PFG
Alex Scott
Barclays PLC
4 questions for PFG
Jimmy Bhullar
JPMorgan Chase & Co.
3 questions for PFG
Francis Matten
BMO Capital Markets
2 questions for PFG
Jamminder Bhullar
JPMorgan Chase & Co.
2 questions for PFG
Tom Gallagher
Evercore ISI
2 questions for PFG
Wes Carmichael
Wells Fargo
2 questions for PFG
Wilma Jackson Burdis
Raymond James
2 questions for PFG
Elyse Greenspan
Wells Fargo
1 question for PFG
Joshua Shanker
Bank of America Merrill Lynch
1 question for PFG
Michael Ward
Citi Research
1 question for PFG
Taylor Scott
BofA Securities
1 question for PFG
Recent press releases and 8-K filings for PFG.
- Delivered 4Q25 adjusted EPS growth of 12% (20% reported), free cash flow at the top end of target, and ROE up 120 bps, then guided 2026 to 9–12% EPS growth, 15–17% ROE, and 75–85% free cash flow payout.
- Prioritizes the retirement ecosystem, small-to-mid-sized business (employers ≤1,000) and global asset management, with SMB retirement and benefits segments showing resilient ~2% natural employee growth and high customer tenure.
- Employee benefits mix drives pricing flexibility: dental claims rose post-COVID on utilization and cost, while life & disability loss ratios fell, allowing annual repricing for stable bundled premiums.
- Rapid AI integration expanded tool access from under 1,000 to 17,000 employees, with 7,000 daily users, enhancing underwriting, claims, customer service, and distribution workflows.
- Maintains a 40% dividend payout target, returning 75–85% of capital via dividends and share buybacks, and has grown its dividend each quarter in recent years.
- Strong 2025 financials: Delivered 12% adjusted EPS growth (top end of target) and ~20% reported EPS, with free cash flow and ROE both at or above target ranges; 2026 outlook targets 9%–12% EPS growth, ROE 15%–17%, and 75%–85% FCF.
- SMB strategy: U.S. small/midsize business segment (employers ≤1,000) shows ~2% natural employee growth, resilient recurring deposits, and a survey where 95% plan stable/increase salaries and 85% plan stable/increase employment.
- Employee benefits trends: Post-COVID, dental claims (cost and incidence) have risen while life & disability loss ratios have declined; annual repricing of bundled benefits enables stable overall premiums.
- Private asset management growth: Achieved $3.5–4 billion of positive flows in real estate, private credit, and infrastructure in 2025; launching a European data center fund attracting Asia/Middle East investors.
- For 2025, Principal delivered 12% adjusted EPS growth (nearly 20% reported), free cash flow at the top end of its target, and increased ROE by 120 bps; for 2026 it targets 9–12% EPS growth, raised its ROE goal to 15–17%, and expects 75–85% free cash flow conversion.
- The U.S. SMB segment (employers up to 1,000 employees) maintained stable natural employee growth (~2%), resilient recurring deposits, and average customer tenure >10 years, driving outsized growth in retirement and benefits.
- In its benefits business (bundled dental, life & disability), dental claims have risen post-COVID while life and disability loss ratios have declined, resulting in an overall loss ratio below target and annual repricing for premium stability.
- Global asset management achieved $3.5–4 billion of net inflows in private real estate, credit, and infrastructure in 2025, launched a European data center fund, and serves clients in 80 countries with combined U.S. and local expertise.
- Capital deployment emphasizes a 40% dividend payout and total shareholder distributions of 75–85% via dividends and buybacks, supported by a 22% leverage ratio and selective inorganic optionality.
- FY 2025 non-GAAP EPS of $8.55, up 12% y/y, and Q4 EPS of $2.24, up 7% y/y.
- Return on equity of 15.7% (↑120 bps) and margin expansion to 31%, with free capital flow conversion of 92%.
- $1.5 billion returned to shareholders in 2025 (including $851 million of buybacks and $684 million of dividends), ending the year with $1.6 billion of excess capital; Q1 2026 dividend set at $0.80, a 7% increase.
- Year-end AUM of $781 billion (↑10% y/y); 2026 targets include 9-12% EPS growth, 75-85% free capital flow conversion, 15-17% ROE, and $1.5-1.8 billion of capital returns.
- FY25 non-GAAP EPS of $8.55 (+12% yoy) and Q4 EPS of $2.24 (+7% yoy), with non-GAAP operating earnings of $1.9 B for the year and $499 M for Q4.
- Returned $1.5 B to shareholders in 2025, including $851 M in share repurchases and $684 M in dividends; declared a $0.80 Q1 2026 dividend (+7% yoy).
- Strong capital base with $1.6 B of excess available capital, a 406% risk-based capital ratio, and 2026 targets of 9–12% EPS growth, 15–17% ROE, 75–85% free capital flow conversion, and $1.5–1.8 B in capital deployments.
- Total AUM of $781 B (+10% yoy) and Q4 net cash flow of –$2 B (including +$1 B in private markets).
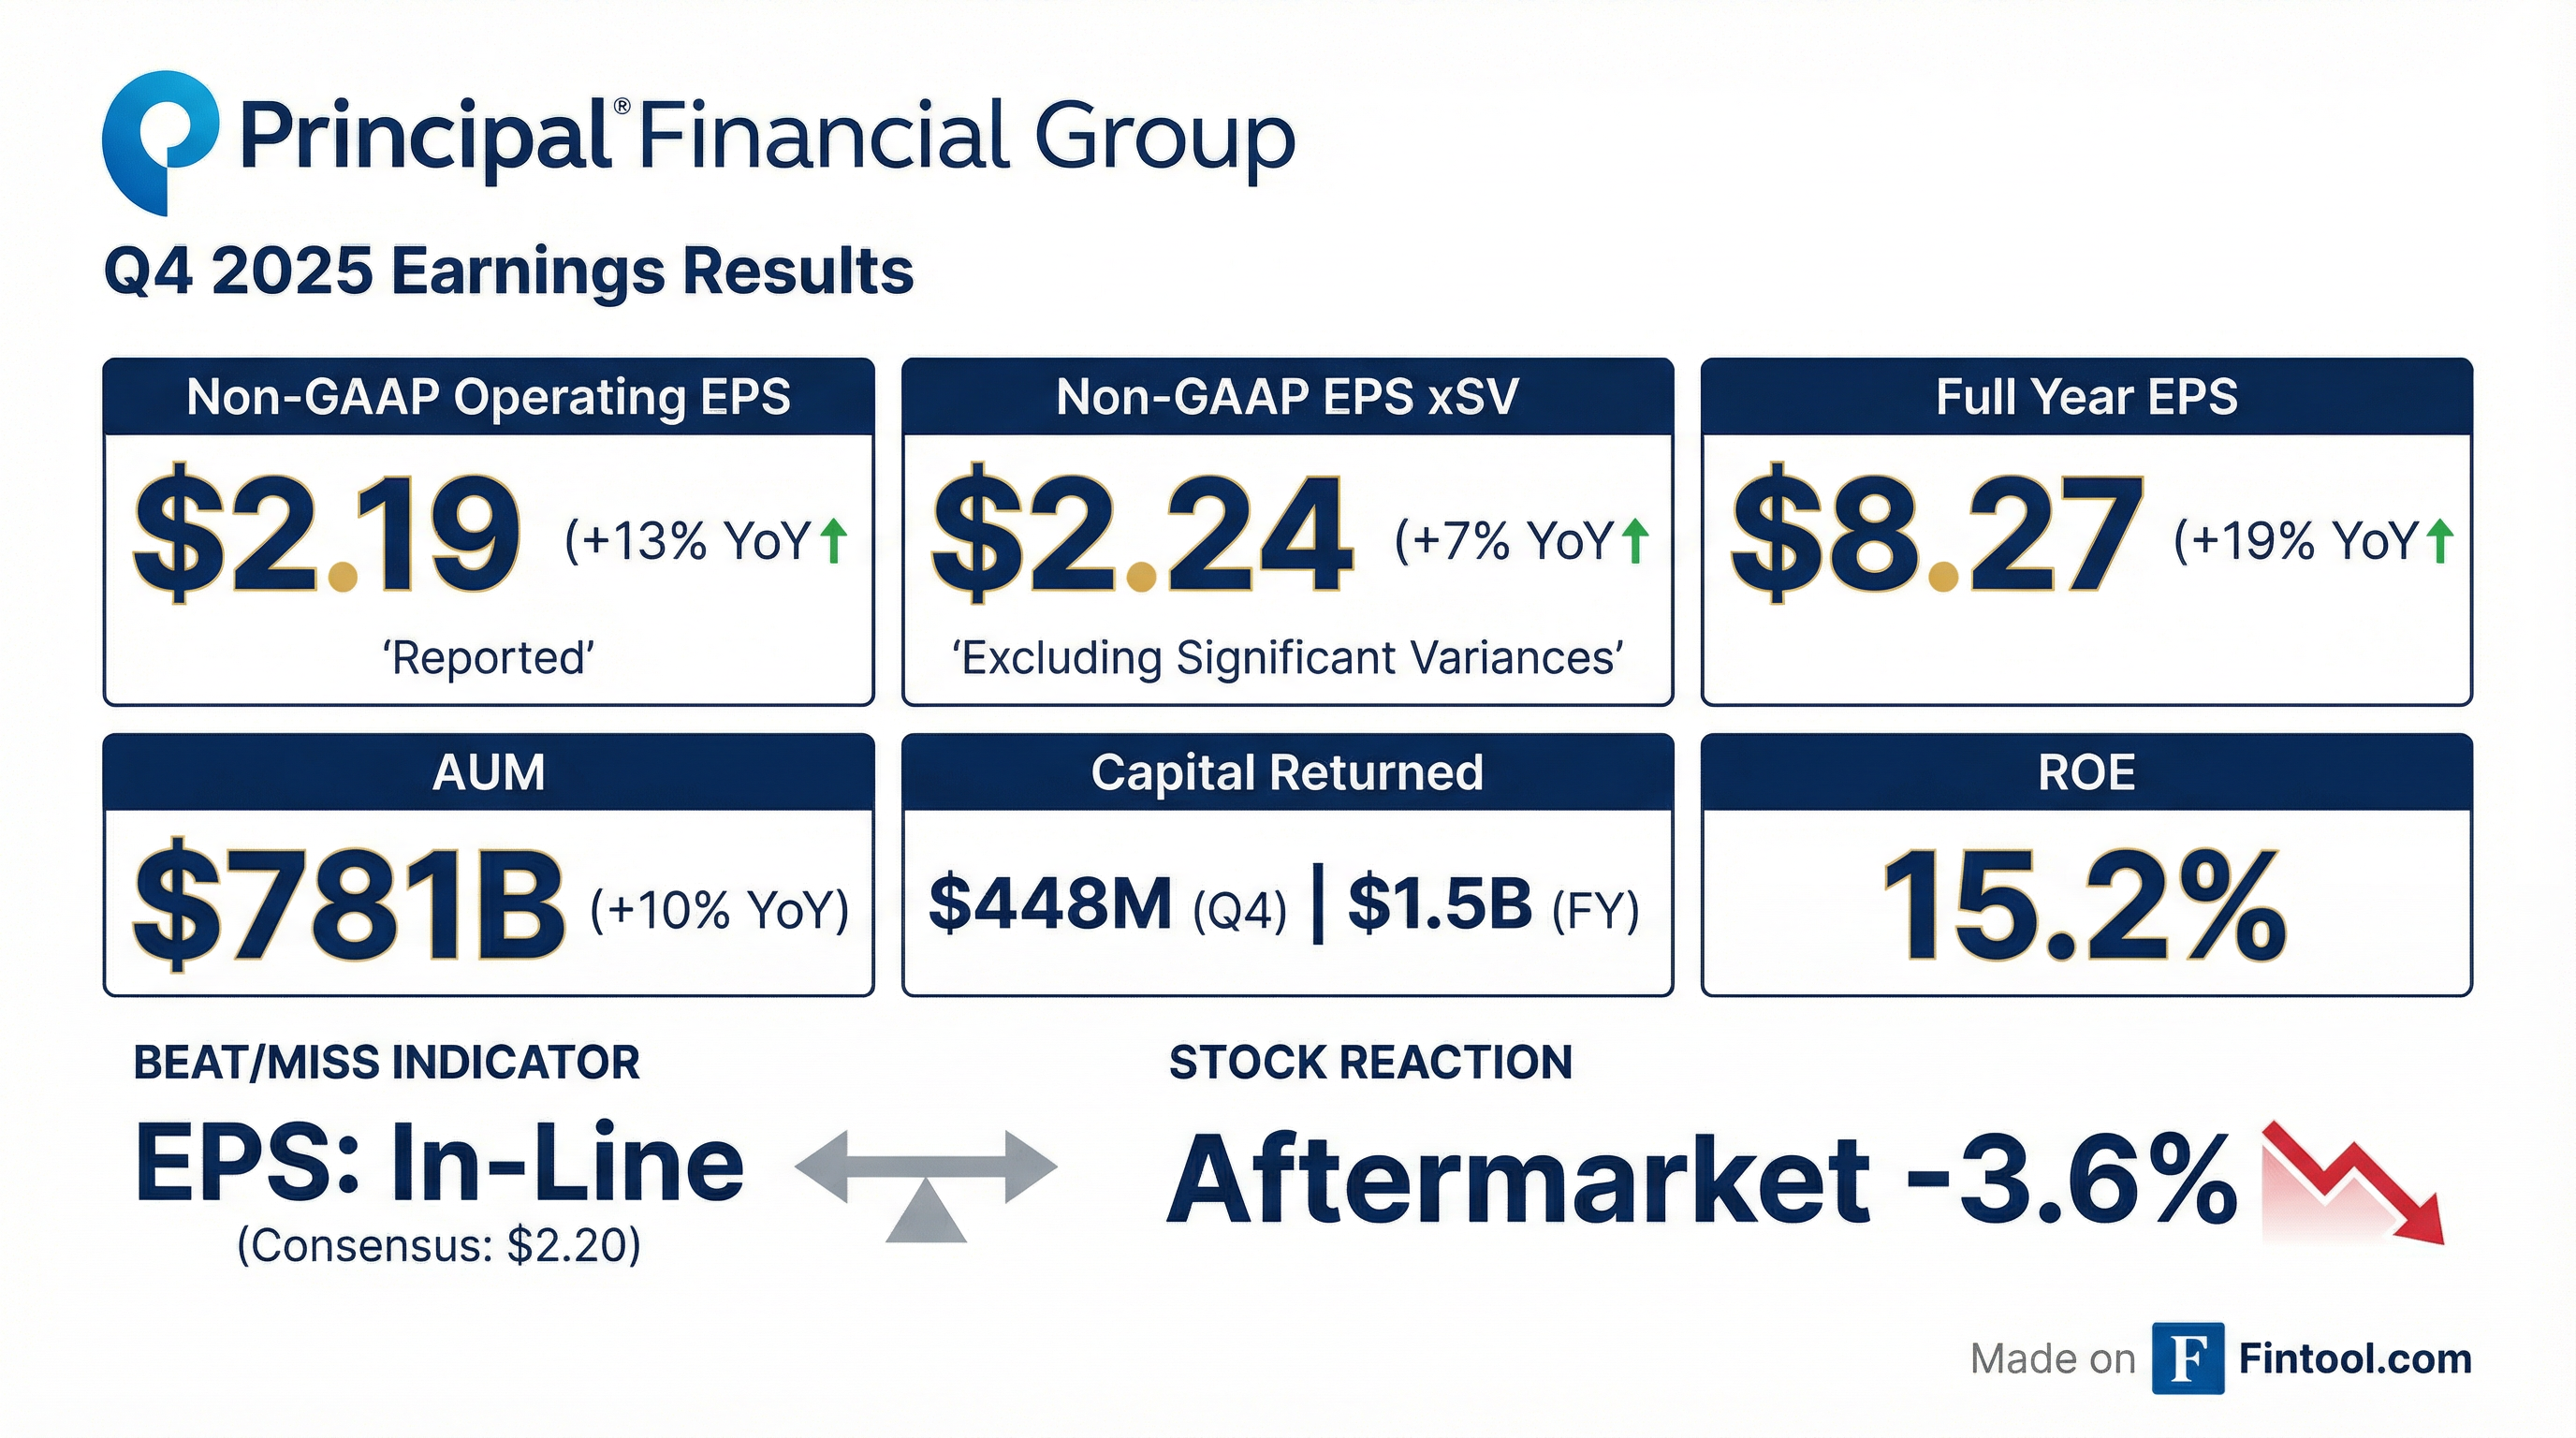
- Non-GAAP operating earnings of $488 million (up 9%) and EPS of $2.19 (up 13% vs. Q4 2024)
- Retirement & Income Solutions pre-tax operating earnings xSV rose 3% to $299 million (40% margin); Specialty Benefits pre-tax operating earnings xSV increased 7% to $177 million (17% margin)
- Returned $448 million of capital in Q4 2025, including $275 million of share repurchases and $172 million of dividends; 1Q26 dividend set at $0.80 (7% increase y/y)
- 2026 outlook: 9–12% EPS growth, 75–85% free capital flow conversion, 15–17% ROE; targeting $1.5–1.8 billion capital deployments, including $0.8–1.1 billion in share buybacks
- Full year 2025 non-GAAP EPS grew 12% to $8.55, with Q4 operating EPS of $2.24 (+7% YoY); year-end AUM was $781 billion (+10% YoY) and ROE was 15.7%; returned $1.5 billion to shareholders via buybacks and dividends.
- Retirement ecosystem saw transfer deposits of $35 billion (+9% YoY) and WSRS recurring deposits up 5%; participant roll-ins increased 15% to $6.5 billion.
- SMB segment WSRS recurring deposits grew 8%, transfer deposits jumped 32%, driving account value net cash flow of $1.5 billion; group benefits customers held 3.13 products on average (+3%).
- Global Asset Management achieved $127 billion in gross sales (+16% YoY), private markets net cash flow of $3.5 billion, ETF net inflows of $2 billion, and AUM growth of 12% in private markets and 24% internationally.
- 2026 outlook targets 9%–12% EPS growth, 75%–85% free capital flow conversion and 15%–17% ROE; plans $1.5–1.8 billion in capital deployment, including $800 million–$1.1 billion in buybacks and higher dividends.
- Net income attributable to PFG in Q4 2025 was $517 million (GAAP EPS $2.32) and non-GAAP operating earnings excluding significant variances were $2.24 per share, up 7% year-over-year.
- Full-year 2025 non-GAAP operating earnings per diluted share excluding significant variances were $8.55, a 12% increase at the high end of the 9–12% target; reported non-GAAP operating EPS rose 19%.
- Returned $448 million of capital in Q4 2025 (including $275 million of share repurchases and $172 million of dividends) and $1.5 billion for the full year (including $0.9 billion of buybacks and $0.7 billion of dividends).
- Announced a Q1 2026 common stock dividend of $0.80 per share, up 7% year-over-year, payable March 27, 2026.
- 2026 guidance: 9–12% annual non-GAAP operating EPS growth, 75–85% free capital flow conversion, 15–17% non-GAAP ROE, and $1.5–1.8 billion of capital deployment including $0.8–1.1 billion in share repurchases.
- Full-year 2025 non-GAAP operating earnings per diluted share, excluding significant variances, were $8.55, up 12% year-over-year; 4Q25 non-GAAP operating EPS excluding variances was $2.24, up 7% year-over-year.
- Returned over $1.5 billion of capital to shareholders in 2025 (including $0.9 billion of share repurchases and $0.7 billion of dividends); in 4Q25 returned $448 million (repurchases $275 million; dividends $172 million).
- Announced a first-quarter 2026 cash dividend of $0.80 per share, a one-cent increase (7% over 1Q25).
- 2026 guidance: 9–12% annual non-GAAP operating EPS growth; 75–85% free capital flow conversion; 15–17% non-GAAP ROE; $1.5–1.8 billion capital deployment (including $0.8–1.1 billion share repurchases and 40% dividend ratio).
- Assets under management totaled $781 billion (included in AUA of $1.8 trillion) and Principal Life Insurance Company’s RBC ratio was 406% at year end.
- Principal Financial Group reported Q4 adjusted operating earnings of $488.0 million ($2.19 per share), adjusted net income of $489.9 million ($2.20 per share) and GAAP net income of $517.0 million ($2.32 per share)
- Revenue was $4.46 billion, beating expectations, though adjusted EPS missed the Zacks consensus by 1.72% ($2.19 vs. $2.23)
- Assets under management grew about 10% to $781 billion, aided by higher fixed-income yields and earlier Fed rate cuts
- Premiums and fees from specialty benefits rose 3% to $845.8 million, while retirement and income solutions revenue increased 3% to $754.1 million
- The company forecasts 9–12% growth in annual adjusted operating earnings per share for fiscal 2026
Quarterly earnings call transcripts for PRINCIPAL FINANCIAL GROUP.
Ask Fintool AI Agent
Get instant answers from SEC filings, earnings calls & more