PRINCIPAL FINANCIAL GROUP (PFG)·Q4 2025 Earnings Summary
Principal Financial Posts $2.19 EPS as Retirement Business Hits Record; Stock Slides 3.6% After Hours
February 9, 2026 · by Fintool AI Agent
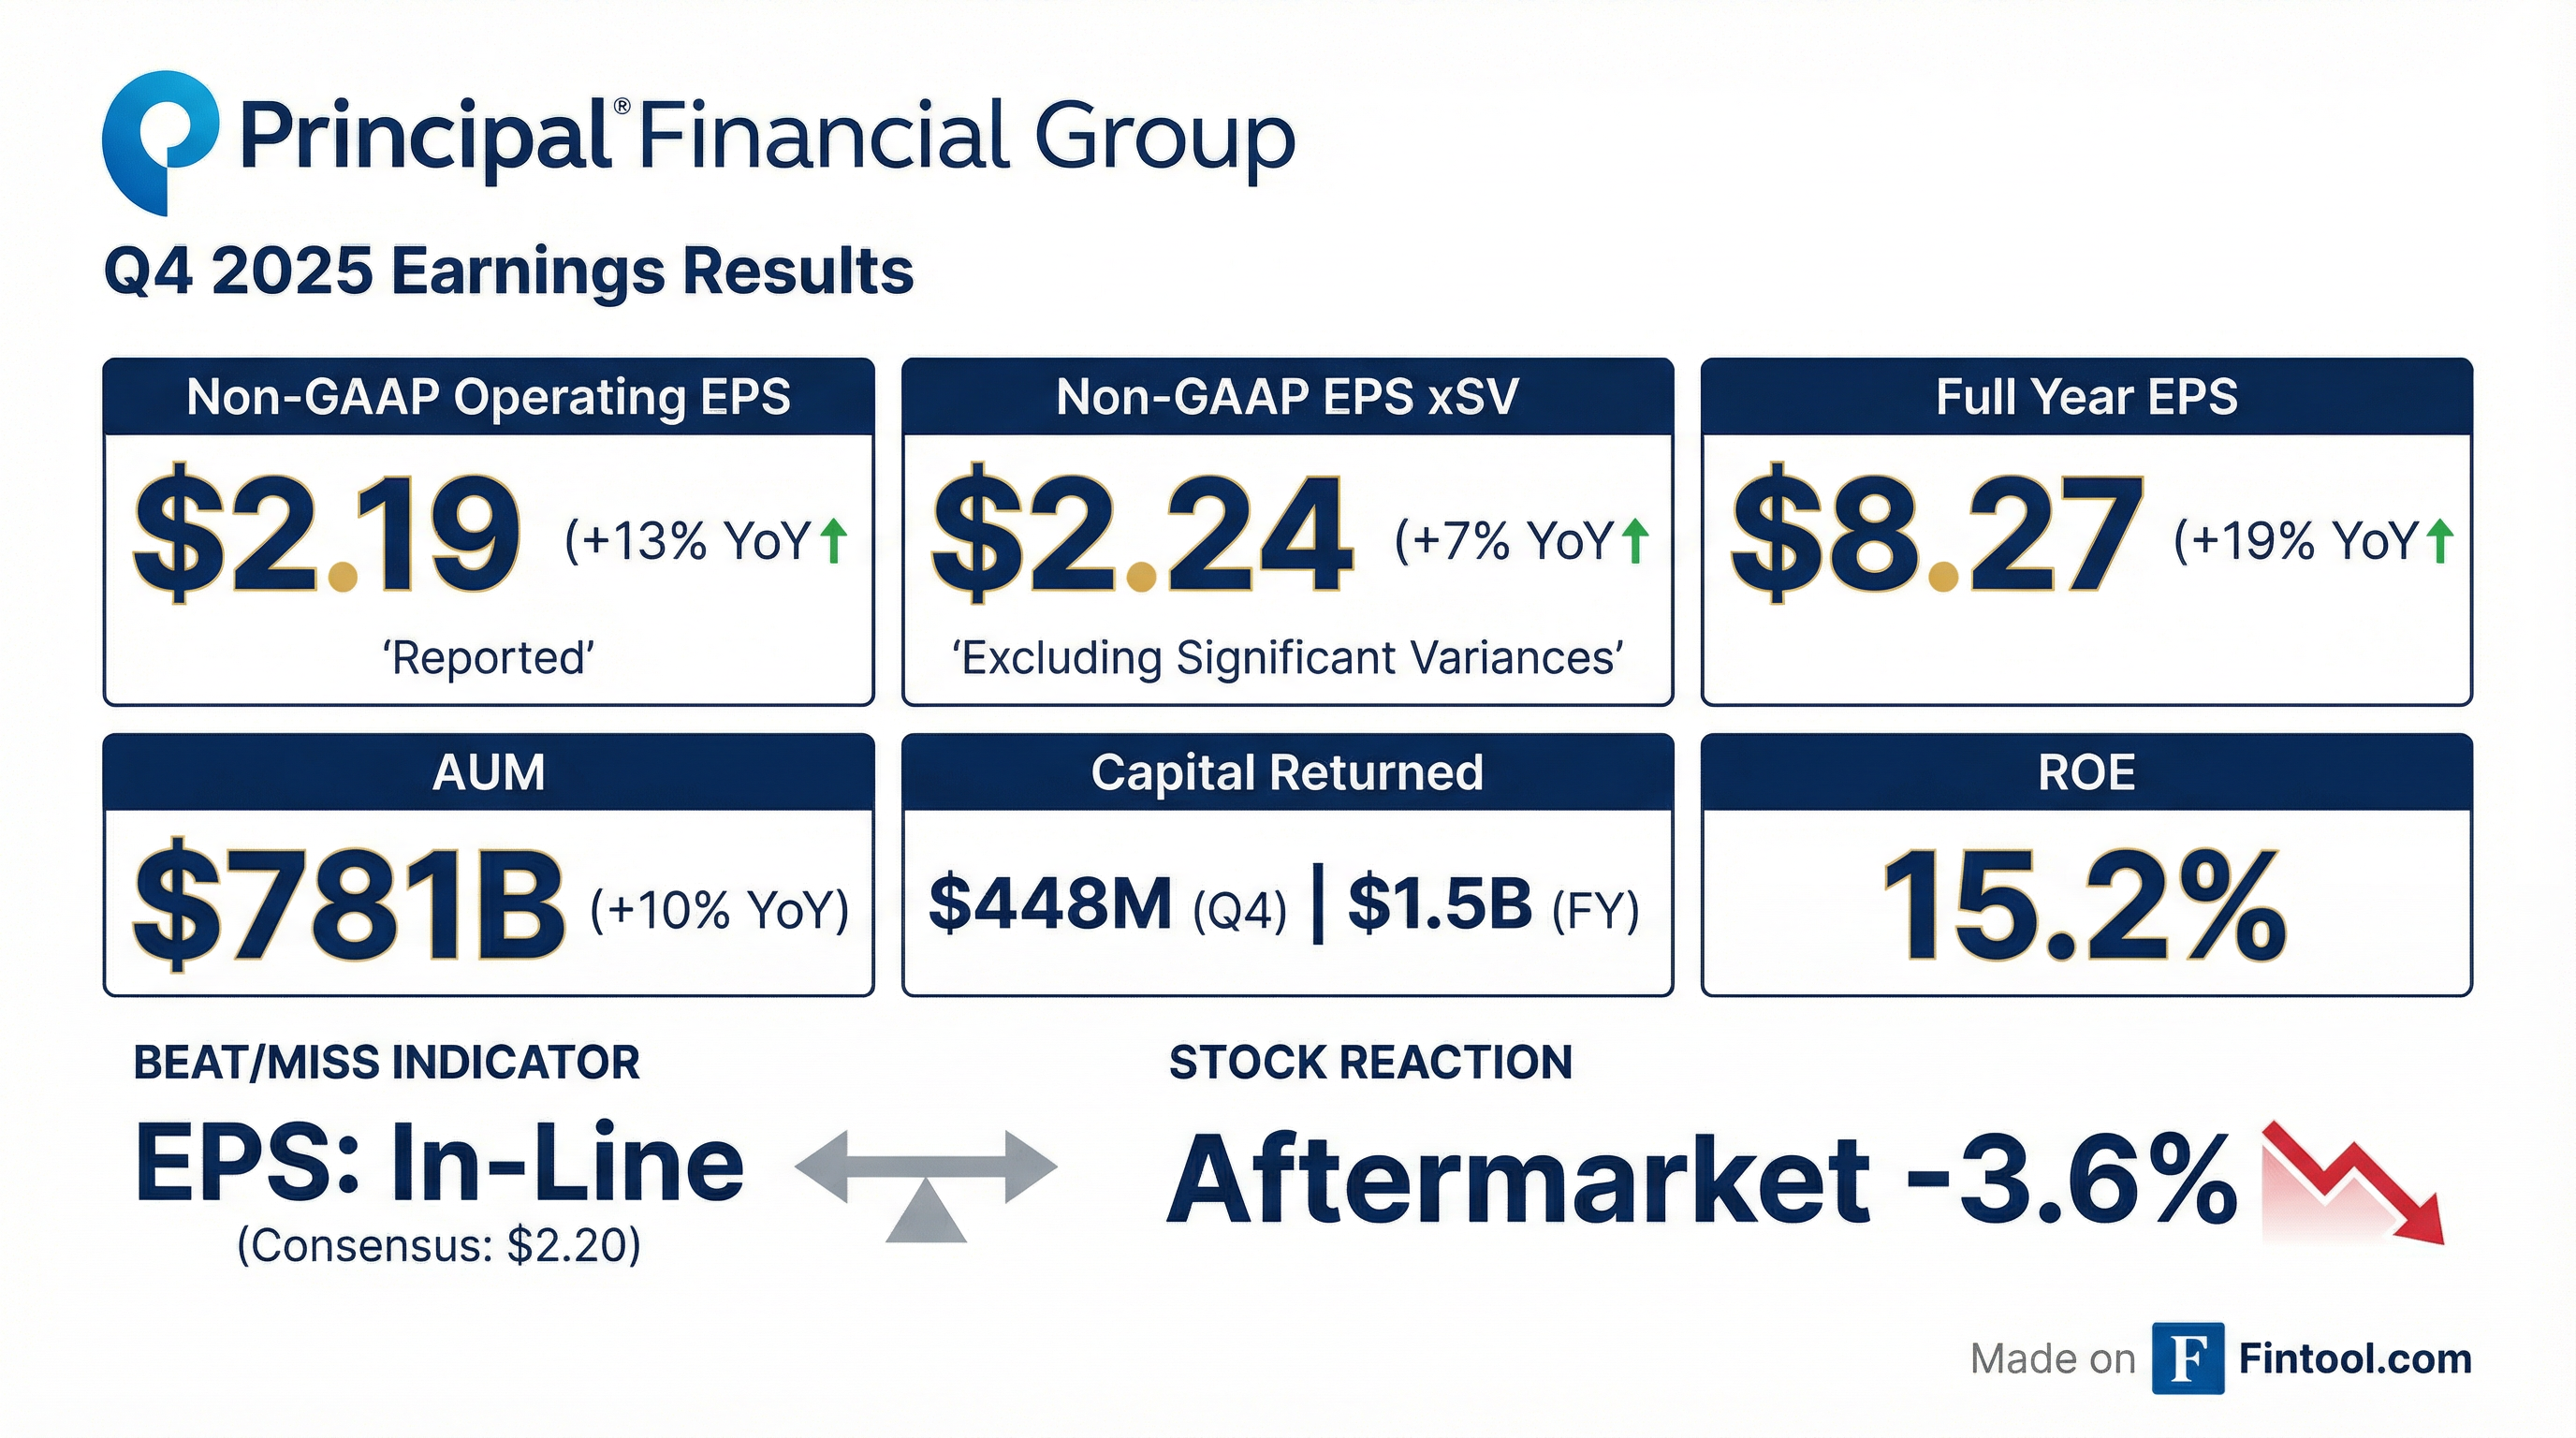
Principal Financial Group (PFG) delivered Q4 2025 non-GAAP operating earnings of $2.19 per share, essentially matching the $2.20 consensus estimate but disappointing investors who sent shares down 3.6% in after-hours trading to $92.50. The quarter featured record retirement transfer deposits of $12 billion and 90 basis points of margin expansion in the core Investment Management segment, but negative net cash flows of $2.2 billion weighed on sentiment.
Full-year 2025 results came in at the high end of targets, with non-GAAP EPS excluding significant variances of $8.55 representing 12% growth (vs. 9-12% guidance), ROE of 15.7% (vs. 14-16% target), and free cash flow conversion of 92% (vs. 75-85% target).
Did Principal Financial Beat Earnings?
Principal's Q4 2025 non-GAAP operating EPS of $2.19 grew 13% year-over-year, while the more comparable metric excluding significant variances came in at $2.24, up 7% YoY. The $0.05 of negative significant variances was primarily driven by lower-than-expected variable investment income across RIS, Specialty Benefits, and Life Insurance segments.
Full-Year Performance:
What Did Management Guide?
Principal reaffirmed confidence in delivering consistent growth, guiding to 9-12% EPS growth for 2026—the same range achieved in 2025—with ROE of 15-17% and capital deployments of $1.5-1.8 billion.
2026 Outlook vs. 2025 Results:
CEO Deanna Strable stated: "Principal delivered strong 2025 results. We achieved our objectives across earnings growth, return on equity, and free capital flow, supported by consistent execution, sustained momentum, and the strength of our diversified businesses."
The company increased its Q1 2026 dividend by $0.01 to $0.80 per share, representing a 7% increase over Q1 2025.
Key 2026 Modeling Assumptions:
- Investment Management: Expect $30-35M of seasonally higher expenses in Q1 2026
- Benefits and Protection: Higher loss ratio expected in first half of year
- Variable investment income: Improved relative to 2025
- Impact of announced divestitures: ~2% impact to Investment Management adjusted revenue growth
How Did the Stock React?
Principal shares closed the regular session at $95.93, down 0.9% on the day before earnings were released. After the announcement, shares dropped an additional 3.6% to $92.50 in after-hours trading, representing a total decline of approximately 5% from the pre-announcement price.
The negative reaction came despite:
- EPS essentially meeting consensus
- 12% full-year EPS growth at the high end of guidance
- Record retirement transfer deposits
- Strong margin expansion across segments
What likely weighed on shares:
- Net cash flow pressures: Total company NCF was $(8.8)B for the year and $(2.2)B in Q4
- No acceleration in 2026 guidance: 9-12% EPS growth target unchanged from 2025
- Revenue miss: Top-line came in below expectations despite strong operational metrics
The stock has performed well over the trailing twelve months, trading near 52-week highs of $97.88 after gaining roughly 40% from its 52-week low of $68.39.
What Changed From Last Quarter?
Positive Developments:
- Retirement transfer deposits accelerated to +35% YoY in Q4 (vs. +9% full year)
- Investment Management margin expanded 60 bps to 36% for full year
- Specialty Benefits margin expanded 120 bps to 16% with loss ratio improving to 59%
- Life Insurance returned to profitability with Q4 pre-tax earnings of $28M vs. $8M in Q4 2024
Areas of Concern:
- Negative net cash flows persist: $(8.8)B for FY 2025 vs. $(5.0)B in FY 2024
- Lower variable investment income created headwinds across multiple segments
- International Pension net revenue growth impacted by announced divestitures
Segment Performance
Retirement and Income Solutions
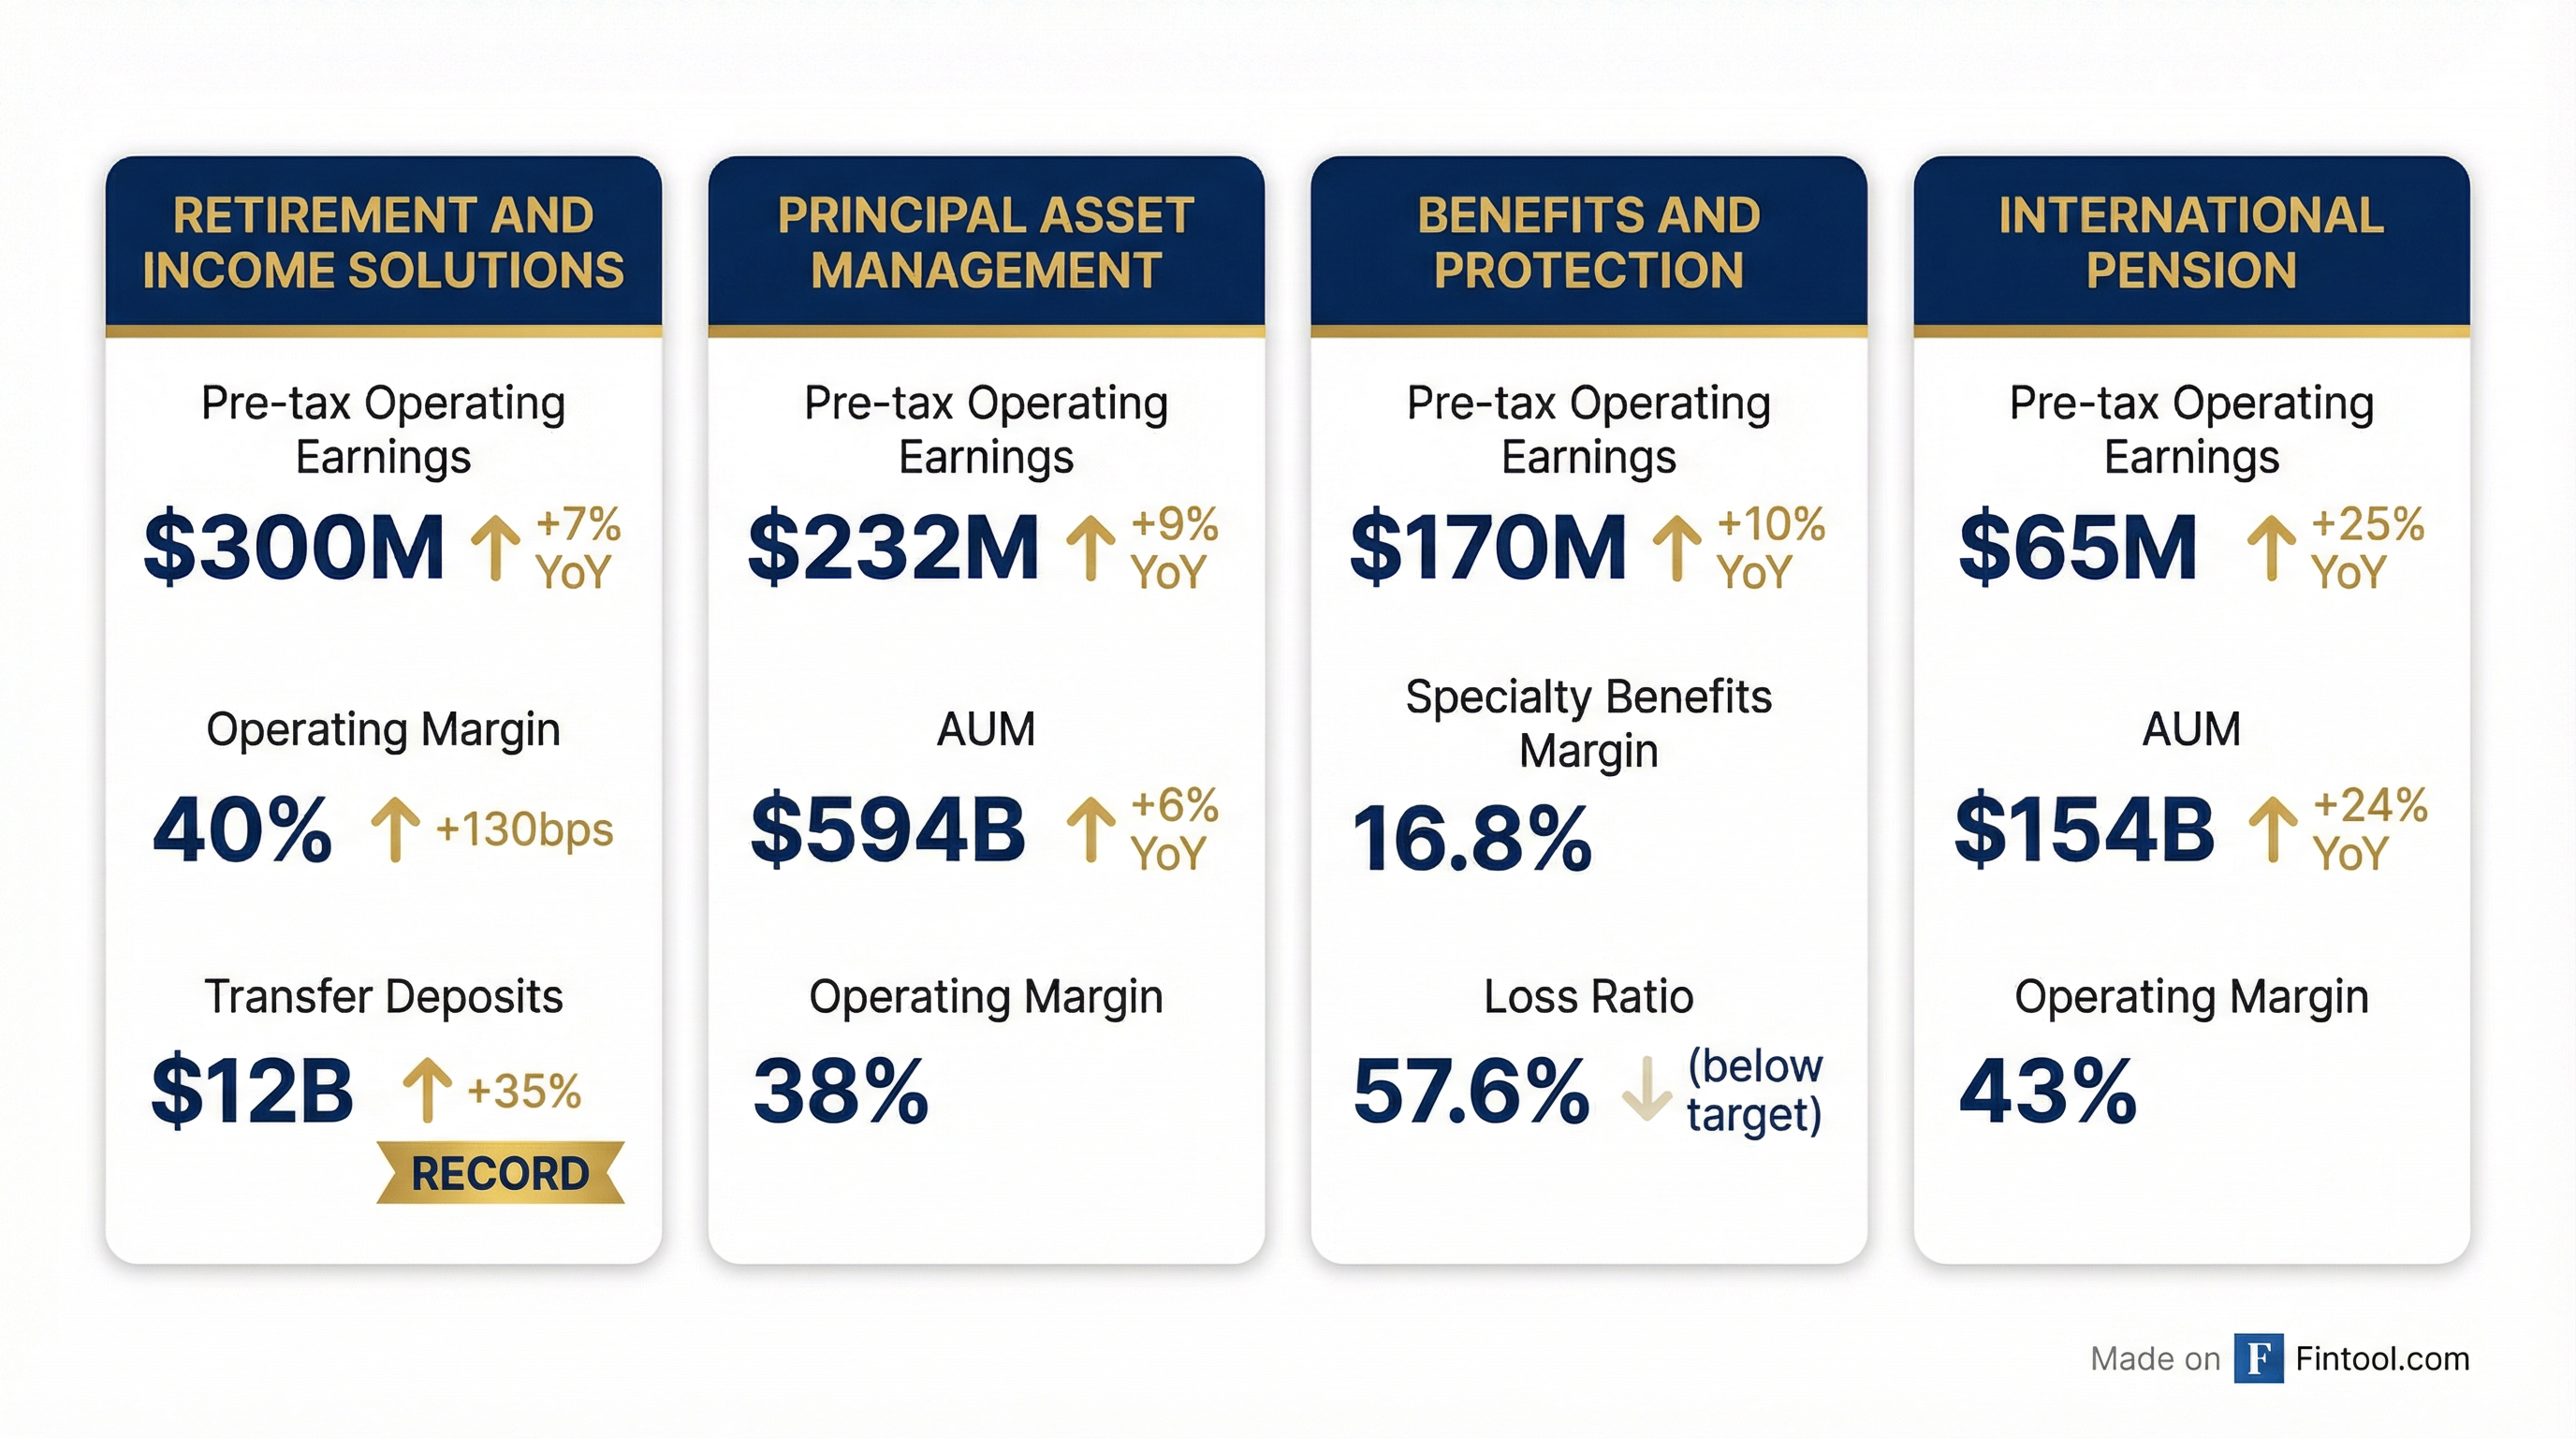
The retirement business delivered a standout quarter with record transfer deposits of $12 billion, up 35% YoY. Operating margin expanded 130 bps to 40% in Q4 on higher net revenue and disciplined expense management.
Principal Asset Management
Investment Management gross sales increased 16% for the full year with non-affiliated channels up 18%. Private markets NCF was positive at $3.5B for 2025, and ETF AUM reached a record $9B.
Benefits and Protection
Specialty Benefits delivered strong underwriting results with the incurred loss ratio of 57.6% coming in below the 60-64% target range. Life Insurance returned to meaningful profitability with improved mortality experience.
International Pension
International Pension AUM grew 24% to $154B with operating margin expanding to 43% in Q4, driven by higher net revenue and favorable encaje returns.
Capital Allocation
Principal returned $1.5 billion to shareholders in 2025, including $851 million in share repurchases and $684 million in dividends.
Capital Position:
- Excess and available capital: $1.6B
- $800M at holding company
- $300M excess subsidiary capital
- $480M in excess of 375% RBC
- PLIC RBC ratio: 406%
- Debt to capital ratio: 22.0%
2026 Capital Deployment Plan:
- Target $1.5-1.8B total deployment
- Share repurchases: $0.8-1.1B
- Dividend payout ratio: 40%
Risks and Concerns
Net Cash Flow Headwinds: The company reported $(8.8)B of net cash outflows for FY 2025, nearly double the $(5.0)B in FY 2024. This reflects broader industry pressures and could limit organic growth if sustained.
Variable Investment Income Volatility: Lower-than-expected variable investment income created significant variances across RIS, Specialty Benefits, and Life Insurance segments.
Divestiture Impact: Announced divestitures will impact Investment Management adjusted revenue growth by ~2% and International Pension net revenue by mid-to-high single digits.
Market Sensitivity: Principal estimates that a 10% change in equity markets would impact annual pre-tax operating earnings by 5-8%.
Forward Catalysts
- Q1 2026 Earnings: Expected late April 2026 - watch for transfer deposit momentum and early read on 2026 guidance achievability
- Dividend growth: Next dividend increase decision expected Q1 2027
- AUM recovery: Positive private markets NCF could help offset broader outflows
- Margin expansion: Continued expense discipline supporting operating leverage
Sources: Principal Financial Group Q4 2025 Earnings Presentation , 8-K Filing