PROSPECT CAPITAL (PSEC)·Q2 2026 Earnings Summary
Prospect Capital Q2 2026: NII Rebounds but NAV Erosion Continues
February 10, 2026 · by Fintool AI Agent
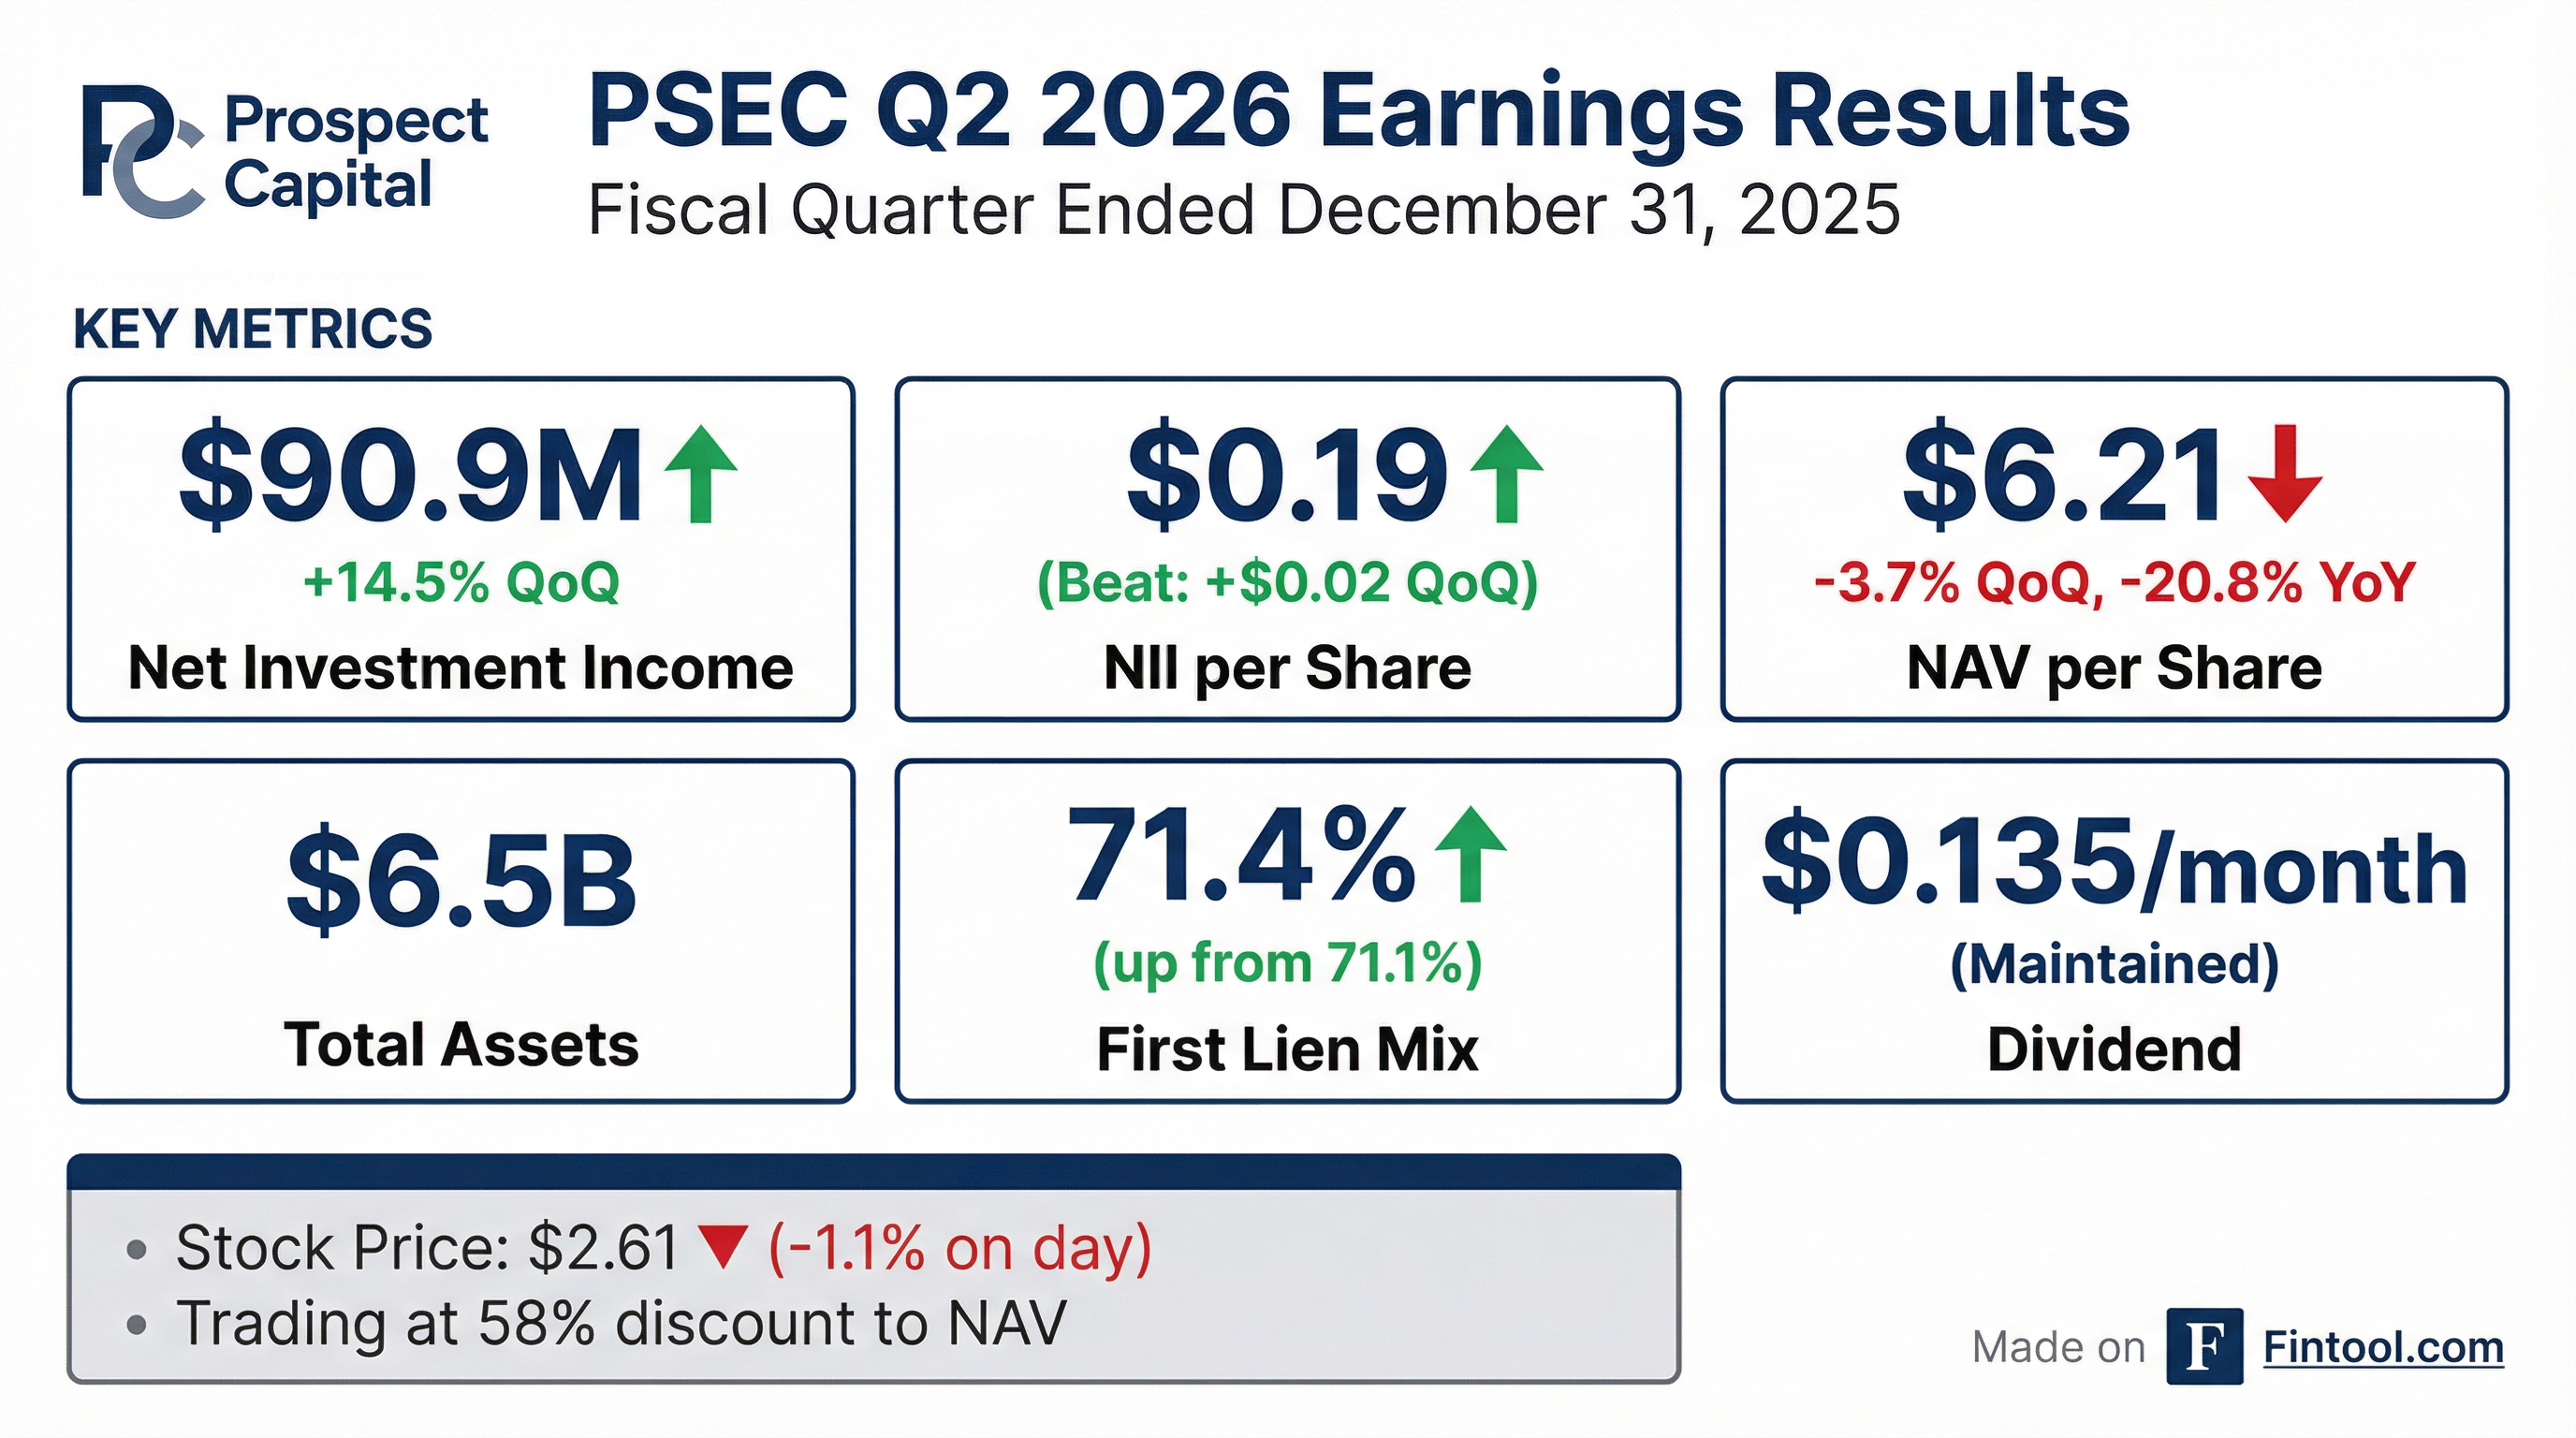
Prospect Capital Corporation (NASDAQ: PSEC) reported fiscal Q2 2026 results on February 9, 2026, delivering a sequential rebound in Net Investment Income while continuing to grapple with NAV erosion from realized losses on legacy investments. The BDC reported NII per share of $0.19, up from $0.17 in the prior quarter, as higher dividend income and disciplined expense management offset lower interest income.
Did Prospect Capital Beat Earnings?
Yes — NII per share exceeded expectations by a wide margin.
*Values retrieved from S&P Global
The beat was driven by a 244% surge in dividend income to $24.0M from $7.0M in Q2 2025, partially offsetting a 12% decline in interest income. Operating expenses also fell 14% YoY to $85.1M, contributing to improved NII.
However, the bottom line told a different story: PSEC reported a net loss applicable to common shareholders of $6.6M (-$0.01 per share) due to $141.3M in realized losses on investments.
What Happened to NAV?
NAV erosion continued despite the NII beat.
The NAV decline was driven by:
- Net realized losses of $141.3M — Control investments contributed $66.2M of losses, with non-control/non-affiliate investments adding $75.1M
- Common stock dilution — Share count increased from 456M to 476M, diluting NAV per share by $0.08 QoQ
- Distributions exceeding net income — $63.9M distributed vs. NII of $90.9M, but after preferred dividends and losses, the payout ratio exceeded income
Unrealized gains of $71.3M partially offset the realized losses, with control investments contributing $37.1M in mark-ups.
How Did the Stock React?
PSEC shares closed at $2.61, down 1.1% on the day of the earnings release.
Key stock metrics:
The stock trades at a substantial discount to NAV, reflecting investor concerns about:
- Continued NAV erosion from legacy investments
- Below-peer returns on the real estate portfolio
- Realized loss history
What Changed From Last Quarter?
Portfolio Composition
PSEC continued its multi-quarter shift toward first-lien senior secured loans:
The shift toward first lien has been dramatic — up 728 basis points since June 2024.
Investment Activity
Middle-market investments comprised 100% of originations during the quarter, with a focus on companies with less than $50M EBITDA.
Portfolio Snapshot (December 2025):
- 91 portfolio companies across 32 industries
- $6.4B aggregate fair value
- EBITDA/interest coverage: 210% (overall), 230% (sub-$50M EBITDA)
- Software exposure: Only 2.8% vs 22% BDC average — a key differentiator
Real Estate Progress
The NPRC real estate portfolio represented 14.1% of investments at cost and paid a 5.4% income yield for the quarter. Management continues to exit properties:
- 56 properties sold since 2012 inception with 24% unlevered IRR and 2.4x cash-on-cash
- 4 properties exited in current fiscal year through December
- 1 additional property sold after quarter-end
- Remaining portfolio: 54 properties with $270M unrealized gain
What Did Management Say?
Management confirmed monthly distributions through April 2026:
Since its July 2004 IPO through April 2026 declared distributions, PSEC will have distributed $4.7 billion ($21.93 per share) to common shareholders.
Middle-Market Lending Track Record (since inception through Dec 31, 2025):
Management continues to emphasize the focus on smaller companies (sub-$50M EBITDA) where returns have been materially higher and losses lower.
Q&A Highlights
First Tower Finance — The Crown Jewel
Analyst Finney O'Shea (Wells Fargo) asked about First Tower and whether it's part of the optimization/exit strategy. Management was emphatic:
"We want to stick with our great winners, and First Tower is absolutely one of them. We have a fabulous CEO there. Frankly, it'd be very hard to find a better CEO." — John Barry, CEO
Why PSEC won't sell First Tower:
-
Tax advantages — As a RIC under Subchapter M, PSEC pays no income taxes. First Tower is held as a tax partnership, avoiding double taxation. Any buyer would likely be a C-corp or plan to IPO (requiring C-corp status), creating immediate tax drag.
-
Attractive unit economics — New branch openings have expected IRRs of "well over 30%"
-
Record performance — Multi-decade low delinquencies and charge-offs
-
Growth runway — Expanding in Florida, Tennessee, and Texas with "prudent and thoughtful" approach
-
Favorable financing — Low-cost third-party ABL financing getting cheaper as SOFR declines
Software Exposure — A Contrarian Positioning
When asked about pivoting into enterprise SaaS given market concerns about software in BDC portfolios, CEO John Barry prefaced with "intellectual modesty" about AI impacts, then COO Grier Eliasek explained their differentiated approach:
Why PSEC avoided software ARR loans:
- Annual recurring revenue (ARR) loans typically have <1.0x fixed charge coverage
- These get rated as triple-C when seeking private ratings
- No cash flow exit when below 1.0x — requires growth and liquidity for repayment
- PSEC's culture: 1.5x+ fixed charge coverage required, multiple sources of repayment
"Those annual recurring revenue or AR deals never offered those. And we thought looked quite risky from our point of view. So we passed on every single one of them. We've never done a single such deal." — Grier Eliasek, COO
Interest Rate Environment
On the convertible preferred product and floating rate investments:
"In the current environment, some folks are deprioritizing floating-rate investments... Everybody likes to float up and get a higher yield. They don't necessarily like to float down and get paid less."
Management sees rotation toward fixed-rate investments as rates decline, benefiting their fixed-rate preferred issuance.
Balance Sheet & Liquidity
PSEC maintains a conservative leverage profile with substantial liquidity:
Recent capital markets activity:
- Issued $167.6M of 5.5% senior unsecured notes due 2030 in October 2025
- Repurchased $32.5M of 3.364% 2026 Notes at 96.8% of par
- Repurchased $20.3M of 3.437% 2028 Notes at 89.5% of par
- Next institutional bond maturity: $267.5M in November 2026
Weighted average cost of unsecured debt: 4.68%
Key Risks to Monitor
-
NAV Trajectory — NAV has declined 20.8% YoY; continued erosion would pressure the stock further
-
Non-Accruals — Currently 0.7% of total assets at fair value, stable but bears watching
-
Realized Losses — $141.3M in Q2 2026 alone; Echelon Transportation and other legacy investments continue to generate losses
-
Dividend Coverage — Current NII of $0.19 covers the $0.12 quarterly distribution ($0.04/month), but net losses reduce retained NAV
-
Discount to NAV — Trading at 58% discount signals market skepticism; any positive shift in sentiment could drive re-rating
Forward Catalysts
Earnings Call Takeaways
PSEC hosted its Q2 2026 earnings call on Tuesday, February 10, 2026. Key themes:
- Commitment to winners — No plans to exit First Tower, their largest equity-linked holding
- Software differentiation — Only 2.8% software exposure vs 22% BDC average, having avoided all ARR loans
- Fixed-rate rotation — Seeing investor preference shift from floating to fixed-rate as SOFR declines
- Distribution stability — $0.04/month confirmed for February through April 2026