REGENCY CENTERS (REG)·Q4 2025 Earnings Summary
Regency Centers Beats on Revenue and FFO, Raises Dividend and Guides 4.5% FFO Growth for 2026
February 6, 2026 · by Fintool AI Agent
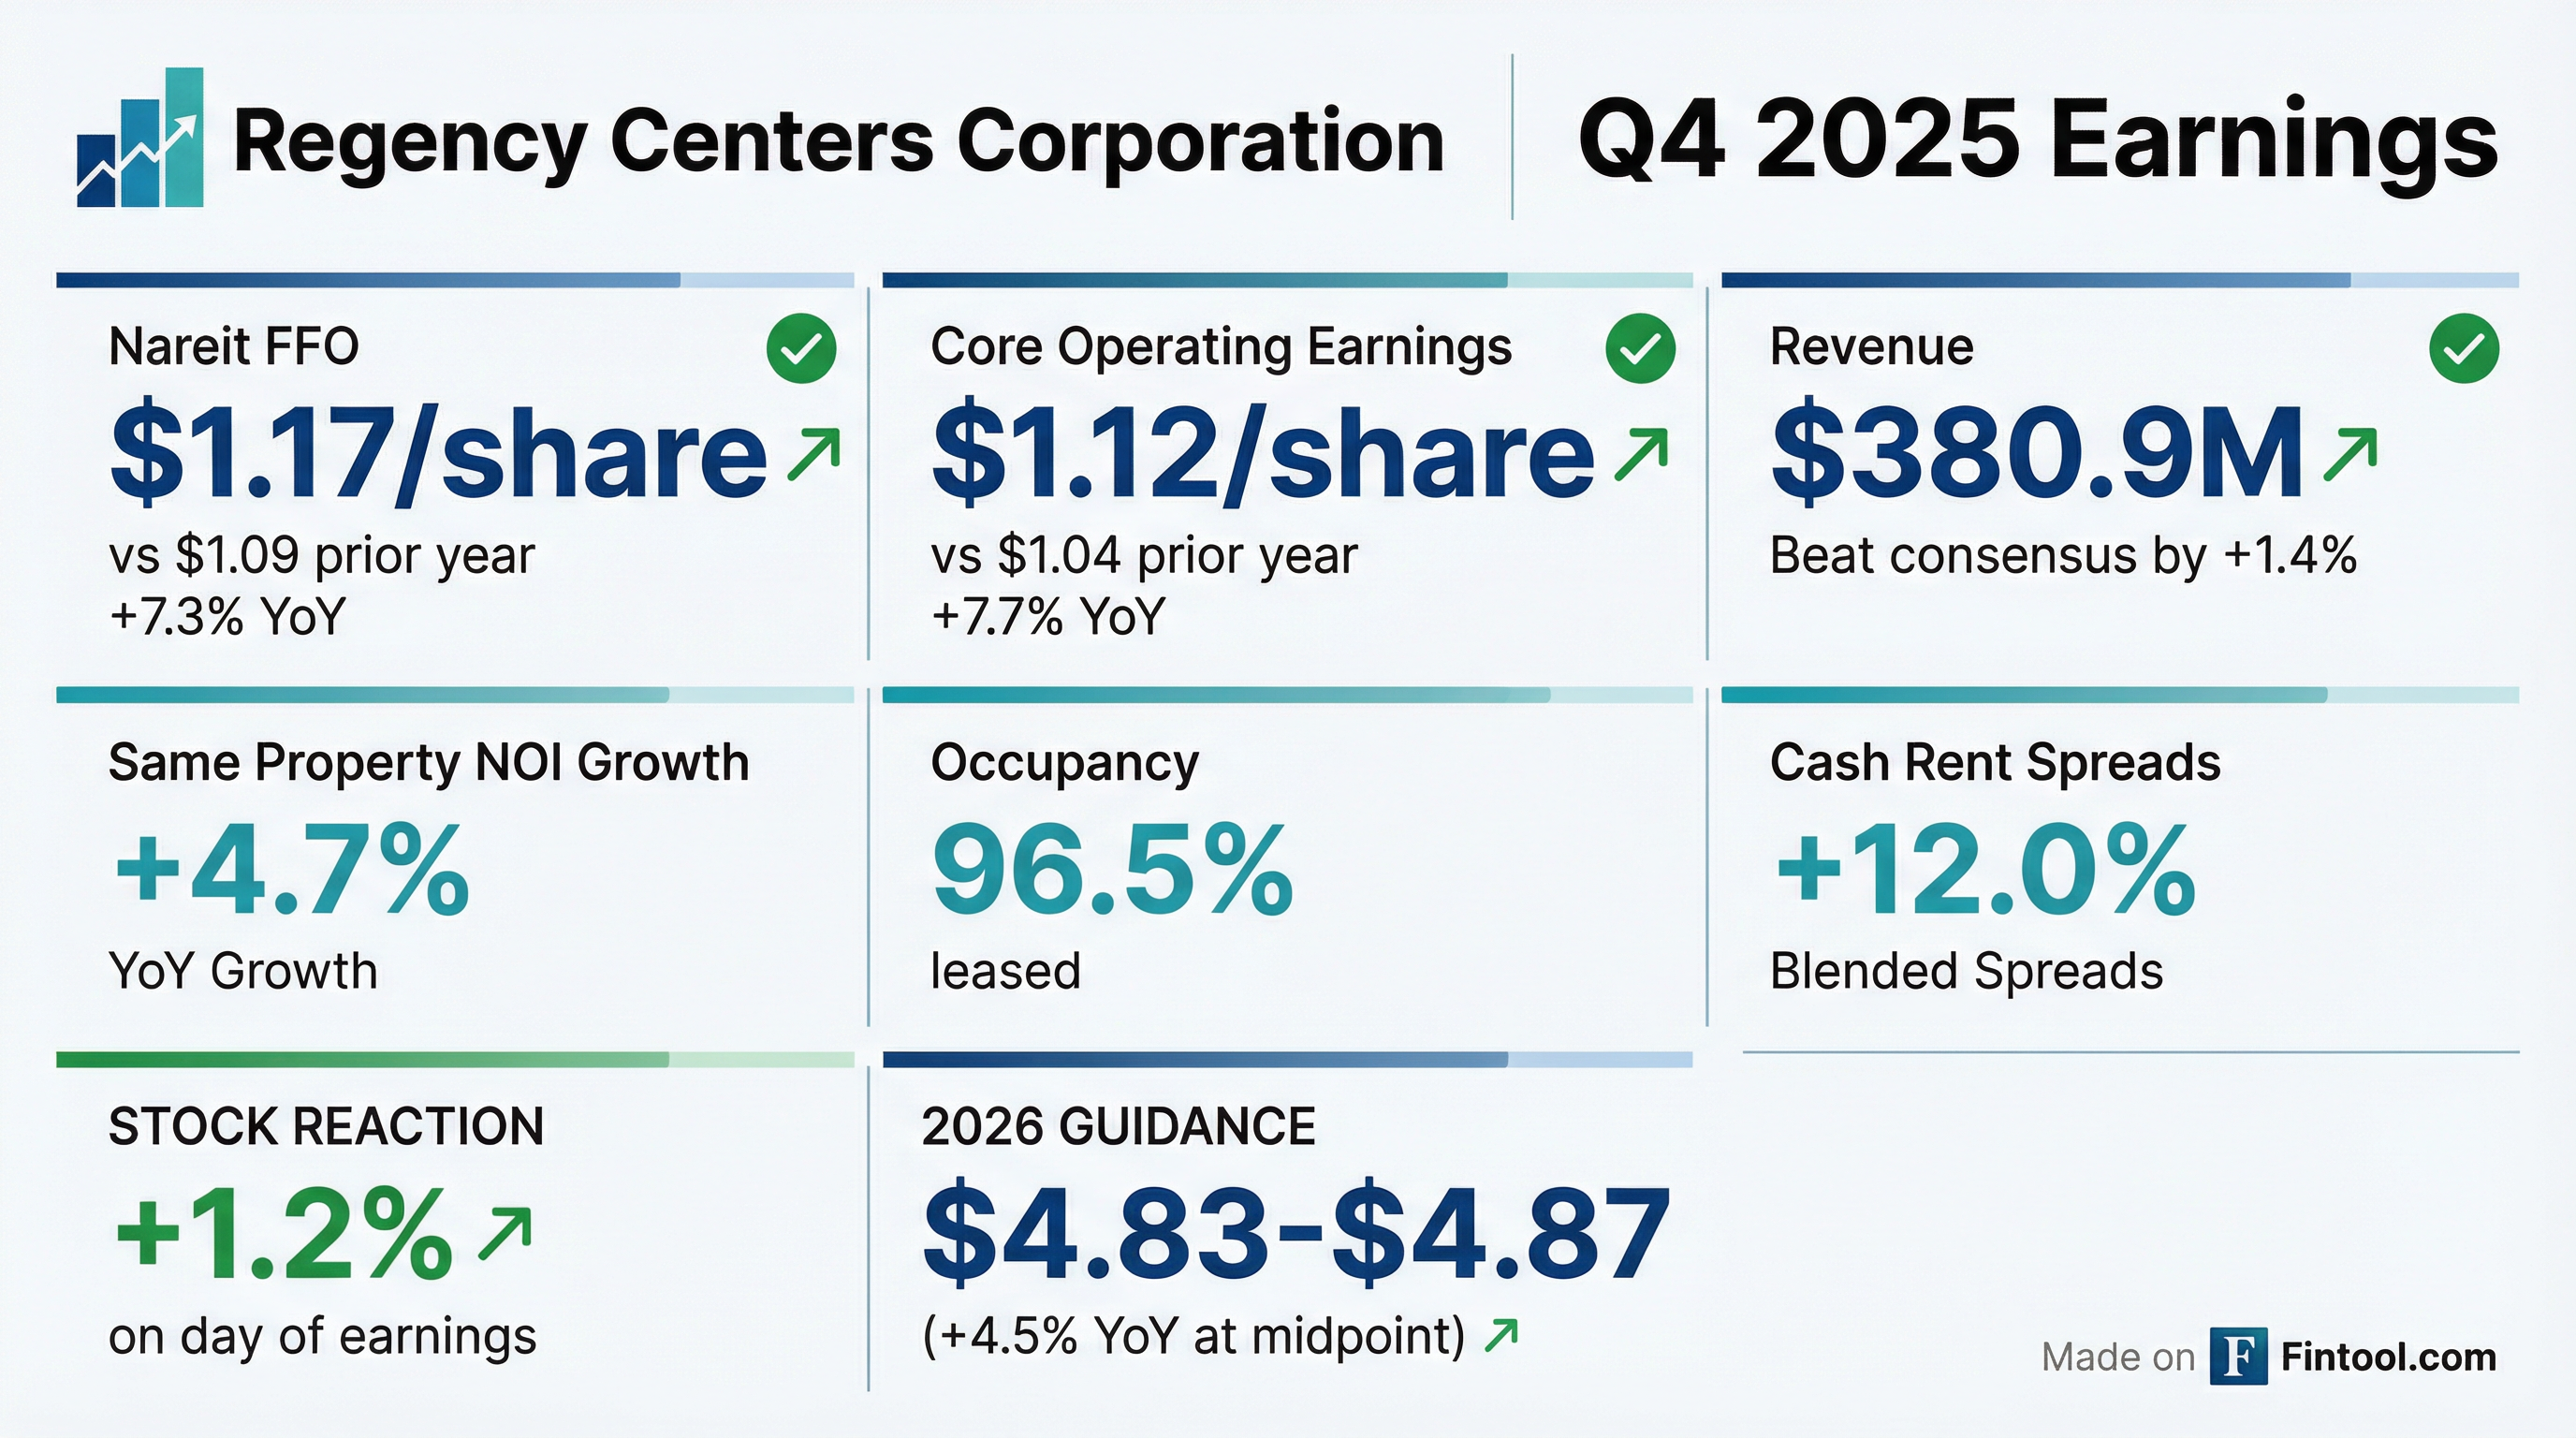
Regency Centers (REG) delivered another quarter of strong results, reporting Nareit FFO of $1.17 per share for Q4 2025, up 7.3% year-over-year and ahead of expectations. Revenue of $380.9M beat consensus by 1.4%, while normalized EPS of $0.58 topped estimates by 4.6%.* The grocery-anchored shopping center REIT capped off a strong 2025 with full-year Nareit FFO growth of 7.9% and Same Property NOI growth of 5.3%. The stock rose +1.2% on the day of results.
*Values retrieved from S&P Global
Key Takeaways From the Call
- Amazon Fresh Exit: All 4 Amazon Fresh stores in REG's portfolio have closed, but significant lease term remains with Amazon credit. Management is receiving strong inbound interest and evaluating Whole Foods conversions.
- $1B Development Pipeline: Management has visibility into $1 billion of project starts over the next 3 years, with ~75% expected to be ground-up development.
- Rent Escalators Accelerating: 96% of new and renewed deals included annual rent steps; 85% of shop deals at 3%+ steps and 30% at 4%+.
- EBITDA Milestone: First year exceeding $1 billion of EBITDA as a public company.
- Tariff Impact Minimal: Tenants have diversified supply chains; one restaurant operator switching to local wines and food for cost control.
Did Regency Centers Beat Earnings?
Yes — both revenue and FFO exceeded expectations.
*Values retrieved from S&P Global
For the full year, Regency delivered Nareit FFO of $4.64 per share, up 7.9% from $4.30 in 2024, and Core Operating Earnings of $4.41 per share, up 6.8% from $4.13.
CEO Lisa Palmer commented: "We delivered another quarter and year of outstanding performance, highlighted by exceptional Same Property NOI, earnings, and dividend growth. These results reflect the quality and locations of our shopping centers, the strength of our best-in-class operating and investments platforms, and the hard work of our talented team."
What Did Management Guide?
2026 guidance implies continued growth, though at a normalized pace.
The lower net income guidance reflects the absence of one-time gains from 2025, including a $72.2M gain from a partial distribution-in-kind transaction.
Key drivers of 2026 FFO growth at the midpoint include:
- Same Property NOI growth of +3.25% to +3.75% contributing ~$0.20/share
- External growth (development deliveries, acquisitions) adding ~$0.16/share
- Higher interest expense from debt refinancing reducing ~$0.09/share
- Share count impact from 2025 ATM settlement reducing ~$0.07/share
How Did the Stock React?
Stock rose modestly on results.
The stock has traded in a range of $63.44 to $78.18 over the past 52 weeks. At $75.48, REG is trading near the upper end of this range, reflecting the strong fundamental performance and steady dividend growth. The board declared a quarterly dividend of $0.755 per share, payable April 1, 2026.
What Changed From Last Quarter?
Leasing momentum accelerated while development completions hit a record quarter.
Portfolio Performance
Shop leasing momentum was especially impressive in Q4 — Regency leased its largest percentage of vacant shop GLA in more than five years.
The 240 basis point spread between leased and commenced occupancy represents approximately $45 million of signed-not-occupied (SNO) base rent, with 87% in the Same Property pool. This backlog provides visibility into future rent commencements.
Leasing Spreads
Q4 2025 cash rent spreads of +12.0% were the strongest of the year, with renewal spreads hitting a record 13% and gap rent spreads reaching an all-time high of 25%.
Rent Escalators — A Growing Tailwind
This embedded rent growth strengthens Regency's long-term NOI trajectory regardless of new leasing activity.
Development Activity: A Standout Quarter
Q4 2025 was a record quarter for development completions.
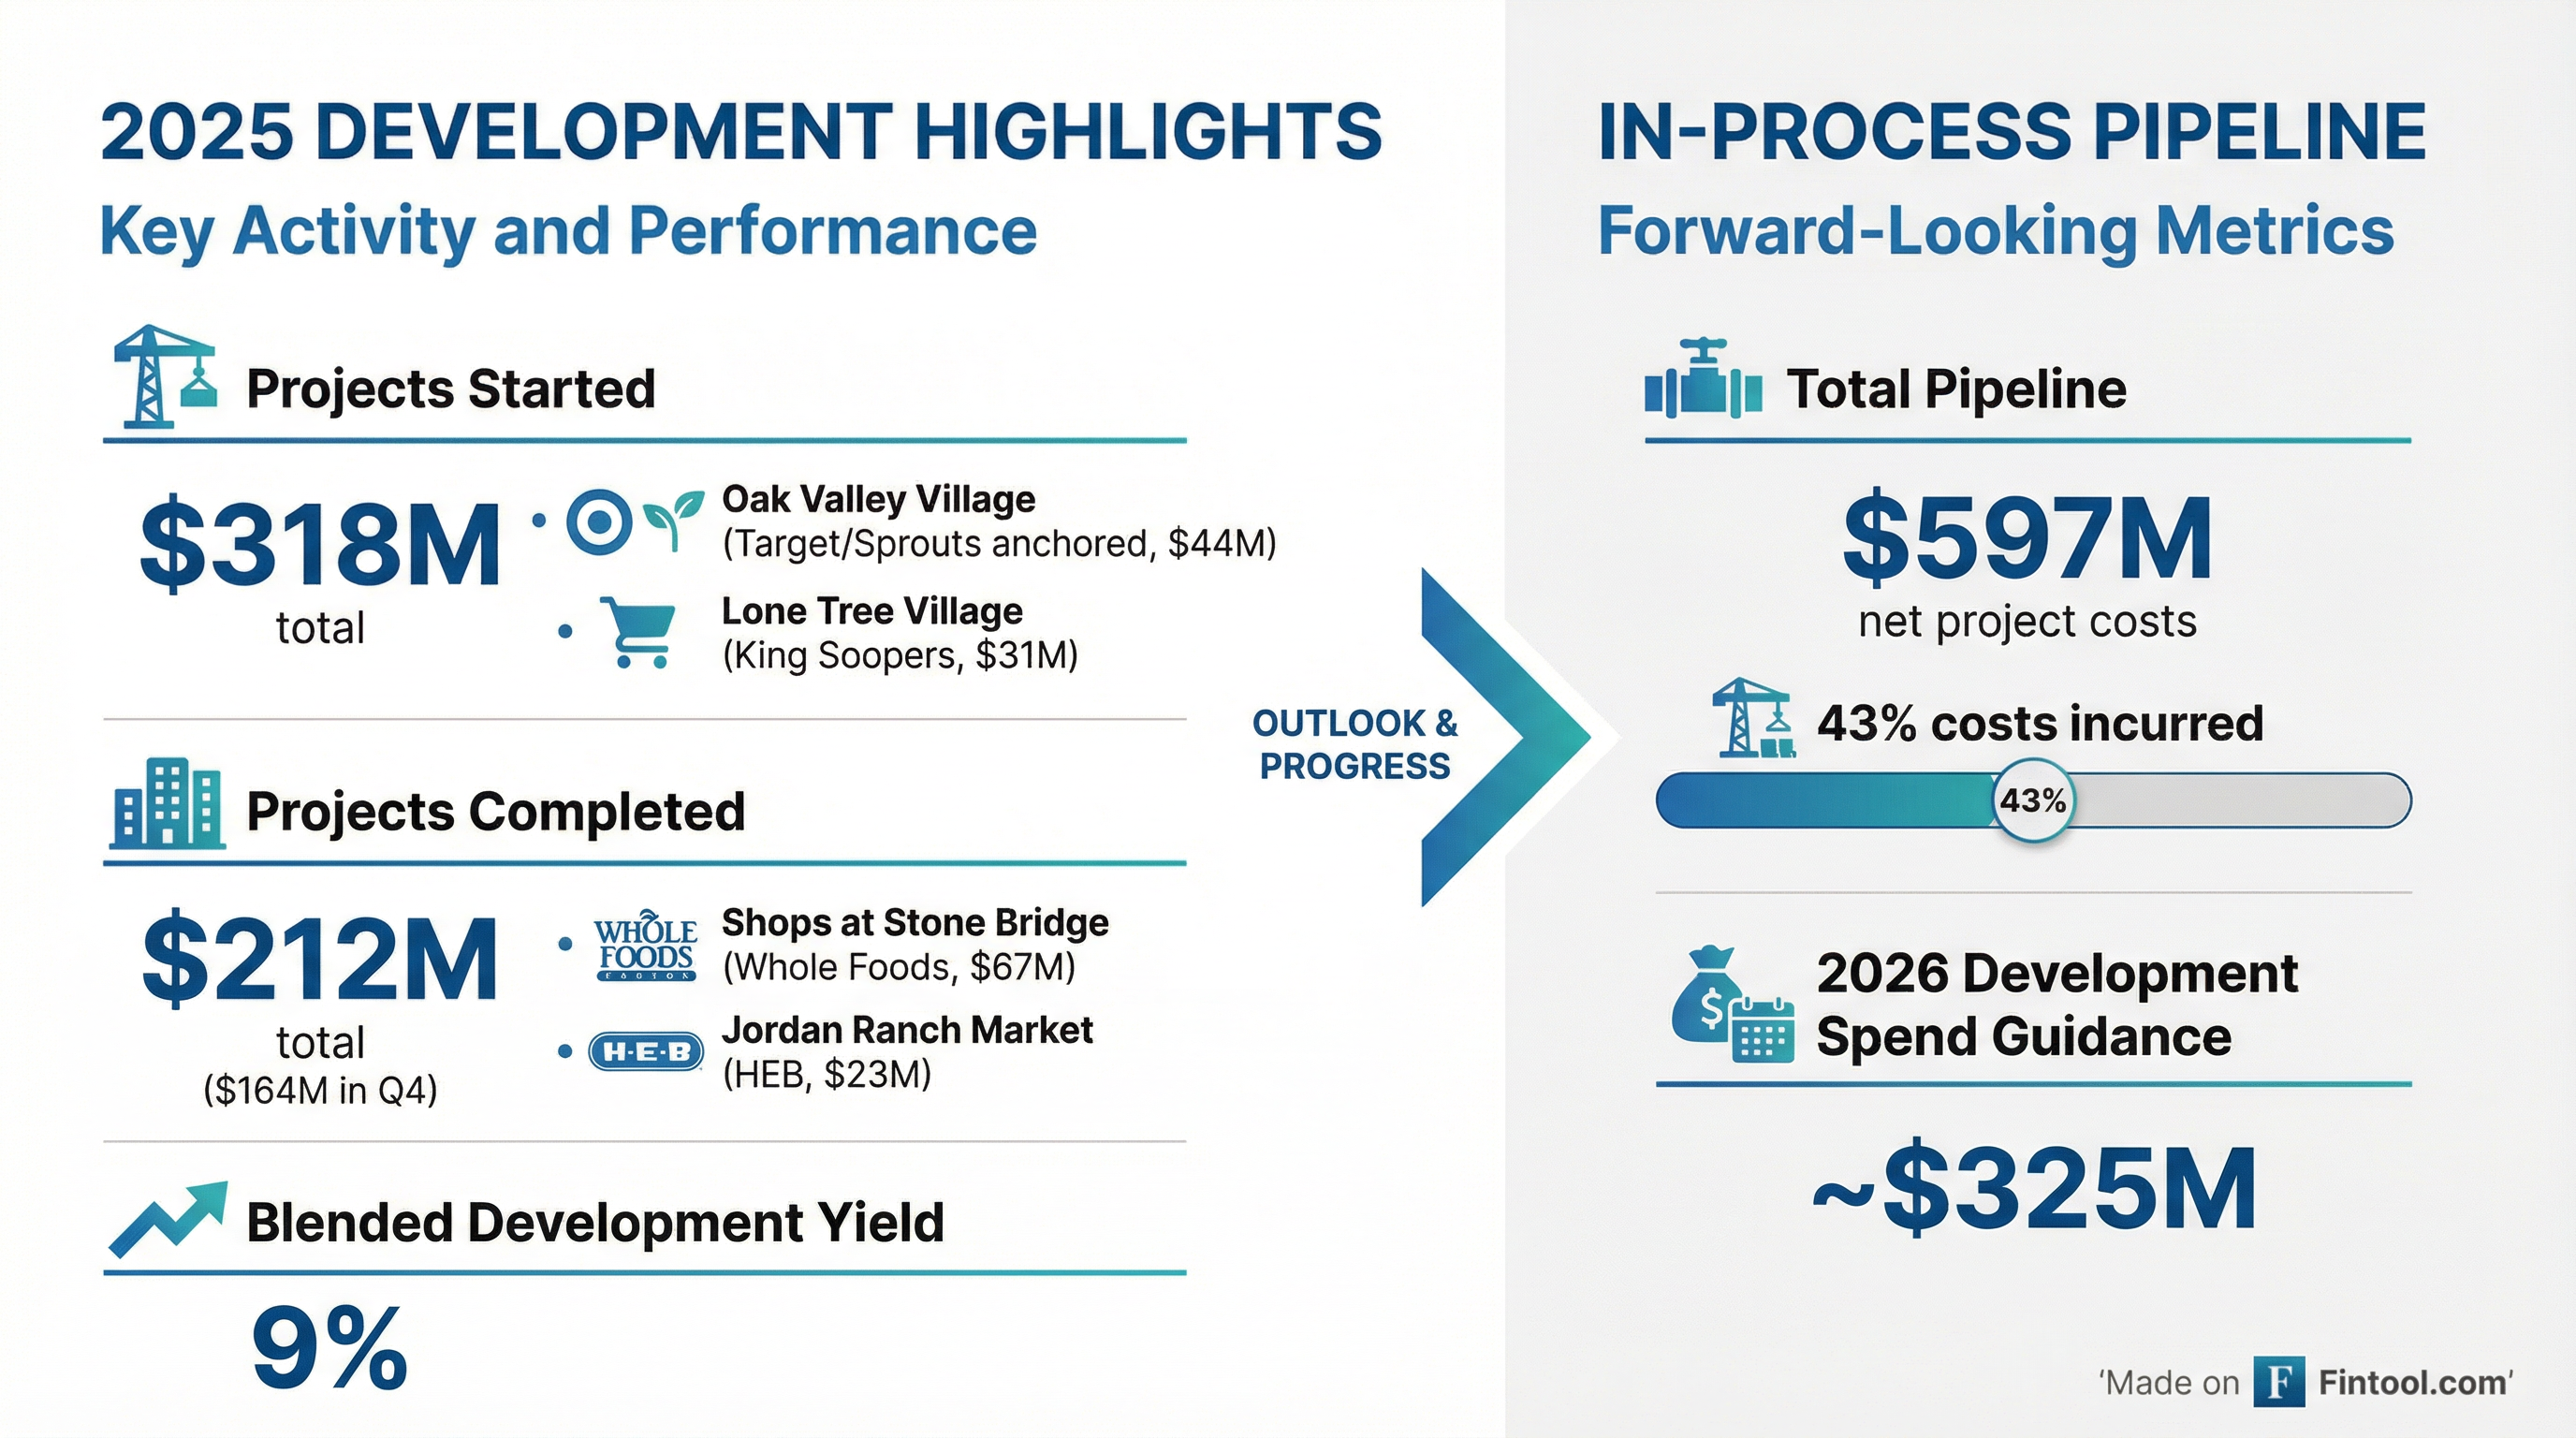
Q4 2025 Ground-Up Development Starts (~$90M+)
Q4 2025 Project Completions (~$164M)
In-Process Pipeline: As of December 31, 2025, Regency had $597 million of projects in process at a blended estimated yield of 9%, with 43% of costs incurred.
Forward Pipeline Visibility: Management has visibility into nearly $1 billion of project starts over the next three years, with approximately 75% expected to be ground-up development.
Balance Sheet Strength
Conservative leverage with ample liquidity.
During Q4, Regency settled the remaining ~666K shares under forward sale agreements from its ATM program at an average price of $75.05 per share.
2025 Acquisition Activity
Regency acquired approximately $538 million of high-quality shopping centers during 2025 at a weighted average cap rate of 6.0%. Notable transactions included:
- October 2025: Completed a distribution transaction with its Regency-GRI joint venture partner, resulting in Regency gaining 100% ownership of five properties while exiting six others.
- October 2025: Disposed of Hammocks Town Center in Miami for approximately $72 million.
- Post-Quarter: Acquired Crystal Brook Corner, a redevelopment project on Long Island, NY for $30 million.
2026 Guidance: No acquisitions or dispositions are assumed in 2026 guidance.
Tenant Mix and Category Breakdown
Regency's portfolio remains well-diversified across essential retail categories:
The company continues to de-emphasize pharmacy (down from higher levels) while growing medical and fitness exposure.
Q&A Highlights
Amazon Fresh Closures
Amazon announced closure of its entire Amazon Fresh fleet, including 4 locations in REG's portfolio. Management emphasized:
"The grocery sector is strong in terms of their expansion right now... The amount of inbounds we got immediately when that announcement came out speaks to the strength of the real estate. There is significant term remaining on those leases. It is Amazon credit. We're going to be patient and make the right decision." — Alan Roth, COO
Key points:
- All 4 stores have closed
- No term fee from Amazon assumed in guidance
- Conversion to Whole Foods possible, but other grocers showing strong interest
- Amazon will continue paying rent through lease term
Crystal Park Acquisition Details
Nick Wibbenmeyer provided color on the Long Island redevelopment:
"Although we acquired it for $30 million, we do anticipate investing about the same amount of capital over the next couple of years, bringing Whole Foods and other exciting tenants online. We expect that project to stabilize similar to our ground-up developments north of a 7% return."
Acquisition Market Conditions
Cap rates for grocery-anchored retail are in the 5%-6% range, with demand continuing to grow. No acquisitions currently under contract, but teams are actively pursuing opportunities.
Same Property NOI Quarterly Cadence
CFO Mike Mas provided quarterly expectations:
- Q1: Expected above full-year guidance range (higher expense recovery rate vs. prior year)
- Q2: Expected below guidance range (tough CAM reconciliation comp from 2025)
- H1 vs H2: Cadence should be largely consistent between halves
Anchor Leasing Pipeline
Strong momentum with prospects including: TJX, Nordstrom Rack, Ulta, Ross, Burlington, Williams-Sonoma, PGA TOUR Superstore, Arhaus, Pottery Barn, and Total Wine.
Construction Costs
Management expressed confidence in cost stability:
"We feel really good that construction costs were stable. We have good visibility, and we are confident in our underwriting." — Nick Wibbenmeyer
Key Risks to Monitor
- Interest Rate Sensitivity: Higher interest expense is a headwind in 2026 guidance (~$0.09/share impact from refinancing).
- Anchor Vacancies: Anchor occupancy declined 70 bps YoY to 97.9%, offsetting shop gains.
- Same Property NOI Normalization: Guidance of 3.25%-3.75% is below the 5.3% achieved in 2025, suggesting more typical growth ahead.
- Amazon Fresh Spaces: 4 vacant boxes need to be re-tenanted; no term fee revenue assumed in guidance.
The Bottom Line
Regency Centers delivered a strong finish to 2025 with Q4 results that beat on both revenue and FFO. The company's grocery-anchored portfolio continues to demonstrate resilience, with robust leasing spreads, expanding shop occupancy, and a well-funded development pipeline.
With 2026 FFO guidance implying 4.5% growth at the midpoint, conservative leverage at 5.1x, and a freshly increased dividend, Regency remains well-positioned among retail REITs. The key focus for investors will be the pace of SNO conversions and the development pipeline delivering at projected 9% yields.