Earnings summaries and quarterly performance for REGENCY CENTERS.
Executive leadership at REGENCY CENTERS.
Lisa Palmer
President and Chief Executive Officer
Alan T. Roth
East Region President and Chief Operating Officer
Martin E. Stein, Jr.
Executive Chairman of the Board
Michael J. Mas
Executive Vice President, Chief Financial Officer
Nicholas A. Wibbenmeyer
West Region President and Chief Investment Officer
Board of directors at REGENCY CENTERS.
Bryce Blair
Director
C. Ronald Blankenship
Lead Independent Director
Deirdre J. Evens
Director
Gary E. Anderson
Director
James H. Simmons, III
Director
Karin M. Klein
Director
Kristin A. Campbell
Director
Peter D. Linneman
Director
Thomas W. Furphy
Director
Research analysts who have asked questions during REGENCY CENTERS earnings calls.
Juan Sanabria
BMO Capital Markets
10 questions for REG
Todd Thomas
KeyBanc Capital Markets
10 questions for REG
Floris van Dijkum
Compass Point Research & Trading
8 questions for REG
Michael Goldsmith
UBS
8 questions for REG
Michael Gorman
BTG Pactual
8 questions for REG
Paulina Rojas Schmidt
Green Street Advisors
7 questions for REG
Ronald Kamdem
Morgan Stanley
7 questions for REG
Cooper Clark
Wells Fargo
6 questions for REG
Samir Khanal
Bank of America
6 questions for REG
Wesley Golladay
Robert W. Baird & Co.
6 questions for REG
Craig Mailman
Citigroup
5 questions for REG
Jamie Feldman
Wells Fargo & Company
5 questions for REG
Ki Bin Kim
Truist Securities
5 questions for REG
Michael Griffin
Citigroup Inc.
5 questions for REG
Mike Mueller
JPMorgan Chase & Co.
5 questions for REG
Ravi Vaidya
Mizuho
5 questions for REG
Viktor Fediv
Scotiabank
5 questions for REG
Greg McGinniss
Scotiabank
4 questions for REG
Linda Tsai
Jefferies
4 questions for REG
Steve Sakwa
Evercore ISI
4 questions for REG
Michael Mueller
JPMorgan Chase & Co.
3 questions for REG
Alec Vergara
Baird
2 questions for REG
Haendel St. Juste
Mizuho Financial Group
2 questions for REG
Nick Joseph
Citigroup Inc.
2 questions for REG
Omotayo Okusanya
Deutsche Bank AG
2 questions for REG
Paulina Rojas
Green Street
2 questions for REG
Rich Hightower
Barclays
2 questions for REG
Sydney Rome
Barclays Bank
2 questions for REG
Sydney Wessinger
Barclays Bank
2 questions for REG
Andrew Reale
Bank of America
1 question for REG
Dori Kesten
Wells Fargo & Company
1 question for REG
Floris Gerbrand van Dijkum
Compass Point Research & Trading, LLC
1 question for REG
Nicholas Joseph
Citigroup
1 question for REG
Sameer Hanal
Bank of America
1 question for REG
Victor Faiti
Scotiabank
1 question for REG
Recent press releases and 8-K filings for REG.
- Highlighted a portfolio of high-quality, necessity-based grocery-anchored centers, disciplined execution, and a differentiated development platform driving visible earnings growth and value creation.
- Reported strong leasing demand with limited new supply, approaching peak shop occupancy, and 2025 lease spreads of +11% cash-on-cash and +21% GAAP, underpinning robust pricing power.
- Advanced an $825 million development pipeline over the past three years, targeting >7% yields on cost with a 150 bp cap-rate spread, including a recent Jacksonville Publix-anchored groundbreaking.
- Emphasized an A-rated balance sheet with low leverage and strong liquidity; funding growth via levered free cash flow alongside a $450 million bond at the lowest spread in company history and regular early-2027 refinancing.
- Provided 2027 guidance of 3% same-store NOI growth.
- Emphasizes combination of high-quality grocery-anchored shopping centers, strong tenant demand and limited new supply supporting record occupancies and robust leasing momentum.
- Highlights a differentiated development platform with an $825 million pipeline advancing through starts and completions, targeting ≥7% yield on cost and a 150 bp spread to market cap rates for accretive NOI in 2026 and beyond.
- Notes a strong balance sheet with A-level credit ratings, low leverage and ample liquidity to internally fund development while remaining opportunistic on acquisitions.
- Reports leasing strength with 11% cash-on-cash lease spreads and 21% GAAP rent spreads in 2025, and provides same-property NOI growth guidance of 3% for 2027.
- Describes an enterprise intelligence initiative, leveraging data analytics and a fast-follower approach to technology and AI partnerships to drive operational efficiency and scalability.
- Regency highlighted a compelling growth strategy based on high-quality, necessity-based shopping centers, disciplined execution, and a differentiated development platform driving earnings growth and value creation.
- Strong leasing momentum, with demand outpacing minimal new supply, record shop occupancy, and 2025 GAAP rent spreads of 21%, underscoring robust pricing power.
- Development pipeline of $825 million under construction, targeting ≥7% yield on cost and a 150 bp spread to market cap rates, with meaningful NOI contributions expected in 2026 and beyond.
- A-rated balance sheet with low leverage supported a $450 million bond issuance at the lowest credit spread in company history; levered free cash flow funds development while maintaining refinancing flexibility.
- Focus on enterprise intelligence, leveraging data analytics and partnering on AI solutions as a fast follower to enhance leasing and back-office productivity and scale efficiently.
- 480+ properties encompassing 58 M+ SF of grocery-anchored centers with >96% same-property leased and 3.9% dividend CAGR since 2014.
- Strong balance sheet with net debt + preferred stock/to EBITDAre of 5.1x, Moody’s A3/S&P A- ratings and ~$1.4 B revolver availability as of 12/31/25.
- Robust development pipeline: > $825 M of project starts (2023–25), ~$600 M in-process projects, $597 M in-process pipeline at ~9% yields; targeting ~$1 B of starts over the next three years.
- 2025 acquisitions of ~$540 M at a ~6% blended cap rate, including the $357 M Rancho Mission Viejo portfolio.
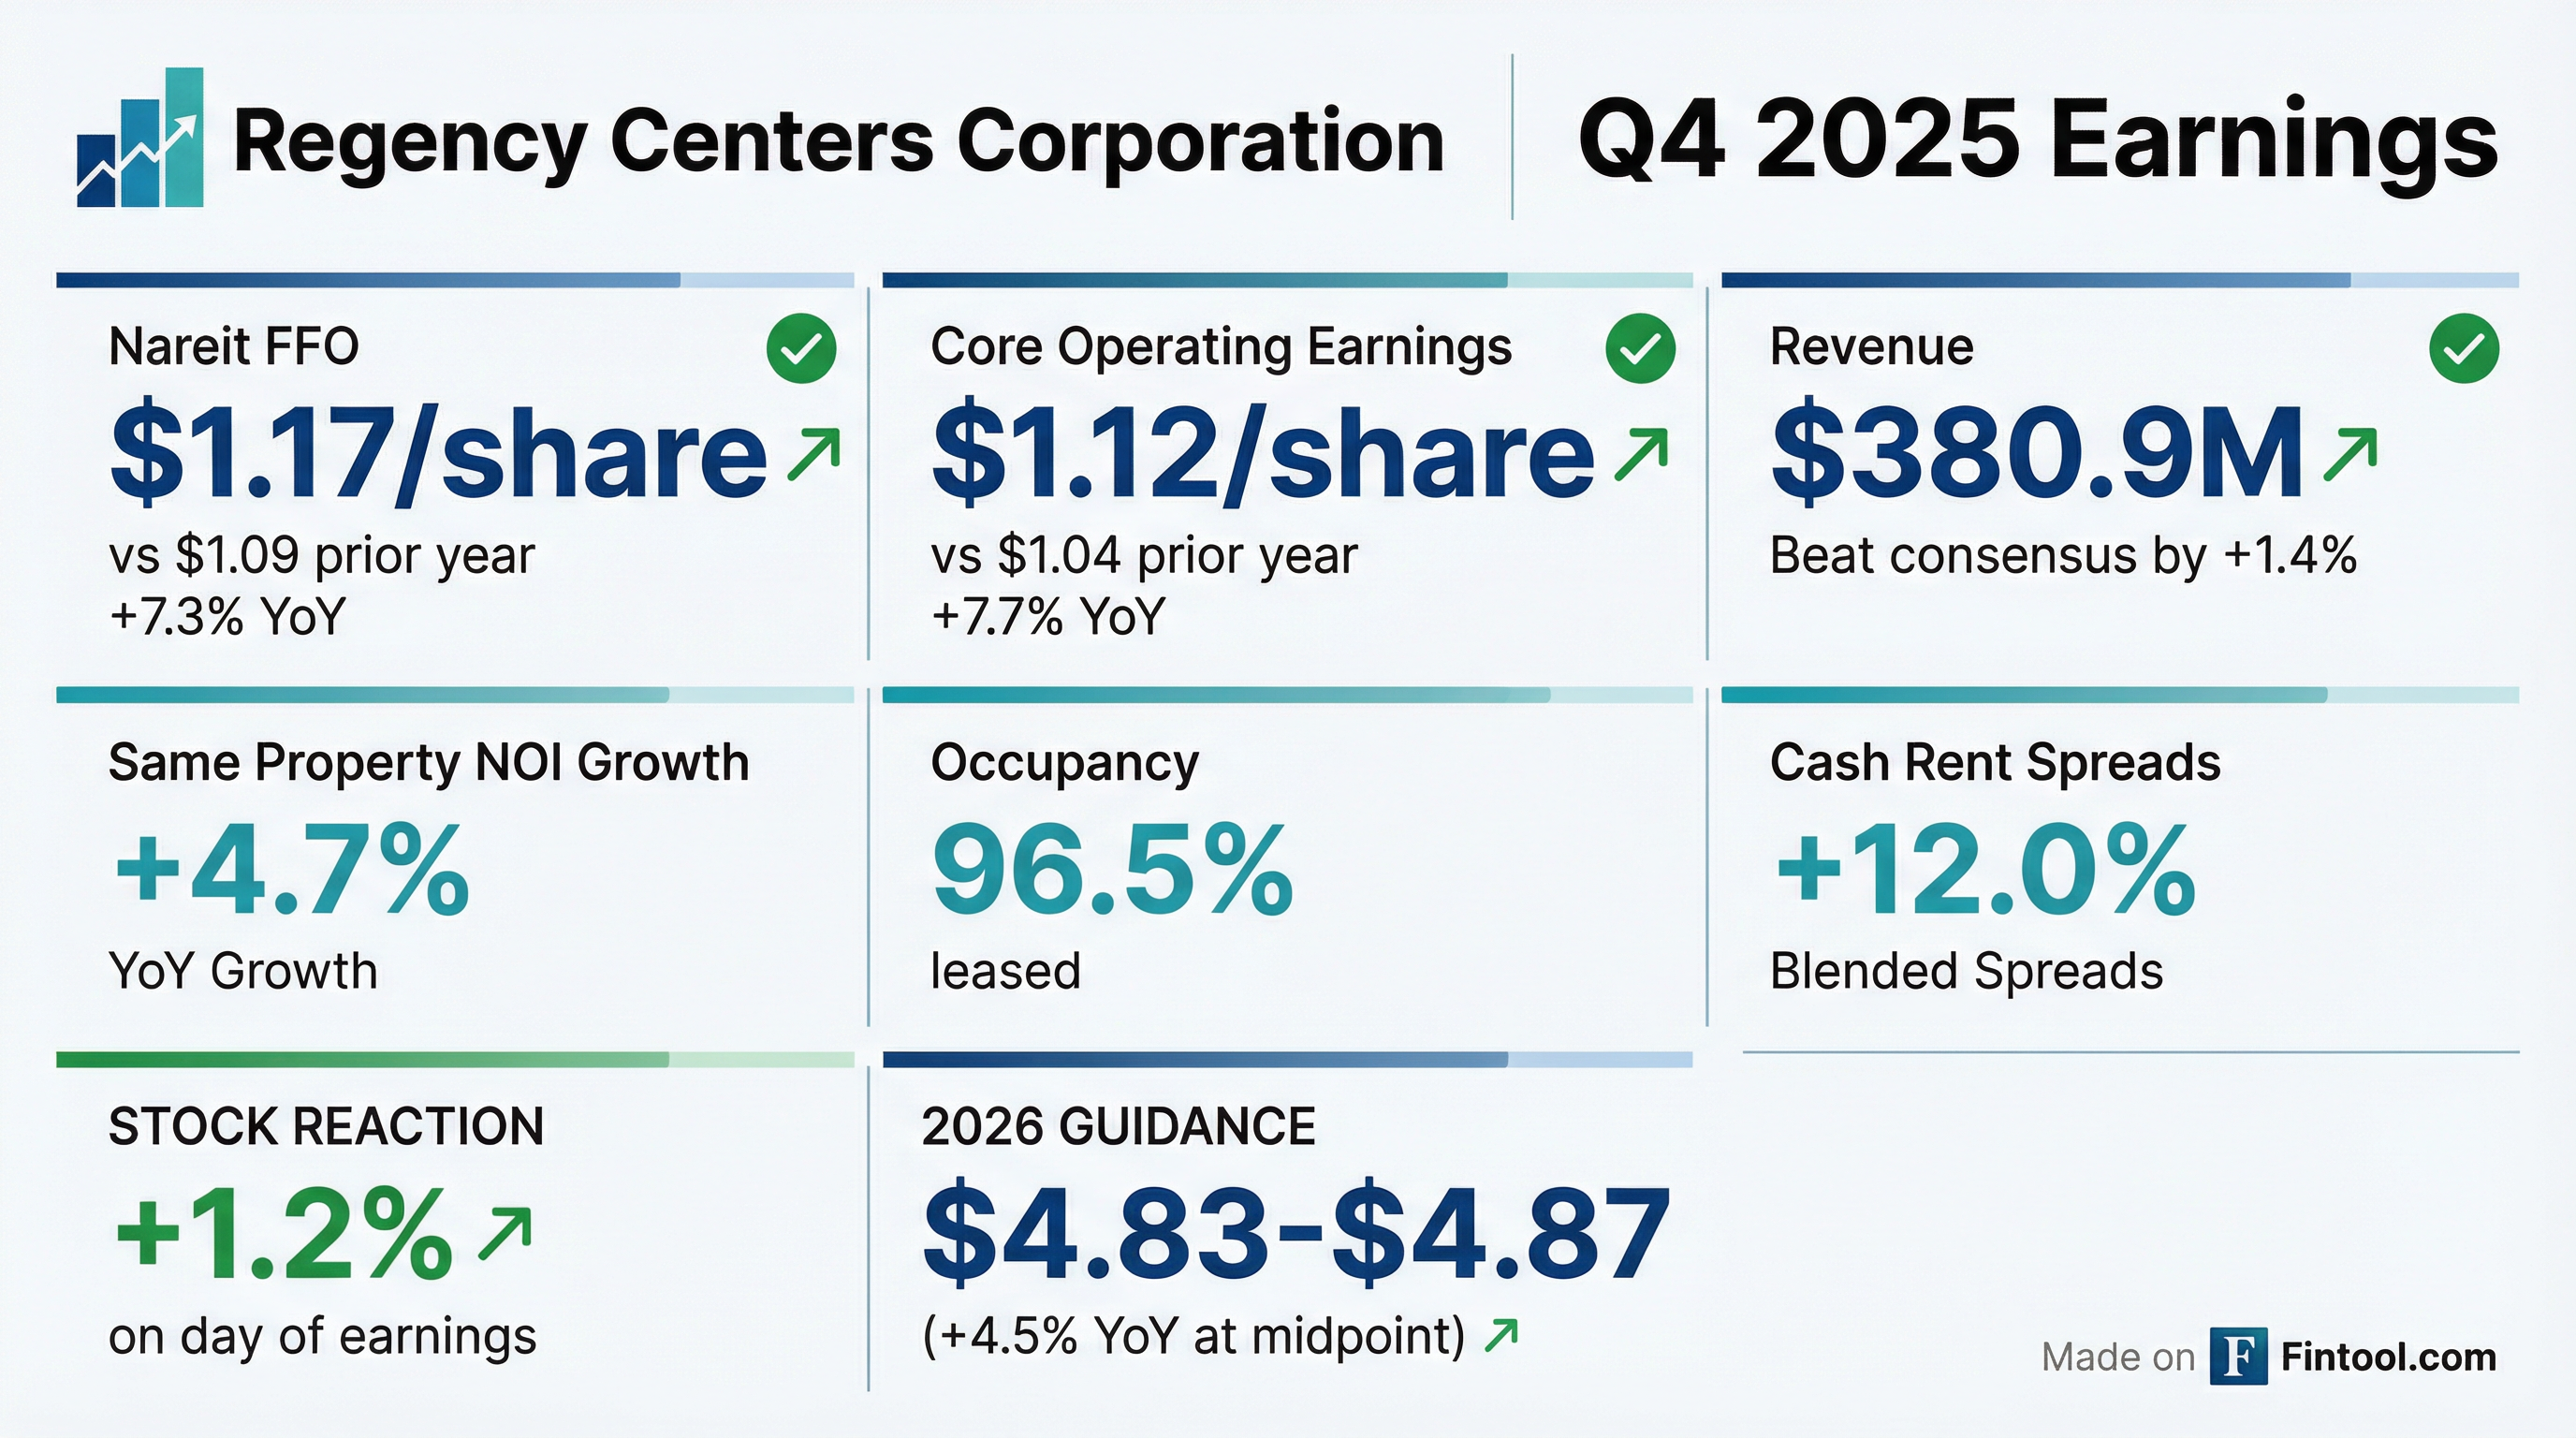
- 2026 guidance: Nareit FFO of $4.83–$4.87 per diluted share, Core Operating Earnings of $4.59–$4.63, and same-property NOI growth of 3.25–3.75%.
- Regency Centers, L.P. priced a $450 million public offering of 4.50% senior unsecured notes due March 15, 2033 at 99.376% of par (coupon 4.50%).
- Guaranteed by Regency Centers Corporation, the notes rank pari passu with existing unsecured debt and pay interest semi-annually on March 15 and September 15, beginning September 15, 2026.
- Estimated net proceeds of approximately $443.3 million will be used to reduce the outstanding credit line, repay $100 million of 3.81% notes maturing May 11, 2026, and for general corporate purposes.
- The underwritten offering, led by BofA Securities as representative, was agreed under an underwriting agreement on February 18, 2026 and closed on February 23, 2026.
- Regency Centers priced $450 million of senior unsecured notes due March 15, 2033 at 99.376% of par with a 4.50% coupon.
- Proceeds will reduce its credit line, repay $100 million of 3.81% notes maturing May 11, 2026, and fund general corporate purposes including capital expenditures and development projects.
- Settlement is expected on February 23, 2026, with interest payable semiannually on March 15 and September 15, beginning September 15, 2026.
- On February 17, 2026, Regency Centers Corp. entered into an Equity Distribution Agreement with RBC Capital Markets, LLC as agent and Royal Bank of Canada as forward purchaser to issue shares of its $0.01 par common stock under its automatic shelf registration (Form S-3, File No. 333-217081).
- The Company may sell shares through net share settlement, cash, or physical settlement methods under the Equity Distribution and Forward Master Confirmations, with proceeds applied as set forth in the prospectus.
- Foley & Lardner LLP opined that shares issued and delivered under the agreement will be validly issued, fully paid, and non-assessable under Florida law.
- Issued shares will conform to the registration statement and prospectus descriptions, carry no preemptive or similar rights, and be delivered free of liens or claims.
- Regency delivered full-year NAREIT FFO per share growth of ~8% and Core Operating EPS growth of ~7%, driven by same-property NOI growth of over 5% in 2025.
- 2026 guidance calls for same-property NOI growth of 3.25%–3.75%, with Q1 expected above and Q2 below the full-year range, and a 100–150 bp headwind from debt refinancing factored in.
- The company deployed >$825 million of accretive investments in 2025 (>$500 million in acquisitions; $300 million in development/redevelopment), with a $600 million in-process pipeline and visibility to $1 billion of project starts over the next three years.
- Operational fundamentals remain robust: same-property NOI up 5.3%, average commencement rate +150 bps, shop occupancy at 94.2%, Q4 cash rent spreads 12%, renewal spreads 13%, and gap rent spreads 25%.
- Regency delivered 5.3% same-property NOI growth in 2025, record 94.2% shop occupancy, 12% cash rent spreads and 13% renewal spreads in Q4 2025.
- The investments platform deployed $825 million in 2025—$500 million of acquisitions and $300 million of development—completing $160 million of projects in Q4 at 9% blended returns.
- Development activity accelerated with $300 million of new project starts in 2025 (over $800 million in the past three years), an in-process pipeline of $600 million, and visibility into $1 billion of starts over the next three years.
- For 2026, guidance includes 3.25%–3.75% same-property NOI growth, mid-5%–6% FFO/share growth (ex-refinancing impact), supported by A3/A- ratings, 5.0–5.5x leverage and $1.5 billion of available credit.
- Delivered 5.3% same-property NOI growth, supported by rent commencement and redevelopment, and achieved a record 94.2% shop occupancy at year-end.
- Recorded strong leasing spreads with 12% cash rent, 13% renewal, and 25% gap rent spreads; over 95% of 2025 leases include annual rent steps.
- Deployed $825 million into accretive investments in 2025—$500 million in acquisitions and $300 million in development—and completed 13 projects totaling $160 million at a 9% blended return.
- Initiated $300 million+ of new ground-up and redevelopment starts in 2025, maintaining an in-process pipeline of $600 million and visibility to $1 billion of starts over the next three years.
- Guided $325 million of 2026 development and redevelopment spend, with approximately two-thirds allocated to ground-up projects.
Quarterly earnings call transcripts for REGENCY CENTERS.
Ask Fintool AI Agent
Get instant answers from SEC filings, earnings calls & more