RAYMOND JAMES FINANCIAL (RJF)·Q1 2026 Earnings Summary
Raymond James Beats on Revenue and EPS as Client Assets Hit Record $1.77T
January 28, 2026 · by Fintool AI Agent
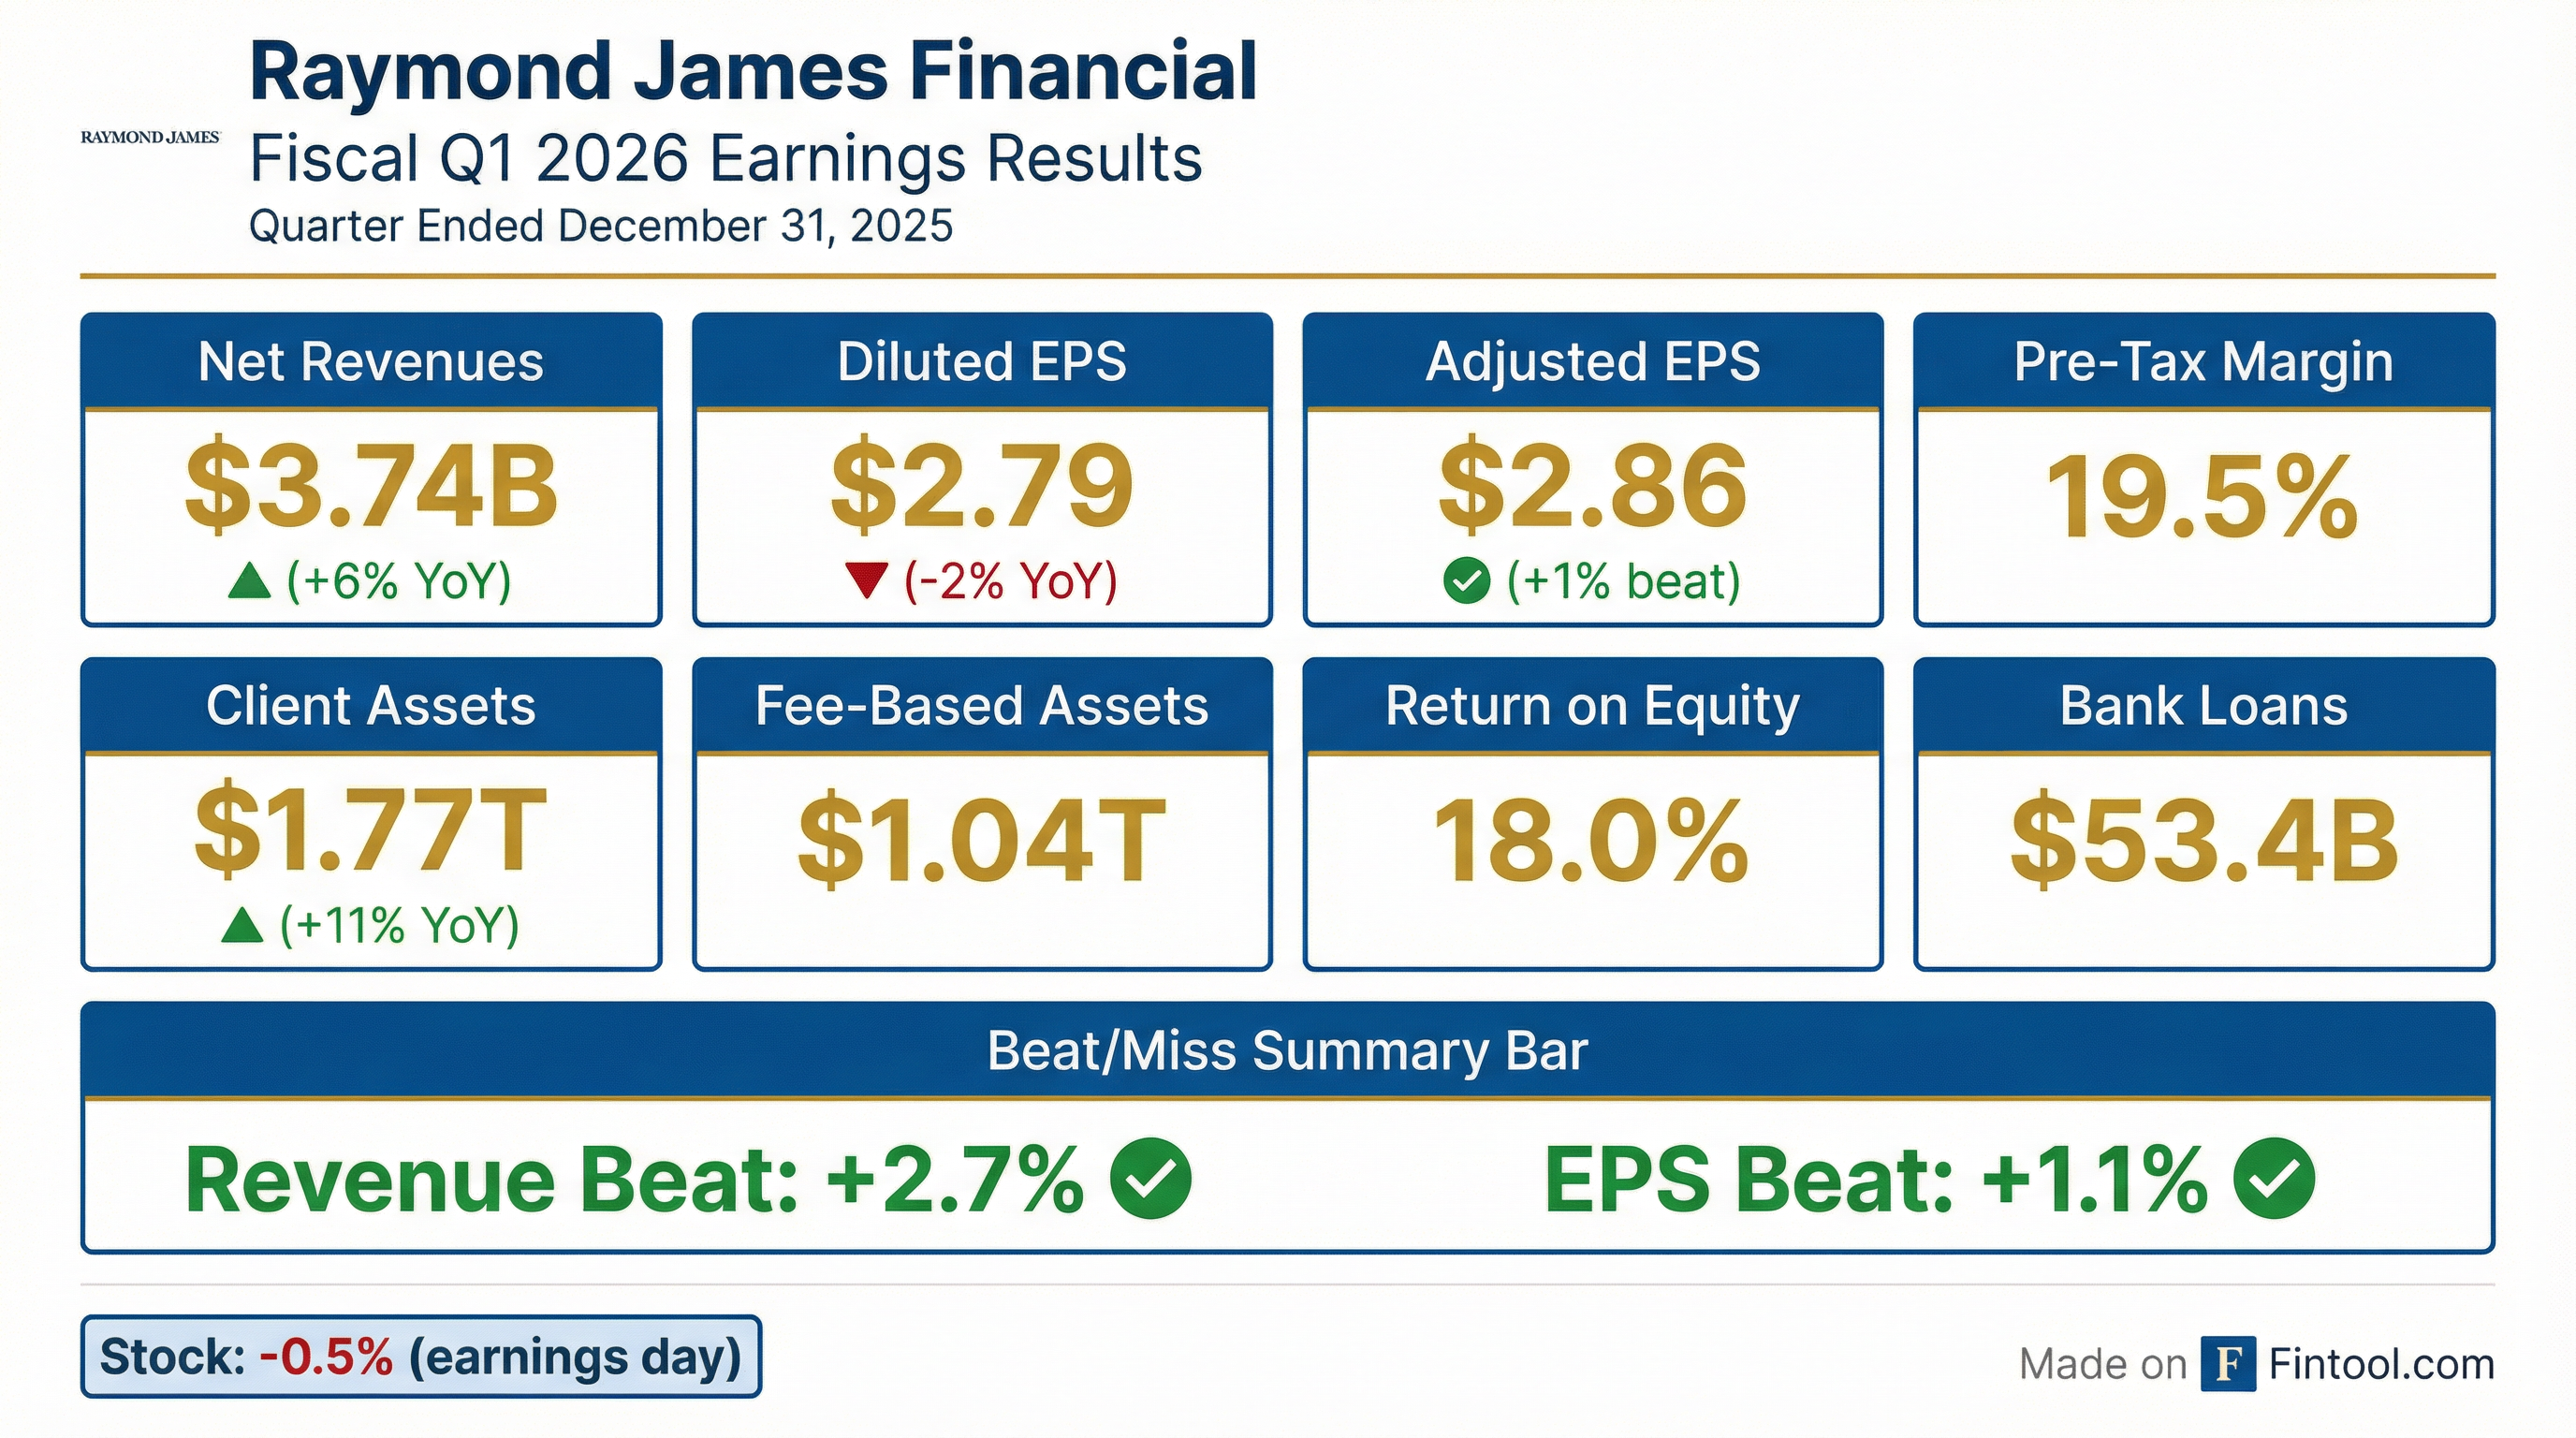
Raymond James Financial delivered a double beat in fiscal Q1 2026, with net revenues of $3.74 billion (+6% YoY) exceeding consensus by 2.7% and adjusted EPS of $2.86 topping estimates by 1.1% . The diversified financial services firm reached record client assets of $1.77 trillion, even as year-over-year earnings declined modestly due to the impact of Fed rate cuts on net interest income.
Did Raymond James Beat Earnings?
Yes — a double beat. Raymond James exceeded consensus on both revenue and earnings:
While the company beat estimates, year-over-year comparisons were softer: net revenues grew 6% but pre-tax income declined 3%, and diluted EPS fell 2% compared to Q1 FY2025 . The decline reflects the cumulative impact of 125+ basis points in Fed rate cuts since September 2024, which pressured net interest income across the firm.
What Changed From Last Quarter?
The sequential picture was more mixed than the year-over-year view:
Key sequential drivers:
- Asset management fees surged 6% sequentially to $2.0B, driven by higher PCG fee-based assets
- Investment banking revenues plunged 34% sequentially to $208M after a strong Q4 that benefited from large private placement transactions
- Compensation ratio increased to 65.6% adjusted (vs 64.2% in Q4), partly seasonal
How Did Each Segment Perform?
Segment Highlights:
-
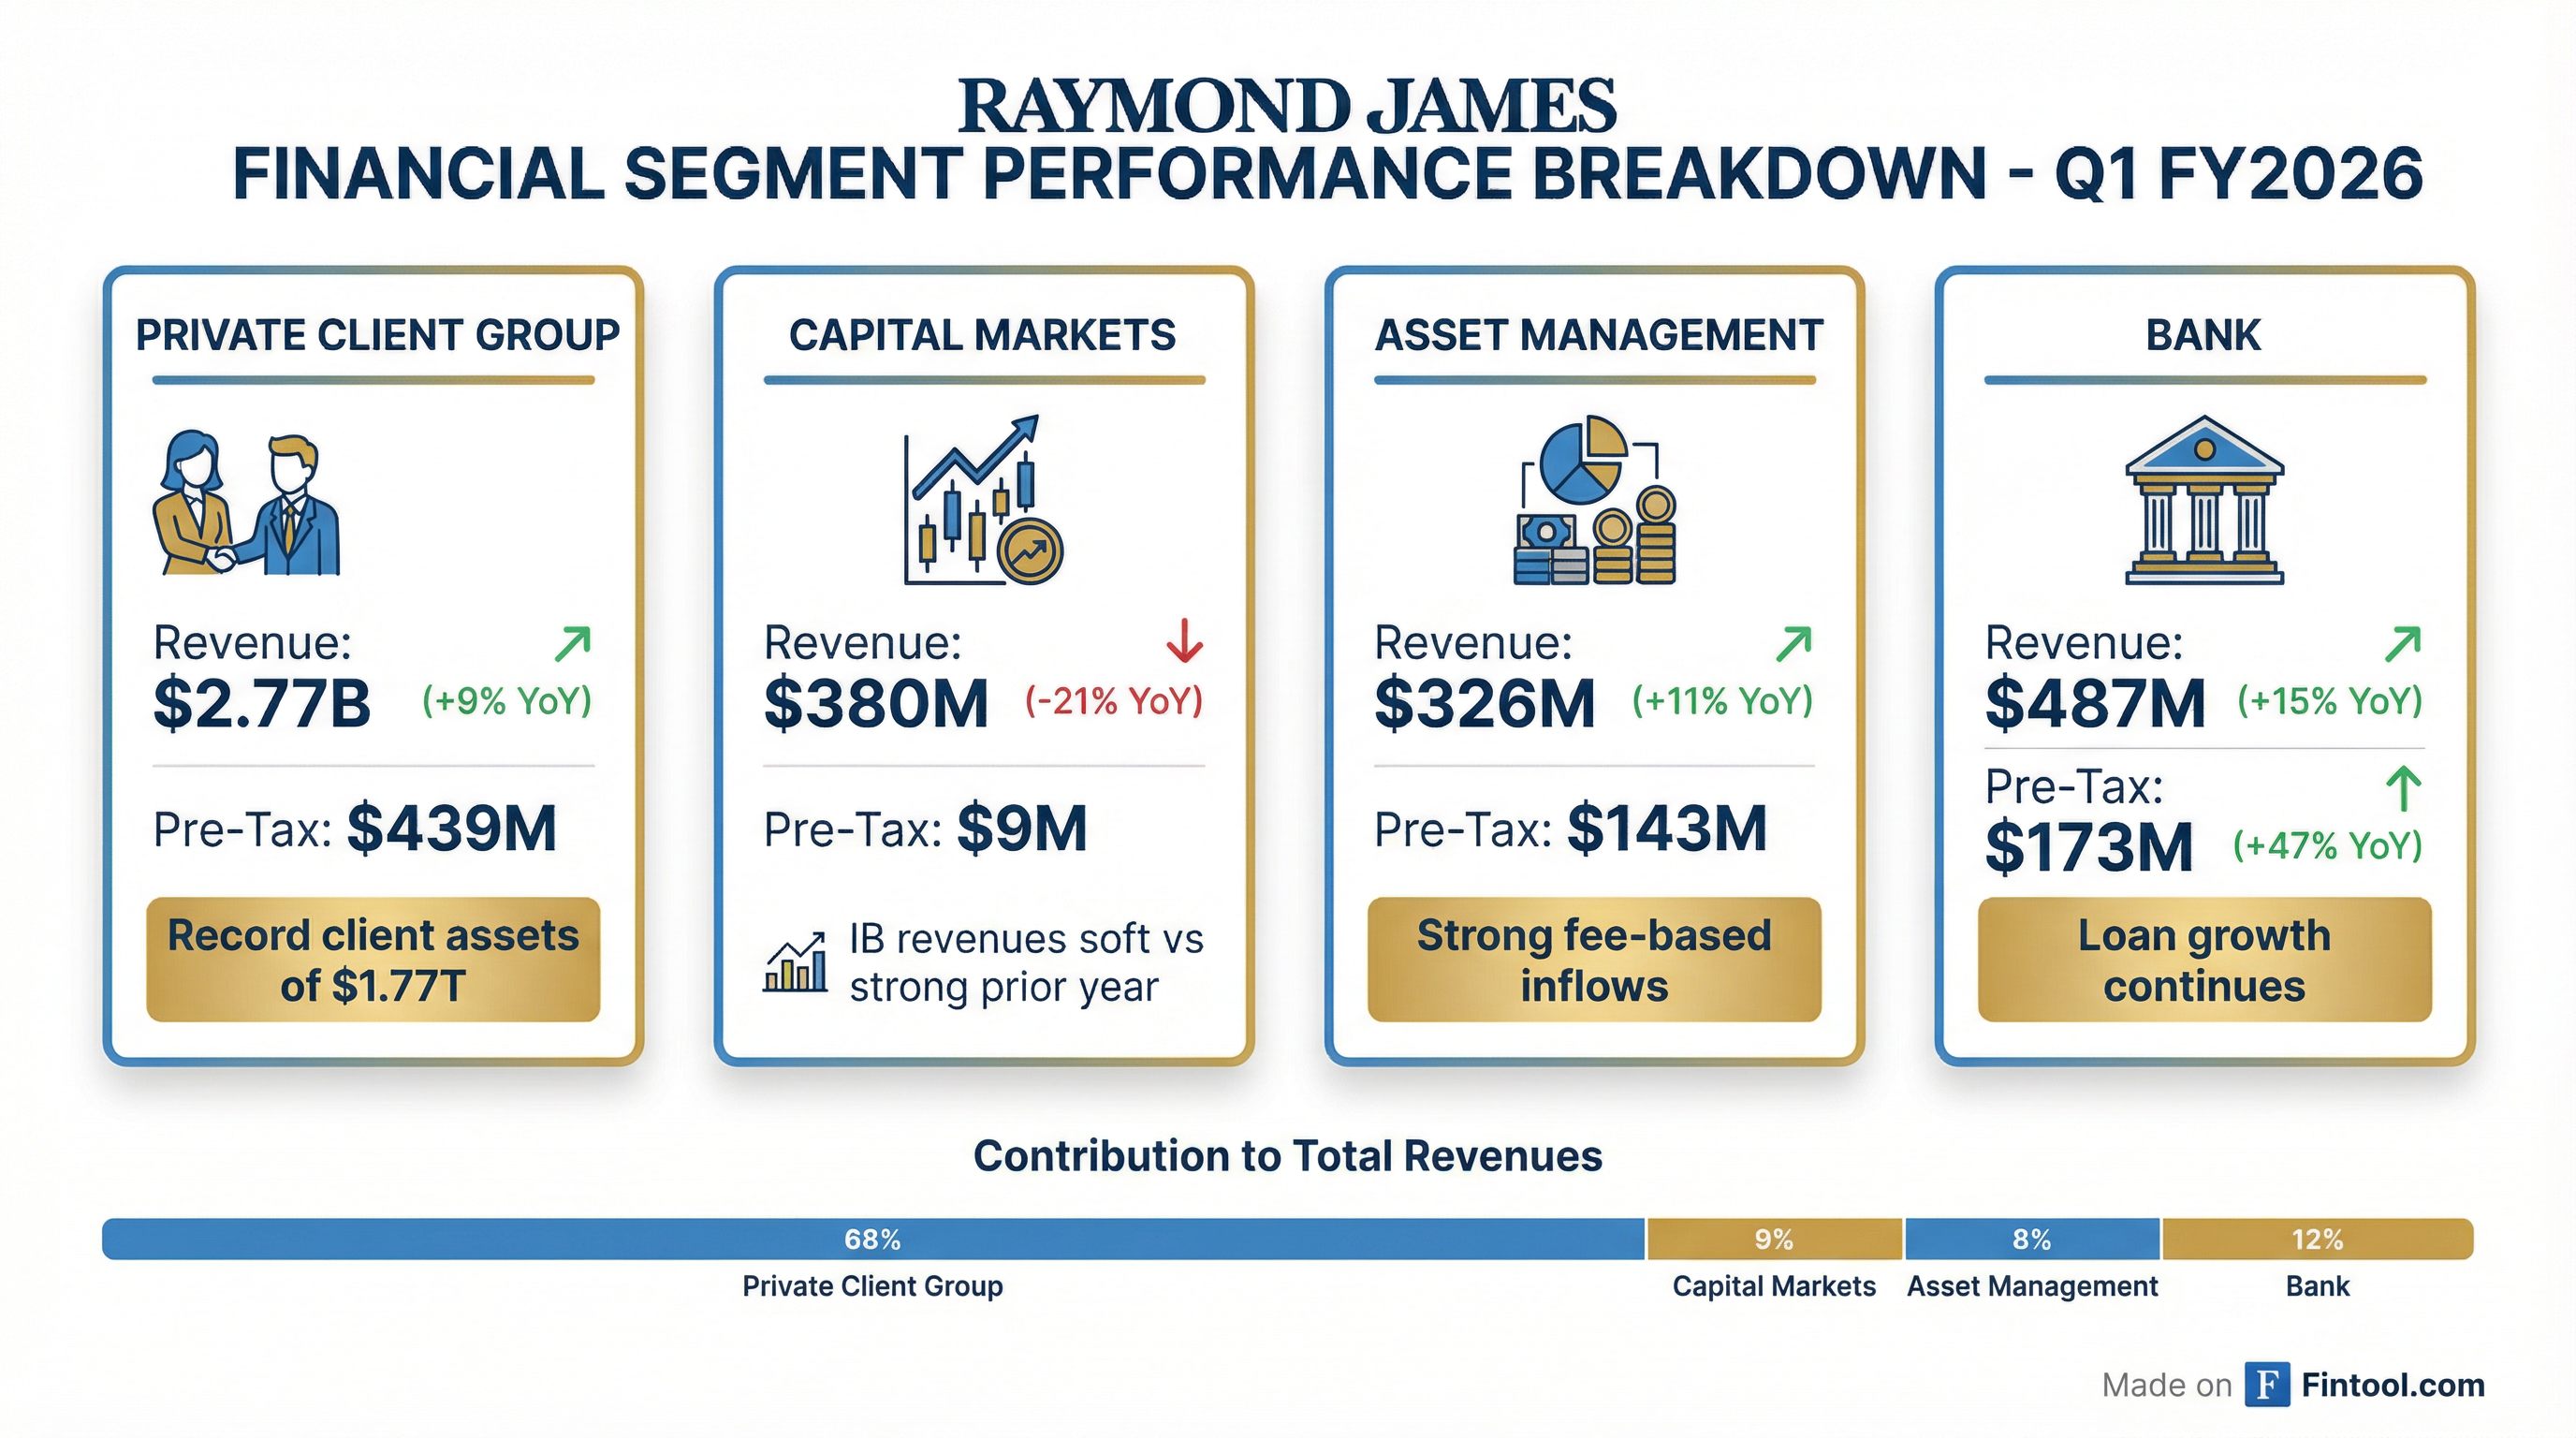
Private Client Group (74% of revenues): Record revenues driven by higher assets under administration and continued recruiting success. Net new assets of $30.8B represented an 8.0% annualized growth rate . However, pre-tax income declined 5% YoY as rate cuts compressed spreads.
-
Capital Markets (-21% YoY): The laggard this quarter, with investment banking revenues down 36% YoY . This compares to an unusually strong Q1 FY25 that benefited from elevated M&A activity. The segment's pre-tax margin collapsed to 2.4% from 11.2% a year ago.
-
Asset Management (+11% YoY): Benefited from market appreciation and strong net inflows into PCG fee-based accounts. Pre-tax margin held steady at 44%.
-
Bank (+15% YoY): The standout performer with pre-tax income surging 47% YoY. Loan growth of 13% YoY was driven by securities-based lending (+22% YoY) . Net interest margin in the bank segment was 2.75% .
What's Happening With Net Interest Income?
Combined net interest income and RJBDP fees (from third-party banks) totaled $667M, roughly flat with Q4 . The firmwide net interest margin expanded to 2.81% from 2.71% in Q4 .
Cash sweep balances — a key sensitivity to rate cuts — increased to $58.1B, up from $56.4B at the end of Q4 . This represents 3.7% of domestic PCG assets, slightly above recent levels.
Cash balances have stabilized after declining through much of FY25, suggesting clients have largely completed their reallocation out of cash following rate cuts.
How Did the Stock React?
RJF shares closed down 1.7% on earnings day at $168.31, despite the double beat. The stock remains up significantly over the past year but gave back recent gains following the results.
The decline likely reflects:
- Margin compression (-170 bps YoY on pre-tax margin) offsetting the revenue beat
- Capital Markets weakness (-21% revenues, -88% pre-tax income) raising questions about cyclical recovery timing
- Forward guidance calling for lower NII and asset management fees in Q2 due to fewer billing/interest days
- January cash outflows — domestic sweep and ESP balances already down $2.6B month-to-date
What Did Management Say on the Call?
On Recruiting and Competition
CEO Paul Shoukry emphasized Raymond James' differentiated position against private equity-backed roll-ups:
"What we're doing in that world, of what I call noisy competition, is really doubling and tripling down on what we've always done, which is really focusing on the personal relationships with financial advisors... Advisors are not looking for a 3-5-year destination with another liquidity event. We are kind of a long-term stable play for advisors and their clients."
Key recruiting stats:
- $31B net new assets — Second-best quarter ever
- Trailing 12-month production recruited: $460M and $63B client assets
- Advisor satisfaction: Highest since 2014
On AI and Technology
Raymond James launched Rai, a proprietary AI operations agent:
"It's a natural language sort of Q&A model that uses generative AI to answer questions for advisors and their sales assistants and their teams. That way, they don't even have to call in."
Technology investments:
- $1.1 billion annual technology spend
- 10,000+ associates using AI regularly
- 3M+ lines of code written monthly using AI
On Capital Markets Pipeline
"The pipeline remains very strong. There's a lot of pent-up demand in terms of buyers and sellers... A lot of holdings in funds are well beyond their original holding period. So there's a lot of pent-up demand."
Management expressed confidence but acknowledged timing uncertainty: "We would be disappointed for the rest of the year if the revenue in the capital markets segment doesn't improve meaningfully above the $380 million level."
On Clark Capital Acquisition
The announced acquisition of Clark Capital Management ($46B in combined AUM) represents the firm's M&A priorities:
"Cultural fit, strategic fit, and then the financials have to make sense for both us and for the sellers... They're high growth, high organic growth, differentiated product, but really deep personal relationships with their clients."
What About Capital Return?
Raymond James continued its aggressive capital return program:
Capital Position:
- Tier 1 Leverage Ratio: 12.7% (vs 13.1% in Q4) — still well above the 10% target
- Corporate Cash: $3.3B, down from $3.7B but still $2.1B above the $1.2B target
- Remaining Buyback Authorization: $1.9B under the new $2.0B program approved in December 2025
Management has guided to $400-500M of quarterly share repurchases to keep the Tier 1 leverage ratio from growing beyond current levels .
What Did Management Guide?
Q2 FY2026 Guidance:
January Update: Domestic sweep and ESP balances are down $2.6B month-to-date, including $1.8B from record quarterly fee billings. The remaining $800M decline reflects client reinvestment activity .
What's the Investment Outlook?
Bull Case:
- Record client assets ($1.77T) and $31B net new assets (second-best quarter ever)
- Securities-based lending surged 28% YoY and 10% sequentially, with ample runway as clients shift from home equity alternatives
- Investment banking pipeline "robust" with pent-up demand from PE sponsors
- $1.1B annual tech investment creating competitive moat — smaller peers "were basically on DOS prompt" according to recruited advisors
- Rai AI launch positions firm for service efficiency gains
- Clark Capital acquisition adds $46B AUM and high-growth model portfolio capabilities
Bear Case:
- Margin pressure persists — pre-tax margin down 170 bps YoY
- Capital Markets earnings nearly evaporated (-88% YoY pre-tax)
- Further rate cuts could pressure cash sweep economics — ESP balances declining as rates fall
- Compensation ratio at 65.6% vs 65% target due to revenue mix
- January cash balances already down $2.6B from quarter-end
Valuation Context:
- At $168/share and $12.5B book value, RJF trades at ~1.3x tangible book value
- Stock commands a premium to regional brokers given scale and diversified model
Key Metrics Summary
Raymond James will release Q2 FY2026 results in late April 2026.
Related Resources: