Earnings summaries and quarterly performance for ROPER TECHNOLOGIES.
Executive leadership at ROPER TECHNOLOGIES.
Board of directors at ROPER TECHNOLOGIES.
Research analysts who have asked questions during ROPER TECHNOLOGIES earnings calls.
Brent Thill
Jefferies
8 questions for ROP
Deane Dray
RBC Capital Markets
8 questions for ROP
Joseph Giordano
TD Cowen
8 questions for ROP
Terrell Tillman
Truist Securities
8 questions for ROP
Brad Reback
Stifel
6 questions for ROP
Joshua Tilton
Wolfe Research
6 questions for ROP
Ken Wong
Oppenheimer & Co. Inc.
6 questions for ROP
Julian Mitchell
Barclays Investment Bank
5 questions for ROP
George Kurosawa
Citigroup Inc.
4 questions for ROP
Scott Davis
Melius Research
4 questions for ROP
Joe Vruwink
Baird
3 questions for ROP
Clarke Jeffries
Piper Sandler & Co.
2 questions for ROP
C. Stephen Tusa
JPMorgan Chase & Co.
2 questions for ROP
Dylan Becker
William Blair
2 questions for ROP
Faith Brunner
William Blair
2 questions for ROP
Christopher Glynn
Oppenheimer & Co. Inc.
1 question for ROP
Dylan Baker
William Blair
1 question for ROP
Hoi-Fung Wong
Oppenheimer & Co. Inc.
1 question for ROP
Joseph Ritchie
Goldman Sachs
1 question for ROP
Joseph Vruwink
Baird
1 question for ROP
Steve Tusa
JPMorgan Chase & Co.
1 question for ROP
Recent press releases and 8-K filings for ROP.
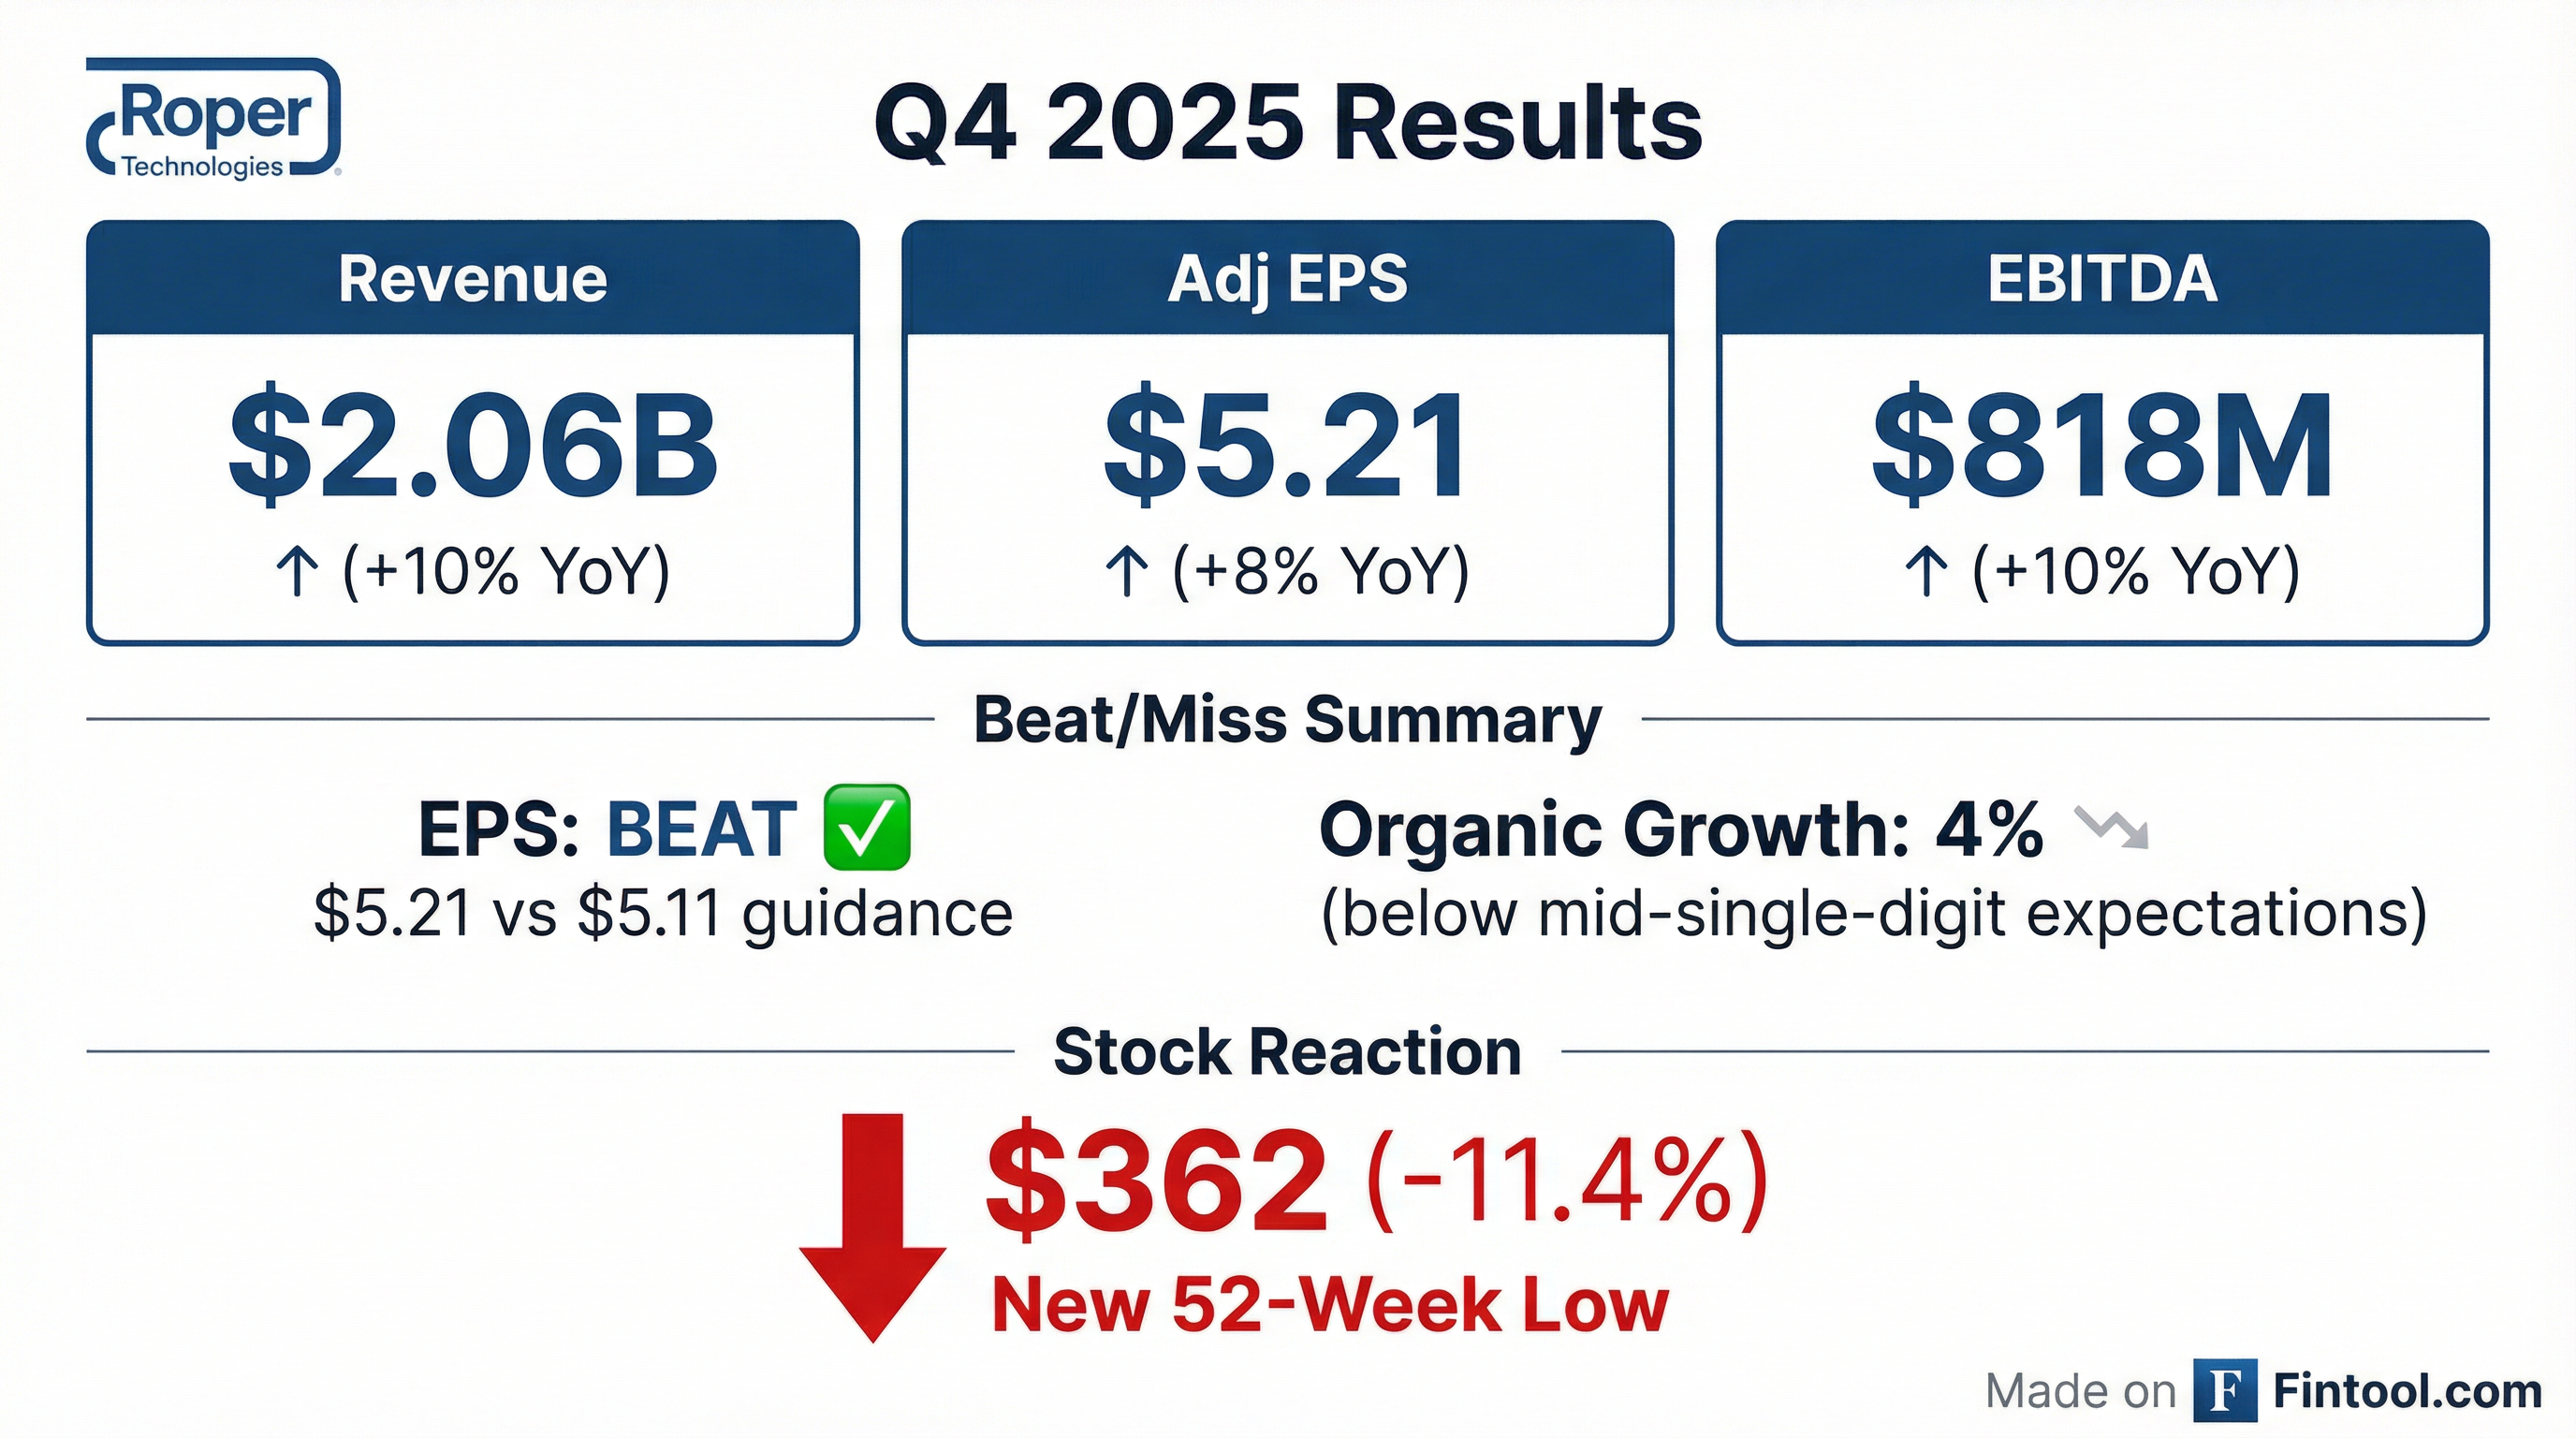
- Roper reported Q4 2025 adjusted revenue of $2.059 B, a 10% increase YoY, and adjusted DEPS of $5.21, up 8%.
- Q4 adjusted EBITDA reached $818 M with a 39.7% margin, a 10 bps improvement year-over-year.
- For full-year 2025, Roper achieved $7.902 B revenue (+12%), $3.143 B adjusted EBITDA (+11%), $2.466 B free cash flow (+8%), and DEPS of $20.00 (+9%).
- In 2025, Roper invested $3.3 B in acquisitions and repurchased 1.12 M shares for $500 M, supporting long-term growth.
- 2026 guidance calls for ~8% total revenue growth (organic 5–6%) and adjusted DEPS of $21.30–$21.55.
- Q4 2025 segment performance: Application software revenue +10% (organic +4%, margins +70 bps to 42.2%), network software +14% (organic +5%, margins 52.8%), tech segment +6% (organic +5%, margins flat at 34.8%).
- FY 2025 financials: Revenue $7.9 B (+12% total, organic +5.5%); EBITDA $3.1 B (39.8% margin); debt $20 B (+9%); free cash flow $2.5 B (31% of revenue, +8%).
- 2026 guidance: Free cash flow margin above 30%, with application and network software organic growth at the higher end of mid-single digits and tech at low- to mid-single digits; Q1 2026 FCF weighted lower due to new bond coupon timing.
- Capital deployment capacity: Approximately $6 B over the next 12 months for disciplined M&A and share repurchases, targeting vertical-market software businesses to maximize long-term cash flow per share.
- Roper delivered Q4 revenue of $2.06 billion (+10%), EBITDA of $818 million (+10%), and DEPS of $5.21 (above guidance of $5.11–5.16).
- Full-year 2025 revenue was $7.9 billion (+12%), EBITDA $3.1 billion (+11%), and free cash flow $2.5 billion (+8%), with net leverage of 2.9×.
- Deployed $3.3 billion on strategic software acquisitions and repurchased 1.1 million shares for $500 million in Q4, leaving over $6 billion in capital allocation capacity.
- 2026 guidance targets ~8% revenue growth, 5–6% organic growth, and adjusted DEPS of $21.30–21.55, with Q1 DEPS of $4.95–5.05.
- Q4 2025 revenue of $2.06 B, +10% YoY (5% acquisitions, 4% organic); EBITDA $818 M, +10%; DEPS $5.21, +$0.40
- FY 2025 revenue of $7.9 B, +12% (7% acquisitions, 5.5% organic); EBITDA $3.1 B (39.8% margin), +11%; DEPS $20, +9%; Free cash flow $2.5 B, +8%
- Deployed $3.3 B in acquisitions and repurchased 1.1 M shares for $500 M in Q4; net leverage 2.9× with >$6 B capital capacity for 2026
- 2026 guidance: revenue growth ~8%, organic +5–6%, DEPS $21.30–$21.55; Q1 DEPS $4.95–$5.05; full-year tax rate ~21%
- Q4 2025 revenue rose 10% to $2.06 billion (4% organic, 5% acquisition) and full-year revenue grew 12% to $7.90 billion (5% organic, 7% acquisition)
- GAAP net earnings fell 7% in Q4 to $428 million; adjusted net earnings rose 8% to $561 million. For the full year, GAAP net earnings were $1.54 billion (down 1%) and adjusted net earnings were $2.16 billion (up 9%)
- Q4 adjusted EBITDA increased 10% to $818 million, with full-year adjusted EBITDA up 11% to $3.14 billion
- The company generated $2.54 billion in operating cash flow and $2.47 billion of adjusted free cash flow in 2025, deploying $3.3 billion into acquisitions and repurchasing 1.12 million shares for $500 million
- Roper expects 2026 adjusted DEPS of $21.30–$21.55 and approximately 8% total revenue growth (organic growth of 5–6%)
- In Q4 2025, revenue rose 10% to $2.06 billion, GAAP net earnings fell 7% to $428 million, while adjusted net earnings grew 8% to $561 million and adjusted EBITDA increased 10% to $818 million.
- For the full year, revenue increased 12% to $7.90 billion, GAAP net earnings dipped 1% to $1.54 billion, adjusted net earnings rose 9% to $2.16 billion, and adjusted EBITDA grew 11% to $3.14 billion.
- Operating cash flow was $738 million in Q4 2025 (+2%) and $2.54 billion for the year (+6%); free cash flow reached $714 million in the quarter (+4%) and $2.47 billion for 2025 (+8%).
- The company repurchased 1.12 million shares for $500 million in Q4 2025 and deployed $3.3 billion on vertical software acquisitions during the year.
- Outlook for 2026 includes adjusted DEPS of $21.30–$21.55, total revenue growth of ~8% (organic +5–6%), and Q1 2026 adjusted DEPS of $4.95–$5.00.
- The Board declared a quarterly cash dividend of $0.91 per share, a 10% increase over the prior quarterly dividend, payable January 16, 2026 to shareholders of record January 2, 2026.
- This marks the 33rd consecutive year Roper has increased its dividend.
- The raise corresponds to an expected $0.34 increase annually (equivalent to $0.085 quarterly) over 2025 dividend levels.
- On August 12, 2025, Roper Technologies, Inc. consummated issuance and sale of $2.0 billion aggregate principal amount of senior unsecured notes: $500 million 4.250% notes due 2028, $500 million 4.450% notes due 2030, and $1 billion 5.100% notes due 2035 under an underwriting agreement dated August 7, 2025.
- The notes were issued under Roper’s November 26, 2018 Indenture, pay interest semiannually on March 15 and September 15, and are callable prior to par call dates at Treasury yields plus 10 bps (2028 notes) or 15 bps (2030 and 2035 notes).
- The securities rank as unsecured senior obligations, senior to any subordinated debt, equal to existing and future unsecured senior debt, and are effectively subordinated to secured indebtedness and subsidiaries’ liabilities; they include a 101% change-of-control repurchase feature.
- Roper positions itself as a vertical market software and technology compounder, targeting 7–7.5% organic growth and mid-teens sustainable free cash flow compounding by combining 29 niche businesses with cross-sell and innovation levers.
- The company maintains roughly $5 billion in M&A capacity, pursuing niche leaders with disciplined valuation and an AI risk lens; recent add-ons include ProCares, Subsplash, Transact and Central Reach to bolster growth potential.
- Macro headwinds persist in Deltek’s GovCon segment and DAT’s freight marketplace, but Roper expects Deltek to benefit from increased OMB-driven defense spend and freight volumes to recover in H2, while healthcare and higher-education verticals remain resilient.
- Roper is accelerating its AI adoption and integration playbook—enhancing central PMO support, generative AI resources and post-ProCares lessons to drive continuous improvement and faster value capture across its portfolio.
- Roper Technologies priced a public offering of $500 million 4.250% Senior Notes due 2028, $500 million 4.450% Senior Notes due 2030 and $1 billion 5.100% Senior Notes due 2035.
- The notes pay interest semi-annually on March 15 and September 15, beginning March 15, 2026, and mature on September 15 of their respective years.
- Net proceeds will be used to repay borrowings under the company’s five-year unsecured credit facility, redeem outstanding 2025 notes, and fund general corporate purposes, including acquisitions.
- The offering is expected to close on August 12, 2025, subject to customary closing conditions.
Quarterly earnings call transcripts for ROPER TECHNOLOGIES.
Ask Fintool AI Agent
Get instant answers from SEC filings, earnings calls & more