RIVERVIEW BANCORP (RVSB)·Q3 2026 Earnings Summary
Riverview Bancorp Beats on EPS as NIM Expansion Drives Profitability
January 29, 2026 · by Fintool AI Agent
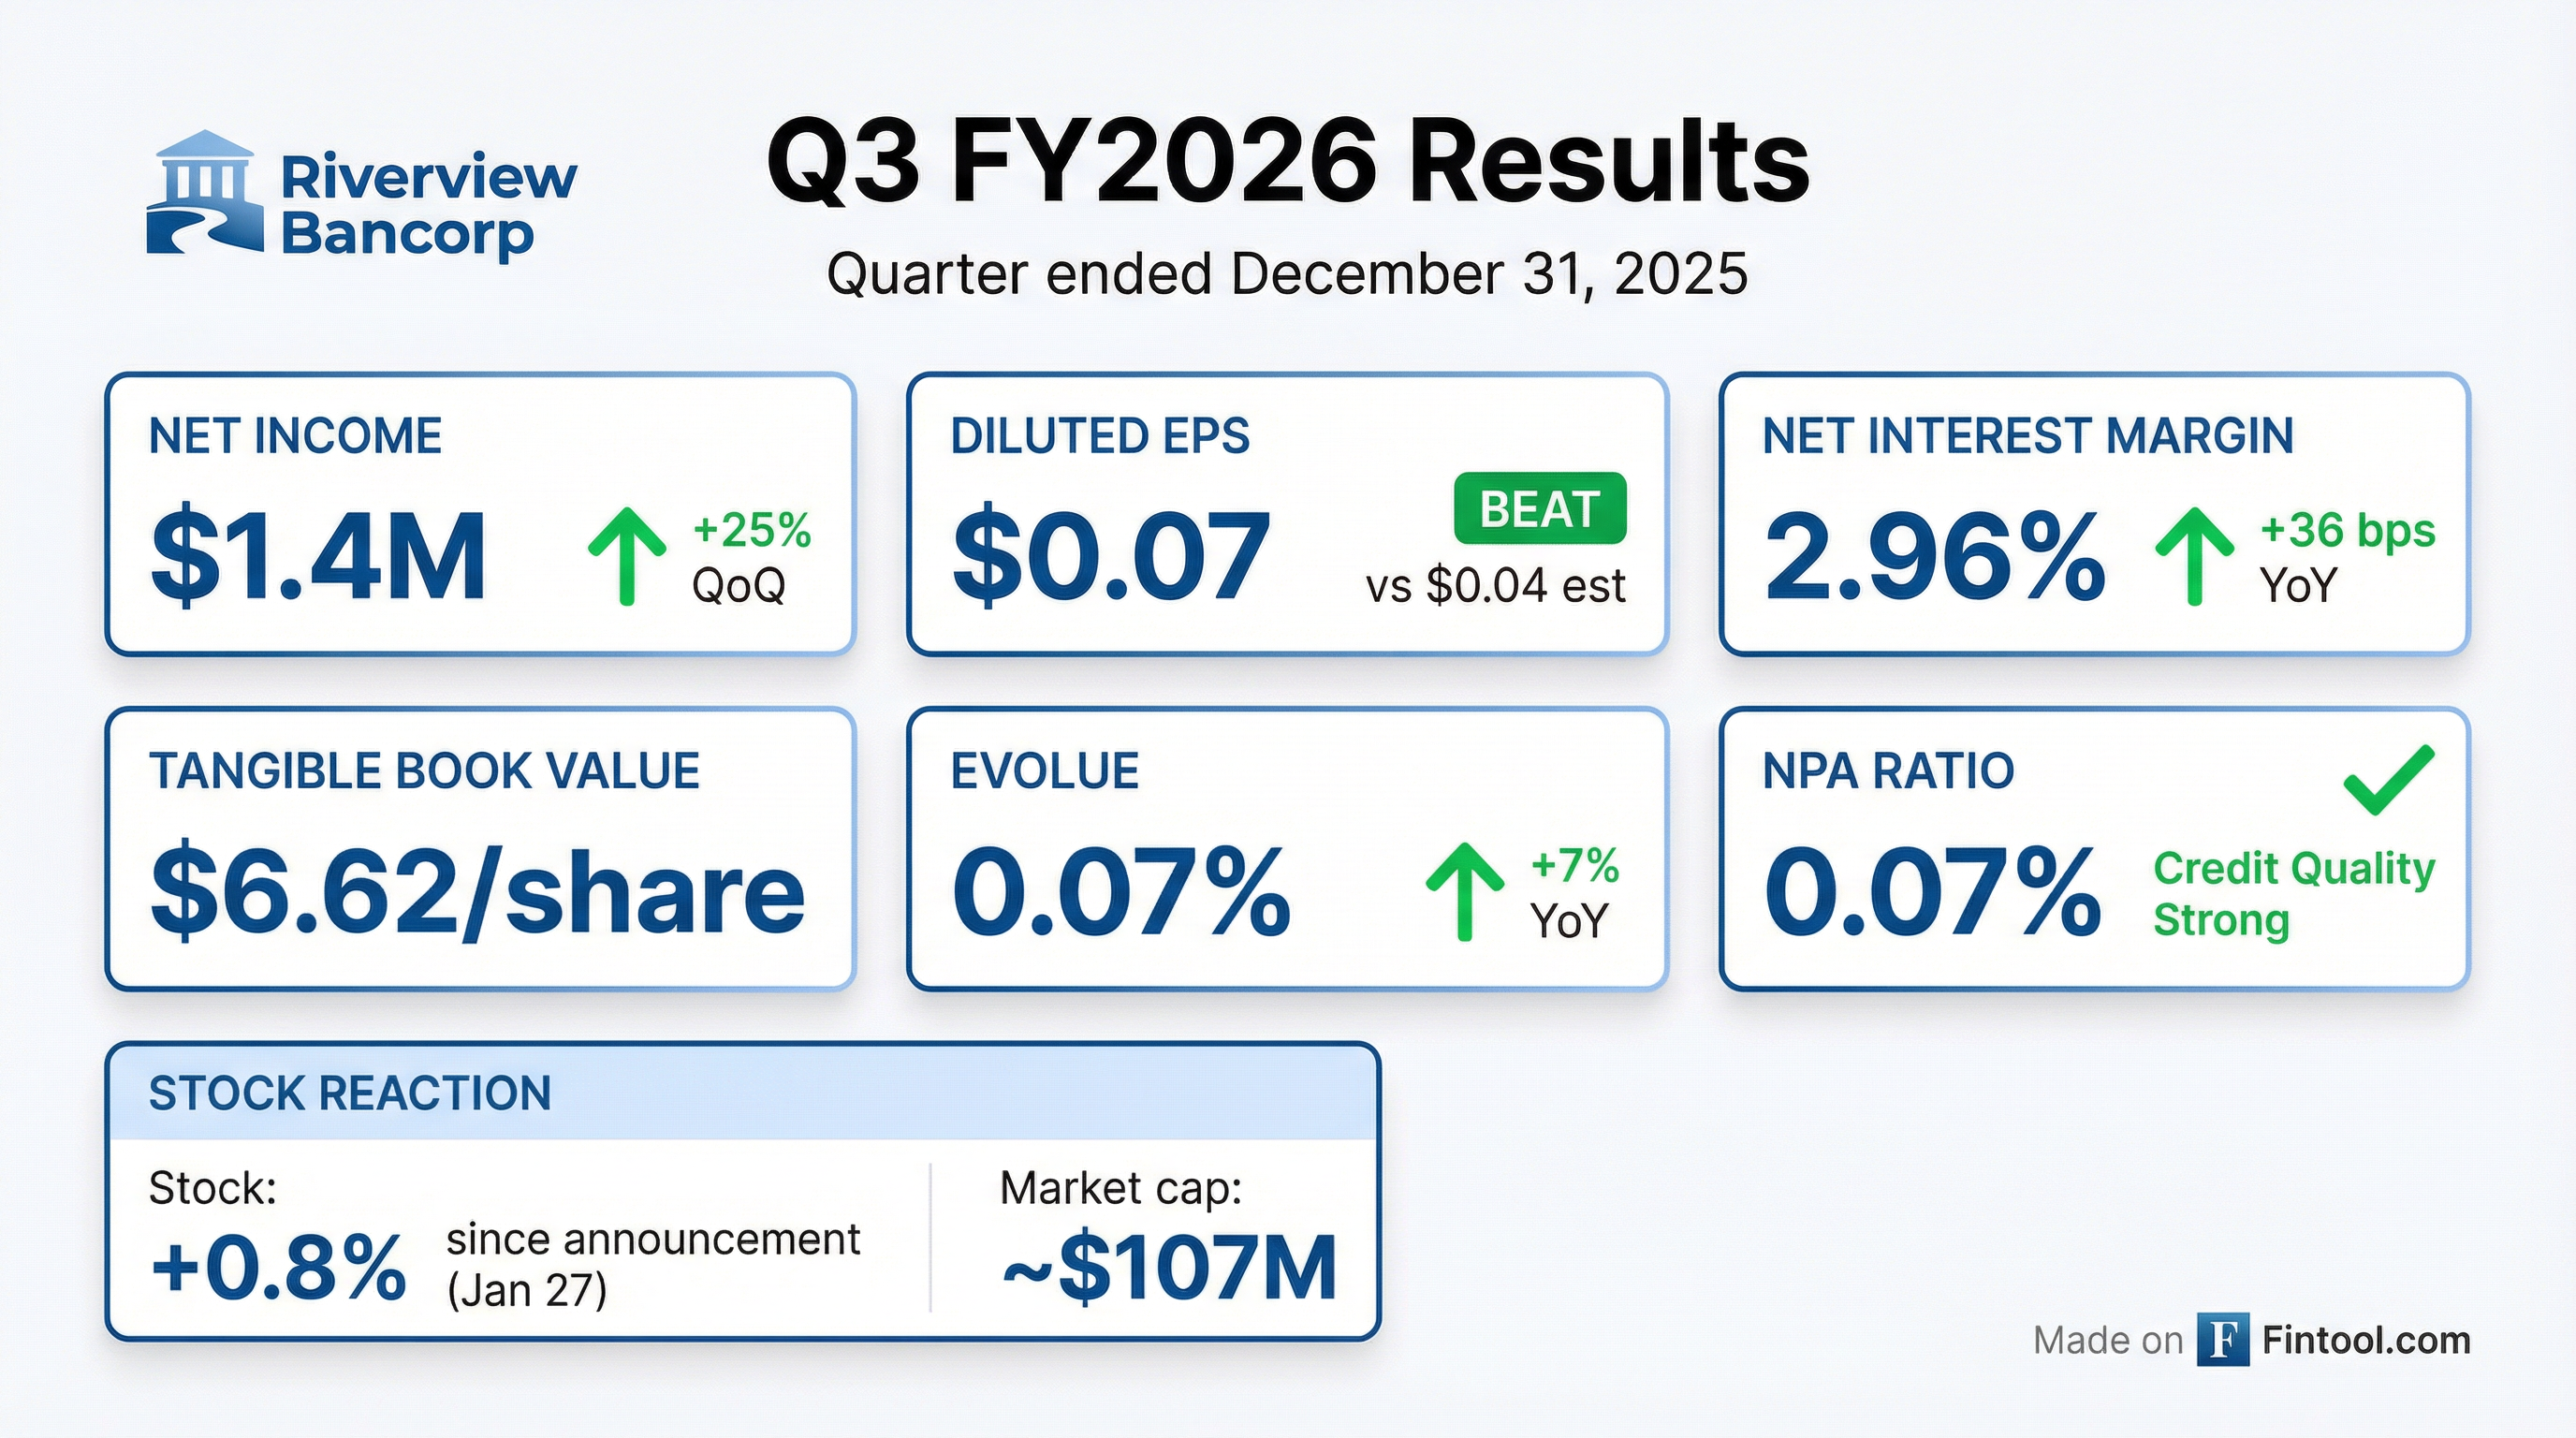
Riverview Bancorp (NASDAQ: RVSB) reported Q3 FY2026 results that exceeded expectations, posting diluted EPS of $0.07 versus consensus of $0.04—a 75% beat. Net income reached $1.4 million, up 25% from $1.1 million in the prior quarter and up 12% from $1.2 million in the year-ago quarter. The community bank headquartered in Vancouver, Washington continues to execute on its three-year strategic plan with visible progress in net interest margin expansion and loan growth.
Did Riverview Bancorp Beat Earnings?
Yes—RVSB beat on both EPS and revenue.
*Values retrieved from S&P Global
The EPS beat was driven by:
- NIM expansion: Net interest margin increased to 2.96%, up 36 bps YoY, as higher loan origination rates and repricing offset deposit cost pressures
- Loan growth: Total loans increased $40.1 million YoY to $1.07 billion
- Asset management growth: Trust Company assets under management reached $919.1 million, up 5.3% YoY
How Is the Stock Reacting?
The stock showed a modest positive reaction following the earnings announcement on January 27, 2026:
RVSB currently trades at ~$5.14 with a market cap of approximately $107 million. The stock is trading at 0.78x tangible book value ($6.62), reflecting the valuation challenges facing small-cap regional banks despite improving fundamentals.
What Changed From Last Quarter?
Improving trends across key metrics:
Key developments:
- Non-interest income declined QoQ due to absence of one-time items (employee retention tax credit, fintech referral distribution) that boosted Q2
- Total deposits decreased slightly ($2.9M) but deposit mix improved with more balances in interest-bearing checking
What Did Management Say?
CEO Nicole Sherman emphasized the strategic plan's momentum:
"Our priorities continue to center on delivering value to shareholders through stronger asset returns, new revenue streams, and optimized operations. Strategic investments in talent and technology have driven near-term expense increases, but results are already evident in our commercial and business banking segments."
CFO David Lam highlighted margin expansion despite rate cuts:
"Even with the recent rate cuts, we experienced solid NIM expansion during the quarter. We were able to drive higher asset yields and lower our cost of funds. We are focused on continuing to improve our earning asset mix and managing funding costs to grow NIM going forward."
On expenses, Lam noted:
"Operating costs increased year-over-year as we strategically expanded our business banking teams and filled key positions aligned with our growth objectives. We've offset some of these costs by bringing previously outsourced functions in-house. Though these initiatives are temporarily elevating our expense base, we anticipate costs stabilizing in the coming quarters."
How Is Credit Quality?
Credit quality remains a bright spot for Riverview:
The bank recorded a $100,000 provision for credit losses in the quarter. Classified assets increased to $13.5 million (7.4% of capital) from $10.7 million last quarter, primarily due to one lending relationship that moved to classified during Q1 FY2026 with a plan to return to performing status or payoff.
Chief Credit Officer Robert Benke noted: "In this environment of interest rate uncertainty, our priority remains the strength of our loan portfolio. We continue to take a disciplined approach—monitoring credit quality metrics, staying attuned to economic trends at both the local and national level."
What Is the Loan Pipeline?
The loan pipeline remains healthy at $77.2 million, up significantly from $49.1 million a year ago.
Chief Lending Officer Mike Sventek highlighted the loan repricing opportunity: "Loan yields expanded again this quarter as favorable yield curve movements allowed us to price new loan originations more attractively than our existing portfolio. Additionally, we continue to expand our commercial lending with our strategy of incorporating a higher proportion of C&I relationship clients."
Upcoming repricing tailwind: Loans repricing in FY2027 total $80.6 million with a weighted average rate of 4.19%, well below current origination rates of ~6.9%.
Capital & Liquidity Position
Riverview maintains strong capital levels well above "well-capitalized" thresholds:
Liquidity: Available liquidity of $515.5 million, covering 164% of estimated uninsured deposits (25.5% of total deposits).
Shareholder returns: Paid quarterly dividend of $0.02 per share on January 16, 2026. Completed $2.0 million stock repurchase plan on November 17, 2025.
Historical Earnings Trend
The turnaround from Q4 FY2024's loss reflects successful execution of the strategic plan, with consistent profitability and expanding NIM over the past seven quarters.
Forward Catalysts
Potential positives:
- Continued NIM expansion from loan repricing ($80.6M at 4.19% repricing in FY2027 vs current 6.9% origination rates)
- Strong loan pipeline supporting growth
- Expense stabilization as strategic investments mature
- Vancouver, WA market ranked #3 most popular city to move to, supporting regional growth
Potential risks:
- Classified assets trending higher (7.4% of capital)
- Office building exposure ($108.4M) in Portland market (~1.9% of total loans in Portland core)
- Interest rate uncertainty impacting deposit pricing
- Small market cap (~$107M) limits institutional interest
Source Documents: RVSB Q3 FY2026 8-K