SAIA (SAIA)·Q4 2025 Earnings Summary
Saia Q4 2025: Revenue Beats, EPS Misses on Insurance Costs
February 10, 2026 · by Fintool AI Agent
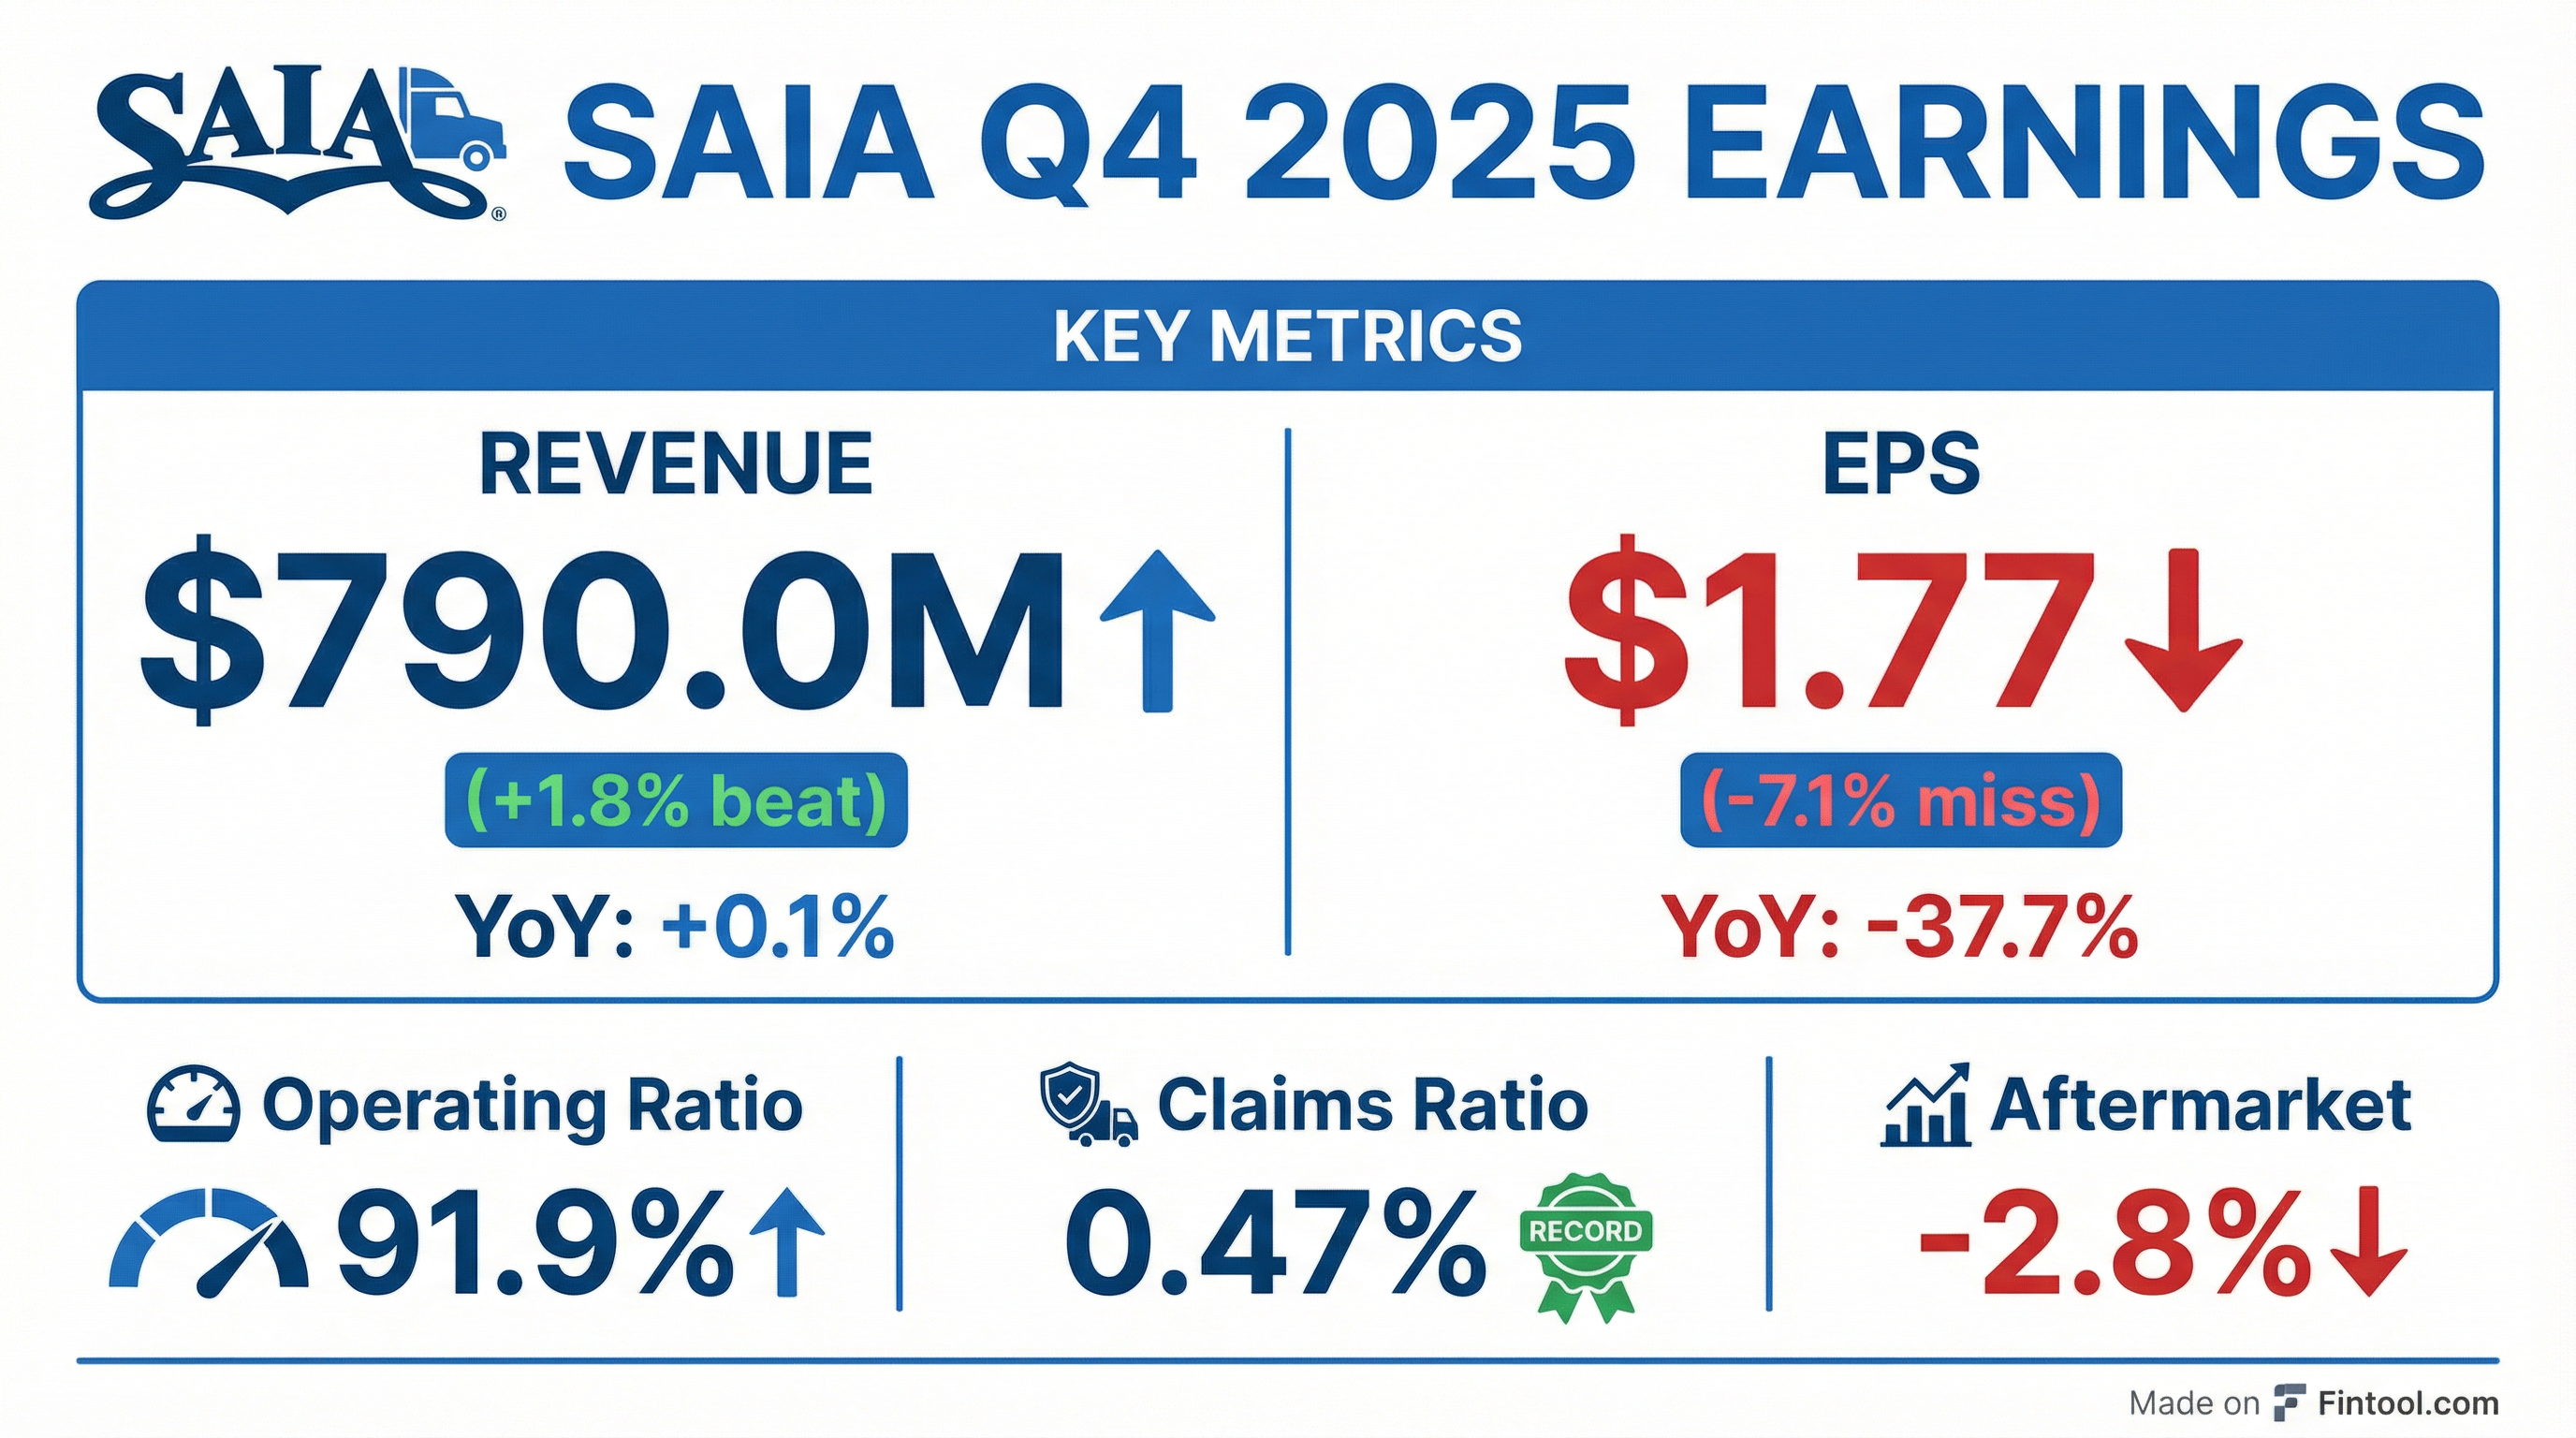
Saia Inc. (NASDAQ: SAIA) reported Q4 2025 results that beat revenue estimates but missed on earnings, as elevated self-insurance costs overshadowed operational progress. Revenue came in at $790.0 million (+1.8% vs consensus), while EPS of $1.77 missed expectations by 7.1%. The stock fell 2.8% in aftermarket trading.
Did Saia Beat Earnings?
Mixed results: Revenue beat, EPS missed.
The revenue beat reflects continued traction in ramping markets from Saia's national network expansion. However, the EPS miss was driven primarily by approximately $4.7 million in elevated self-insurance costs related to adverse developments on accidents from prior years.
Management noted that excluding these unexpected costs, "the performance in the quarter reflected our team's strong commitment to customer service and disciplined execution despite a dynamic operating environment."
How Did the Stock React?
Saia shares fell 2.8% in aftermarket trading to $398.00, down from the $409.60 regular session close. The stock had rallied ~20% over the prior month heading into earnings.
What Changed From Last Quarter?
Operating ratio deteriorated: Q4 2025's 91.9% operating ratio compares unfavorably to 87.1% a year ago and 85.9% in Q3 2025.
Key drivers of margin compression:
- Elevated self-insurance costs: ~$4.7M from adverse claim developments
- Higher depreciation: $62.9M vs $54.1M YoY from network investments
- Increased salaries/benefits: $398.5M vs $375.8M YoY
Bright spot: Claims ratio hit a company record of 0.47%, demonstrating operational quality improvements.
Full Year 2025 Results
FY 2025 marked Saia's first full year with a national footprint following aggressive network expansion.
*Adjusted excludes $14.5M net gain from real estate transactions in Q3 2025
LTL Operating Statistics
Saia continues to operate 213 terminals with national service coverage.
What Did Management Say?
CEO Fritz Holzgrefe highlighted the insurance impact while expressing optimism about strategic progress:
"Results from our core business operations were in line with our expectations for the quarter. However, the quarter was impacted by unexpected adverse developments late in the quarter related to accidents that occurred in prior years, driving approximately $4.7 million in elevated self-insurance related costs."
"Our team's commitment to the customer was evidenced by our claims ratio of 0.47%, which was a record for any quarter in our company's history."
CFO Matt Batteh emphasized the strategic positioning:
"We continue to see growth in our ramping markets, with both new and existing customers, driven by our ability to provide more solutions to meet customer expectations. Our record level of capital investments over the past three years have transformed our network and given us the ability to solve problems for more customers."
"Having now completed our first full year with a national footprint, we are even more excited about the opportunity ahead of us."
Capital Allocation & Balance Sheet
Financial position improved with debt reduction during the quarter:
2026 Capex Guidance: $350-400 million, down significantly from:
- 2025: $544.1M
- 2024: $1,040.9M
The reduced capex signals completion of the major network buildout phase, with management noting the investment is "subject to ongoing evaluation of market conditions."
What's Priced In?
Valuation context: SAIA trades at approximately 23x forward EPS based on FY 2026 consensus of $10.79.
*Values retrieved from S&P Global
Key debates for investors:
- Margin recovery timing: When will operating ratio return to mid-80s levels?
- Network leverage: Can ramping terminals reach legacy market profitability?
- Macro sensitivity: How much will economic conditions impact LTL demand?
Forward Catalysts
Historical EPS Performance
*Values retrieved from S&P Global
Key Takeaways
- Revenue beat (+1.8%) driven by network expansion traction, but EPS missed (-7.1%) due to insurance costs
- Operating ratio of 91.9% deteriorated 480 bps YoY, though insurance costs explain ~60 bps
- Record claims ratio of 0.47% demonstrates operational quality improvements
- Capex declining to $350-400M signals network buildout substantially complete
- First full year of national operations complete; focus shifting to profitability leverage
- Balance sheet strengthened with debt reduced to $164M from $200M YoY
Data sourced from Saia Inc. Form 8-K filed February 10, 2026 and S&P Global Capital IQ.