Sally Beauty Holdings (SBH)·Q1 2026 Earnings Summary
Sally Beauty Beats Q1 Estimates but Stock Drops 9% on Flat Comps
February 9, 2026 · by Fintool AI Agent
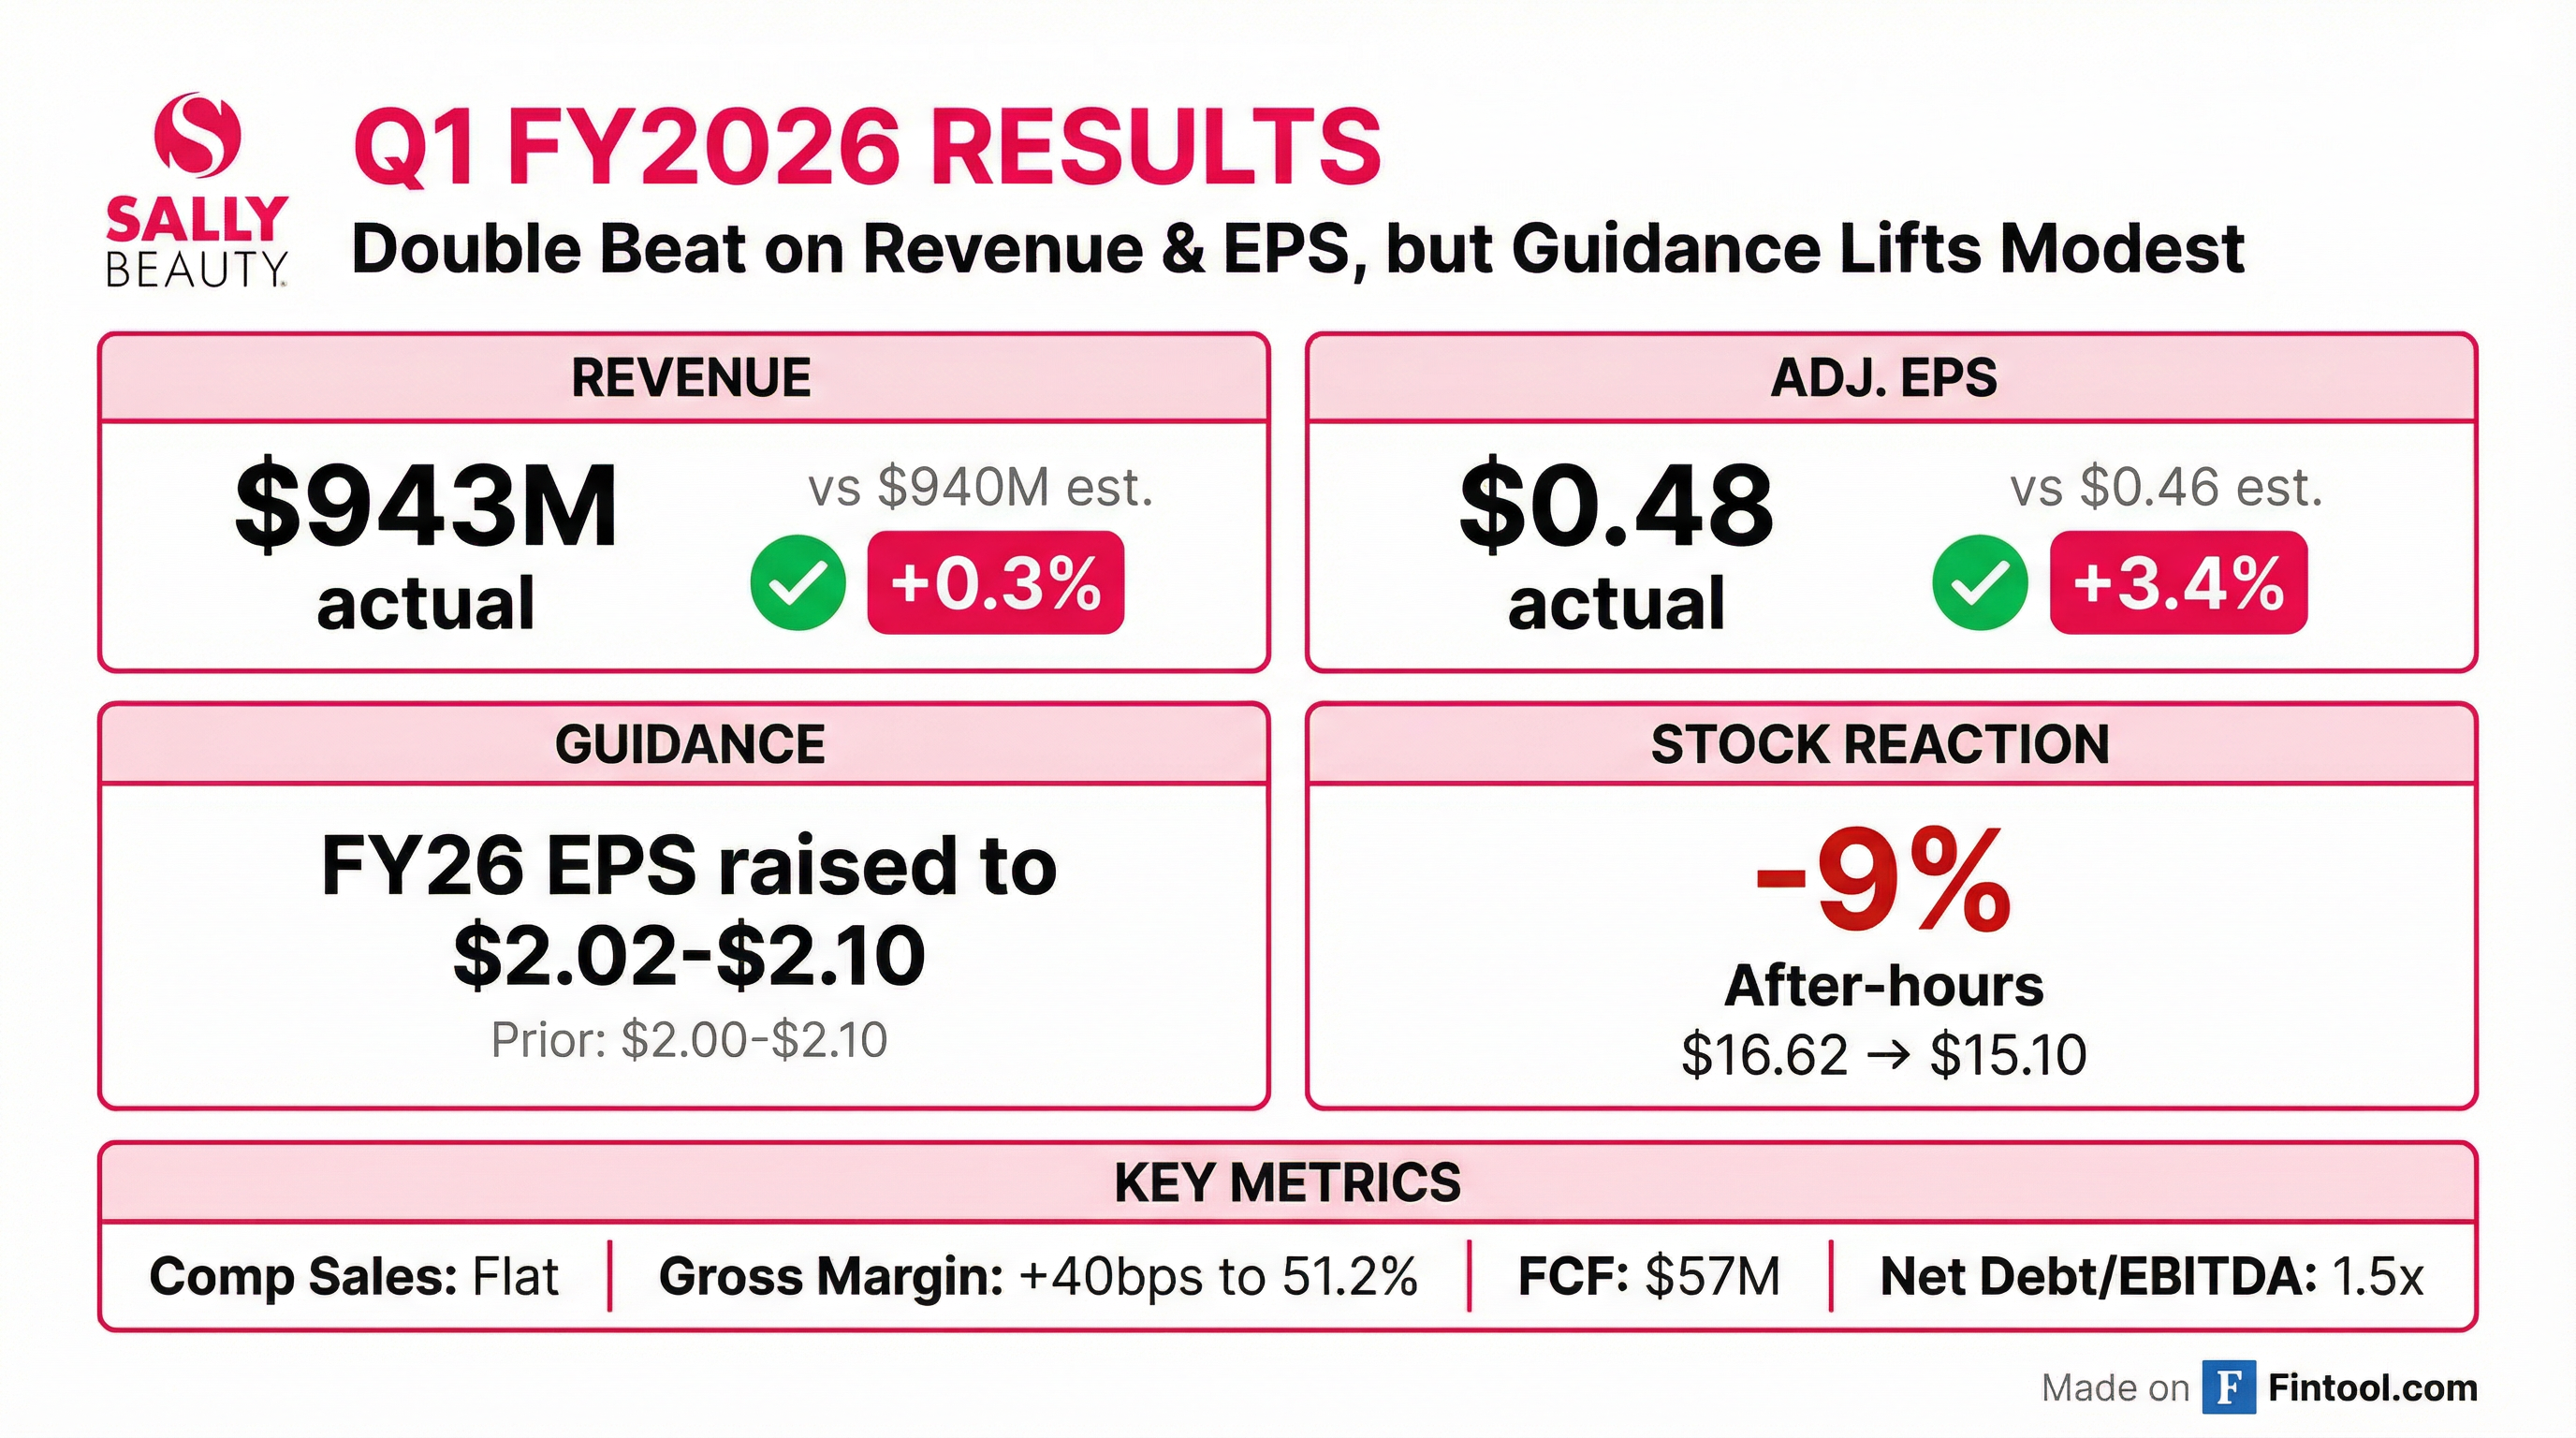
Sally Beauty Holdings (NYSE: SBH) delivered a double beat in Q1 FY2026, posting adjusted EPS of $0.48 (+12% YoY) and revenue of $943 million (+0.6% YoY). Despite the solid results, shares initially tumbled ~9% in after-hours trading before recovering, as investors digested flat comparable sales and only marginal guidance improvements. Management attributed some softness to government shutdowns that disrupted consumer spending during the quarter, but noted performance strengthened in December as conditions normalized.
Did Sally Beauty Beat Earnings?
Yes — SBH beat on both revenue and EPS.
*Consensus estimates from S&P Global
The adjusted EPS beat marks SBH's sixth consecutive quarter of meeting or beating estimates. However, the +12% YoY adjusted EPS growth was entirely driven by margin expansion and share buybacks rather than top-line acceleration — comparable sales were flat versus +1.6% in the year-ago quarter.
CEO Denise Paulonis characterized the results positively: "Our first quarter financial performance marks a strong start to fiscal year 2026. We achieved top-line results and adjusted operating income at the high end of our expectations and adjusted diluted earnings per share above our guidance range."
Key Category Highlights:
- Color was the standout performer at +8% YoY growth, with color customer count up 3% fueled by performance marketing and the Licensed Colorist on Demand (LCOD) platform
- E-commerce grew 20% at Sally and 4% at BSG, with marketplaces driving strong Black Friday/Cyber Monday performance
- Care category declined 6% as customers remained selective in discretionary spending
How Did the Stock React?
Shares initially dropped ~9% after hours but have since recovered.
The initial negative reaction reflected investor concerns about:
- Flat comps — 0.0% comparable sales growth vs. +1.6% in Q1 FY2025 represents a 160 basis point deceleration
- Minimal guidance raise — Only the low end of EPS guidance moved up by $0.02
- Government shutdown headwinds — Macro volatility disrupted consumer spending during the quarter
However, the recovery likely reflects:
- Strong beat on bottom line (+12% YoY adj. EPS)
- Color category momentum (+8% growth)
- Sally Ignited KPIs showing customer acquisition gains
- Healthy balance sheet (1.5x net leverage)
What Did Management Guide?
Modest guidance raise: low end of FY26 EPS lifted by $0.02.
Q2 FY2026 Outlook:
Management noted Q2 is expected to be "our strongest comp sales quarter of fiscal 2026" given the soft comparison to Q2 last year. The sequential EPS deceleration reflects normalized SG&A patterns — Q2 last year benefited from unusually favorable FX and timing shifts that have since reversed.
What Changed From Last Quarter?
Comp sales decelerated sharply; margins expanded.
Key observations:
- Operating margin expansion driven by normalized SG&A (prior quarter included HQ relocation costs)
- E-commerce represented 11.7% of net sales ($111M)
- Inventory down 2.7% YoY, reflecting improved working capital management
Segment Performance
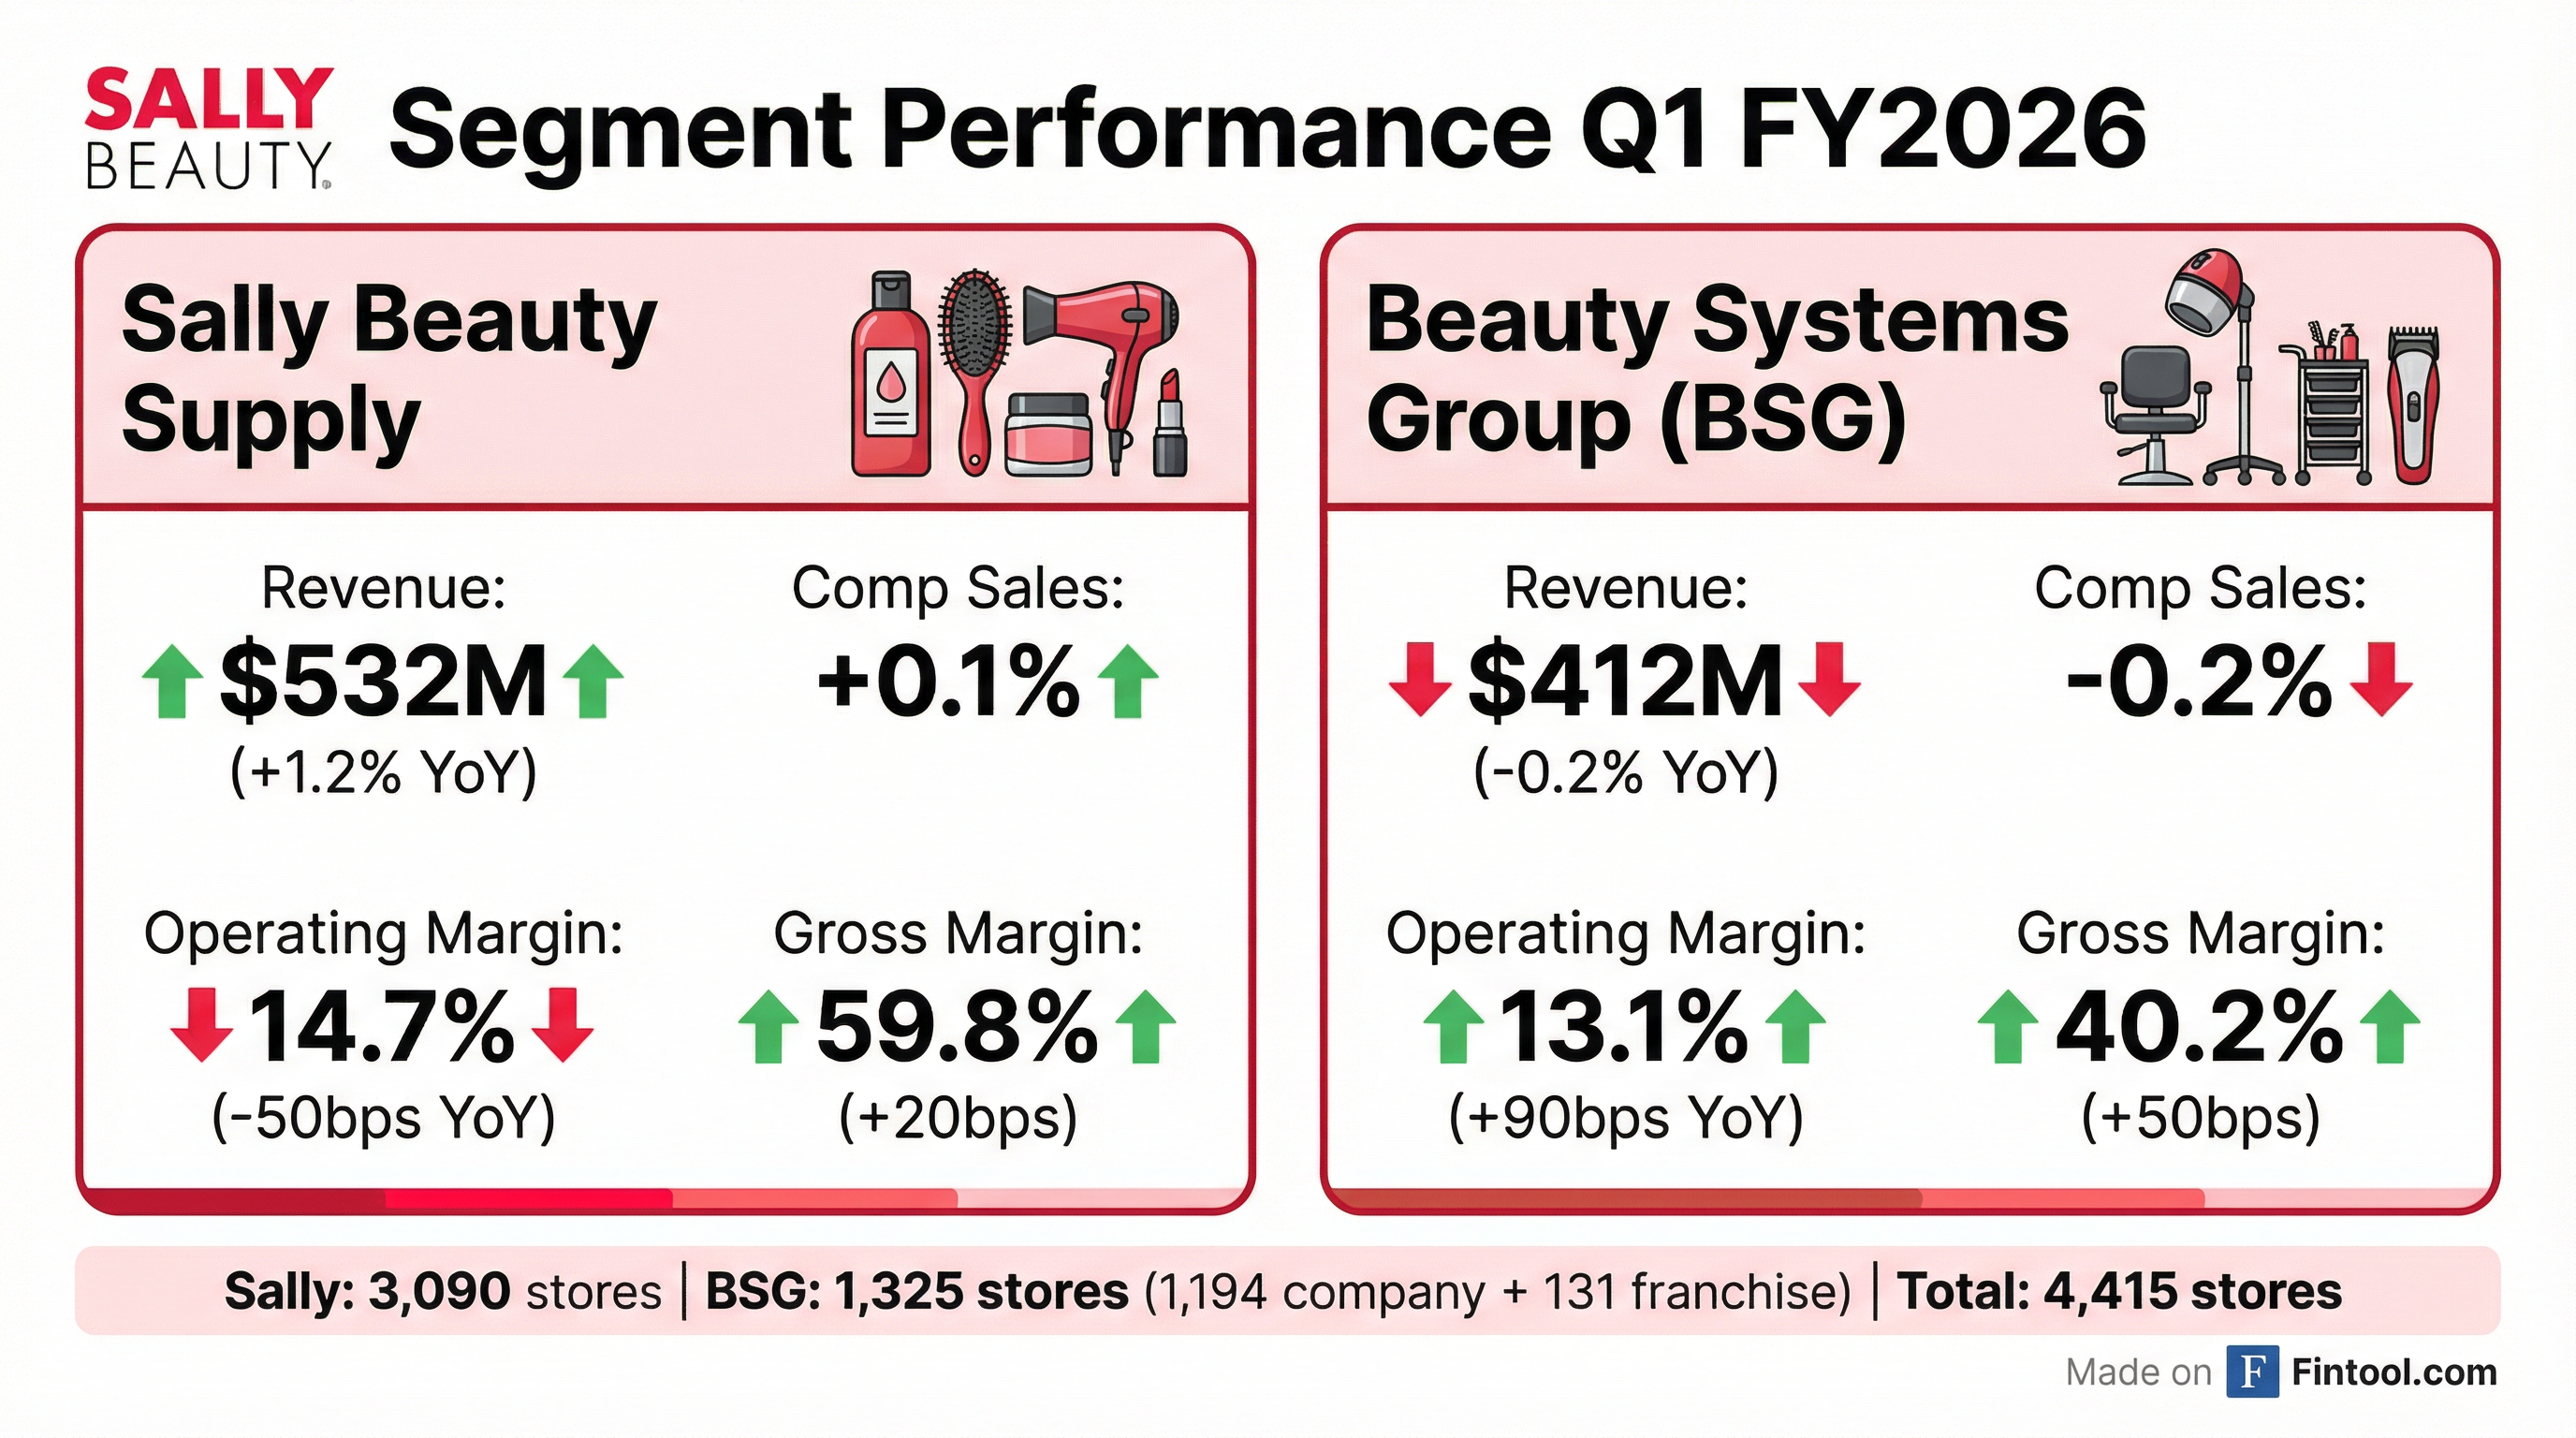
Sally Beauty Supply
Key drivers: Color category +8%, e-commerce sales of $50M representing 9% of segment revenue, fragrance launch gaining traction. Note: Management exited substantially all lower-margin full-service operations in Europe during the quarter.
Beauty Systems Group (BSG)
Key drivers: Color category +4%, e-commerce sales of $60M representing 15% of segment revenue. Stylists continue to buy closer to need and seek value. Management noted "while stylist appointment books were relatively busy, their customers were more cautious in their spending, with some pullback in add-on services."
Capital Allocation
$93M operating cash flow deployed to debt paydown and buybacks.
Balance Sheet (as of Dec 31, 2025):
- Cash: $157M
- Inventory: $979M (down 3% YoY)
- No borrowings on ABL revolver
Management reiterated plans to allocate 50% of free cash flow to share repurchases, with the balance going toward debt reduction and strategic investments. Full year FY26 guidance assumes 50% of FCF goes to buybacks.
Strategic Initiatives Update
Sally Ignited Store Refresh
The Sally Ignited program encompasses physical and digital refreshes, category expansion, and immersive experiences. Key Q1 updates:
KPIs in Ignited Stores:
- Mid-to-high single digit increase in new and reactivated customers
- UPT and ATV trending above rest of fleet
- Larger-format stores with expanded skincare/cosmetics showing even stronger basket growth
Licensed Colorist on Demand (LCOD)
LCOD continues to drive strong economics as a customer acquisition tool:
Fuel for Growth Program
New Category & Brand Expansion
- Fragrance: Launched in top 1,000 Sally stores in November; expanding to 2,000 stores in Q2
- Skin & Spa (BSG): Testing IMAGE and Matter of Fact brands in 250 stores
- New BSG Brands: milk_shake (225 stores) and Keratin Complex (525 stores) launched in early Q2
- Happy Beauty: E-commerce site launching later in FY2026
Q&A Highlights
On Customer Trends (Oliver Chen, TD Cowen):
"On the Sally side of the house, Sally customer was resilient, really responded well to initiatives like LCOD, marketplaces, innovation... Where we are seeing that customer be a bit more choiceful is in discretionary categories like styling tools."
On Fragrance Opportunity:
"How high is high? I don't think we know yet. We're certainly navigating and testing our way through that." — CEO on fragrance category potential
On Q2 Comp Guidance Upside (Sydney Wagner, Jefferies):
"We hope that there could be a little help from tax refunds... these new categories that we're playing in, whether that be skin and spa on the BSG side or fragrance and the early steps into skincare and cosmetics, could be a little bit of upside."
On SG&A Timing (Olivia Tong, Raymond James): Management explained the Q2 SG&A step-up reflects normalization: Q2 last year benefited from unusually favorable FX impacts that have reversed, plus timing shifts in incentive comp, advertising, and IT as they managed through sales headwinds.
On Category Growth (Sydney Wagner, Jefferies):
"Where we are seeing really nice strength is in color... The care front, care has been a tougher category. We had that factored in coming into the year." Management noted serums and treatments performing well while traditional shampoo/conditioner softer.
On Salon Trends:
"The most interesting trend right now is really around the glassing and super straight look. So any product that is aimed at helping that straightening and very clean line look is what customers are looking for."
Key Risks & Watch Items
- Traffic trends — Flat comps suggest consumer demand for professional hair color products may be softening; monitor Q2 for signs of acceleration
- Government shutdown sensitivity — Management noted disruption from shutdowns impacted Q1 results
- Care category weakness — Shampoo/conditioner continues to underperform while serums/treatments hold up
- Competitive pressure — Ulta Beauty and mass retailers continue to expand professional beauty offerings
Forward Catalysts
Bottom Line
Sally Beauty delivered a solid Q1 beat on both revenue (+0.3%) and adjusted EPS (+3.4%), driven by gross margin expansion, Fuel for Growth benefits ($14M in Q1), and disciplined capital allocation. While flat comparable sales initially disappointed investors, several bright spots emerged from the quarter: color category momentum (+8%), strong e-commerce growth (+20% at Sally), and encouraging early KPIs from the Sally Ignited store refresh program. Management's commentary suggests macro headwinds from government shutdowns weighed on results, but trends improved in December.
The company's strategic positioning — healthy balance sheet (1.5x leverage), expanding category participation (fragrance, skin/spa), and digital investments — provides a runway for growth. With Q2 guided as the strongest comp quarter and management targeting $120M cumulative Fuel for Growth savings by fiscal year-end, the setup appears constructive. The key question remains whether Sally can translate its category expansion and customer acquisition initiatives into sustained positive comps.
Related Research: