Solaris Energy Infrastructure (SEI)·Q4 2025 Earnings Summary
Solaris Energy Crushes Q4 on AI Data Center Demand, Stock Surges 6%
February 25, 2026 · by Fintool AI Agent
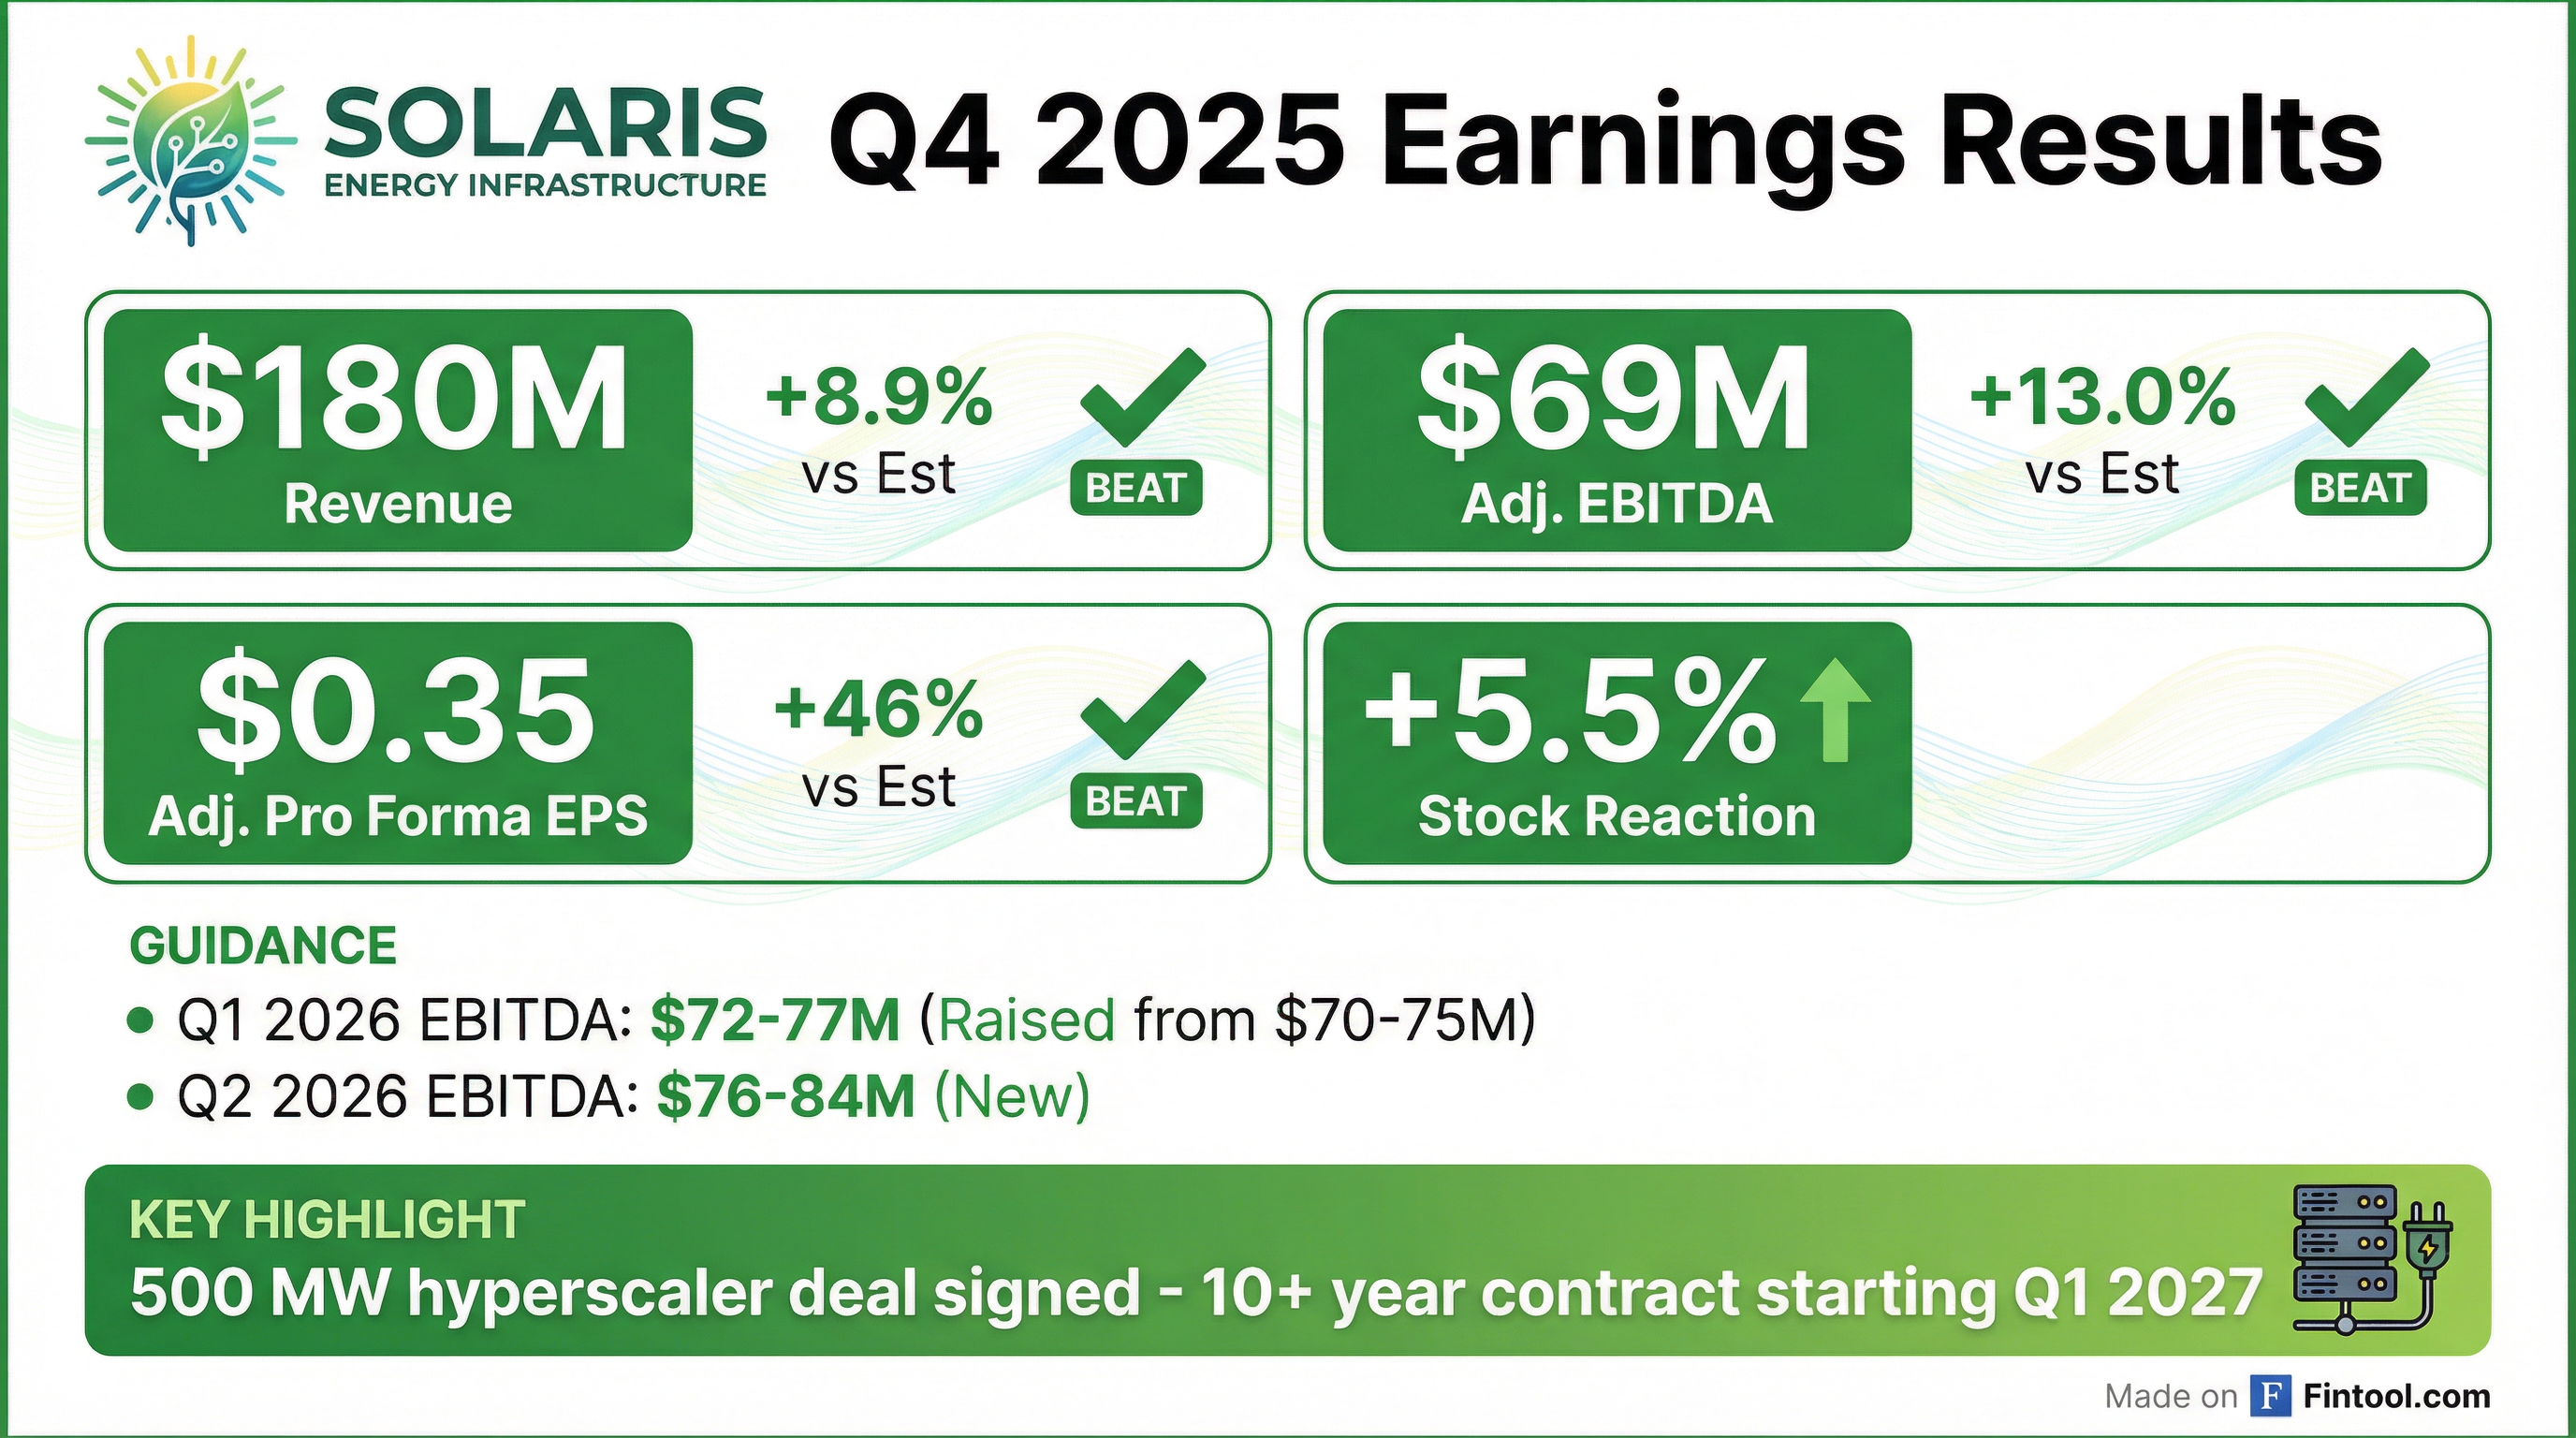
Solaris Energy Infrastructure (NYSE: SEI) delivered a blowout Q4 2025, beating revenue estimates by nearly 9% and adjusted EPS by 46% as AI data center power demand accelerated. The stock surged 5.5% on the news, with shares closing at $53.46.
Did Solaris Energy Beat Earnings?
Solaris significantly exceeded Wall Street expectations across all key metrics:
The GAAP net loss of $(3.5M) was driven by a one-time $41.5M loss on debt extinguishment related to paying off the company's term loan following convertible notes issuance.
Full Year 2025 Performance:
- Revenue growth: +99% YoY
- Adjusted EBITDA growth: +137% YoY
- Adjusted Pro Forma Net Income: +278% YoY
What Did Management Guide?
Solaris raised near-term guidance and established a strong outlook for 2026:
Q1 2026 guidance was raised from prior $70-75M to $72-77M.
What's the Hyperscaler Deal?
The biggest news was a new 500+ MW power supply contract with a Tier-1 hyperscaler:
Contract Tenor Evolution: Solaris has dramatically extended its average contract length over time:
- 1H 2024: <1 year
- 2H 2024: 2-4 years
- 2025: 5-6 years
- Current Average: 7-8 years
- Leading Edge: 10-15 years
Potential PPA Scope Expansion includes balance of plant, batteries, facilities, O&M, engineering, and site preparation.
Solaris Value Proposition:
- Critical "behind-the-meter" infrastructure independent of grid availability
- Durable cash flow visibility with long-term contract tenor
- Skilled in managing complex AI loads and multiple voltage requirements
How Did Each Segment Perform?
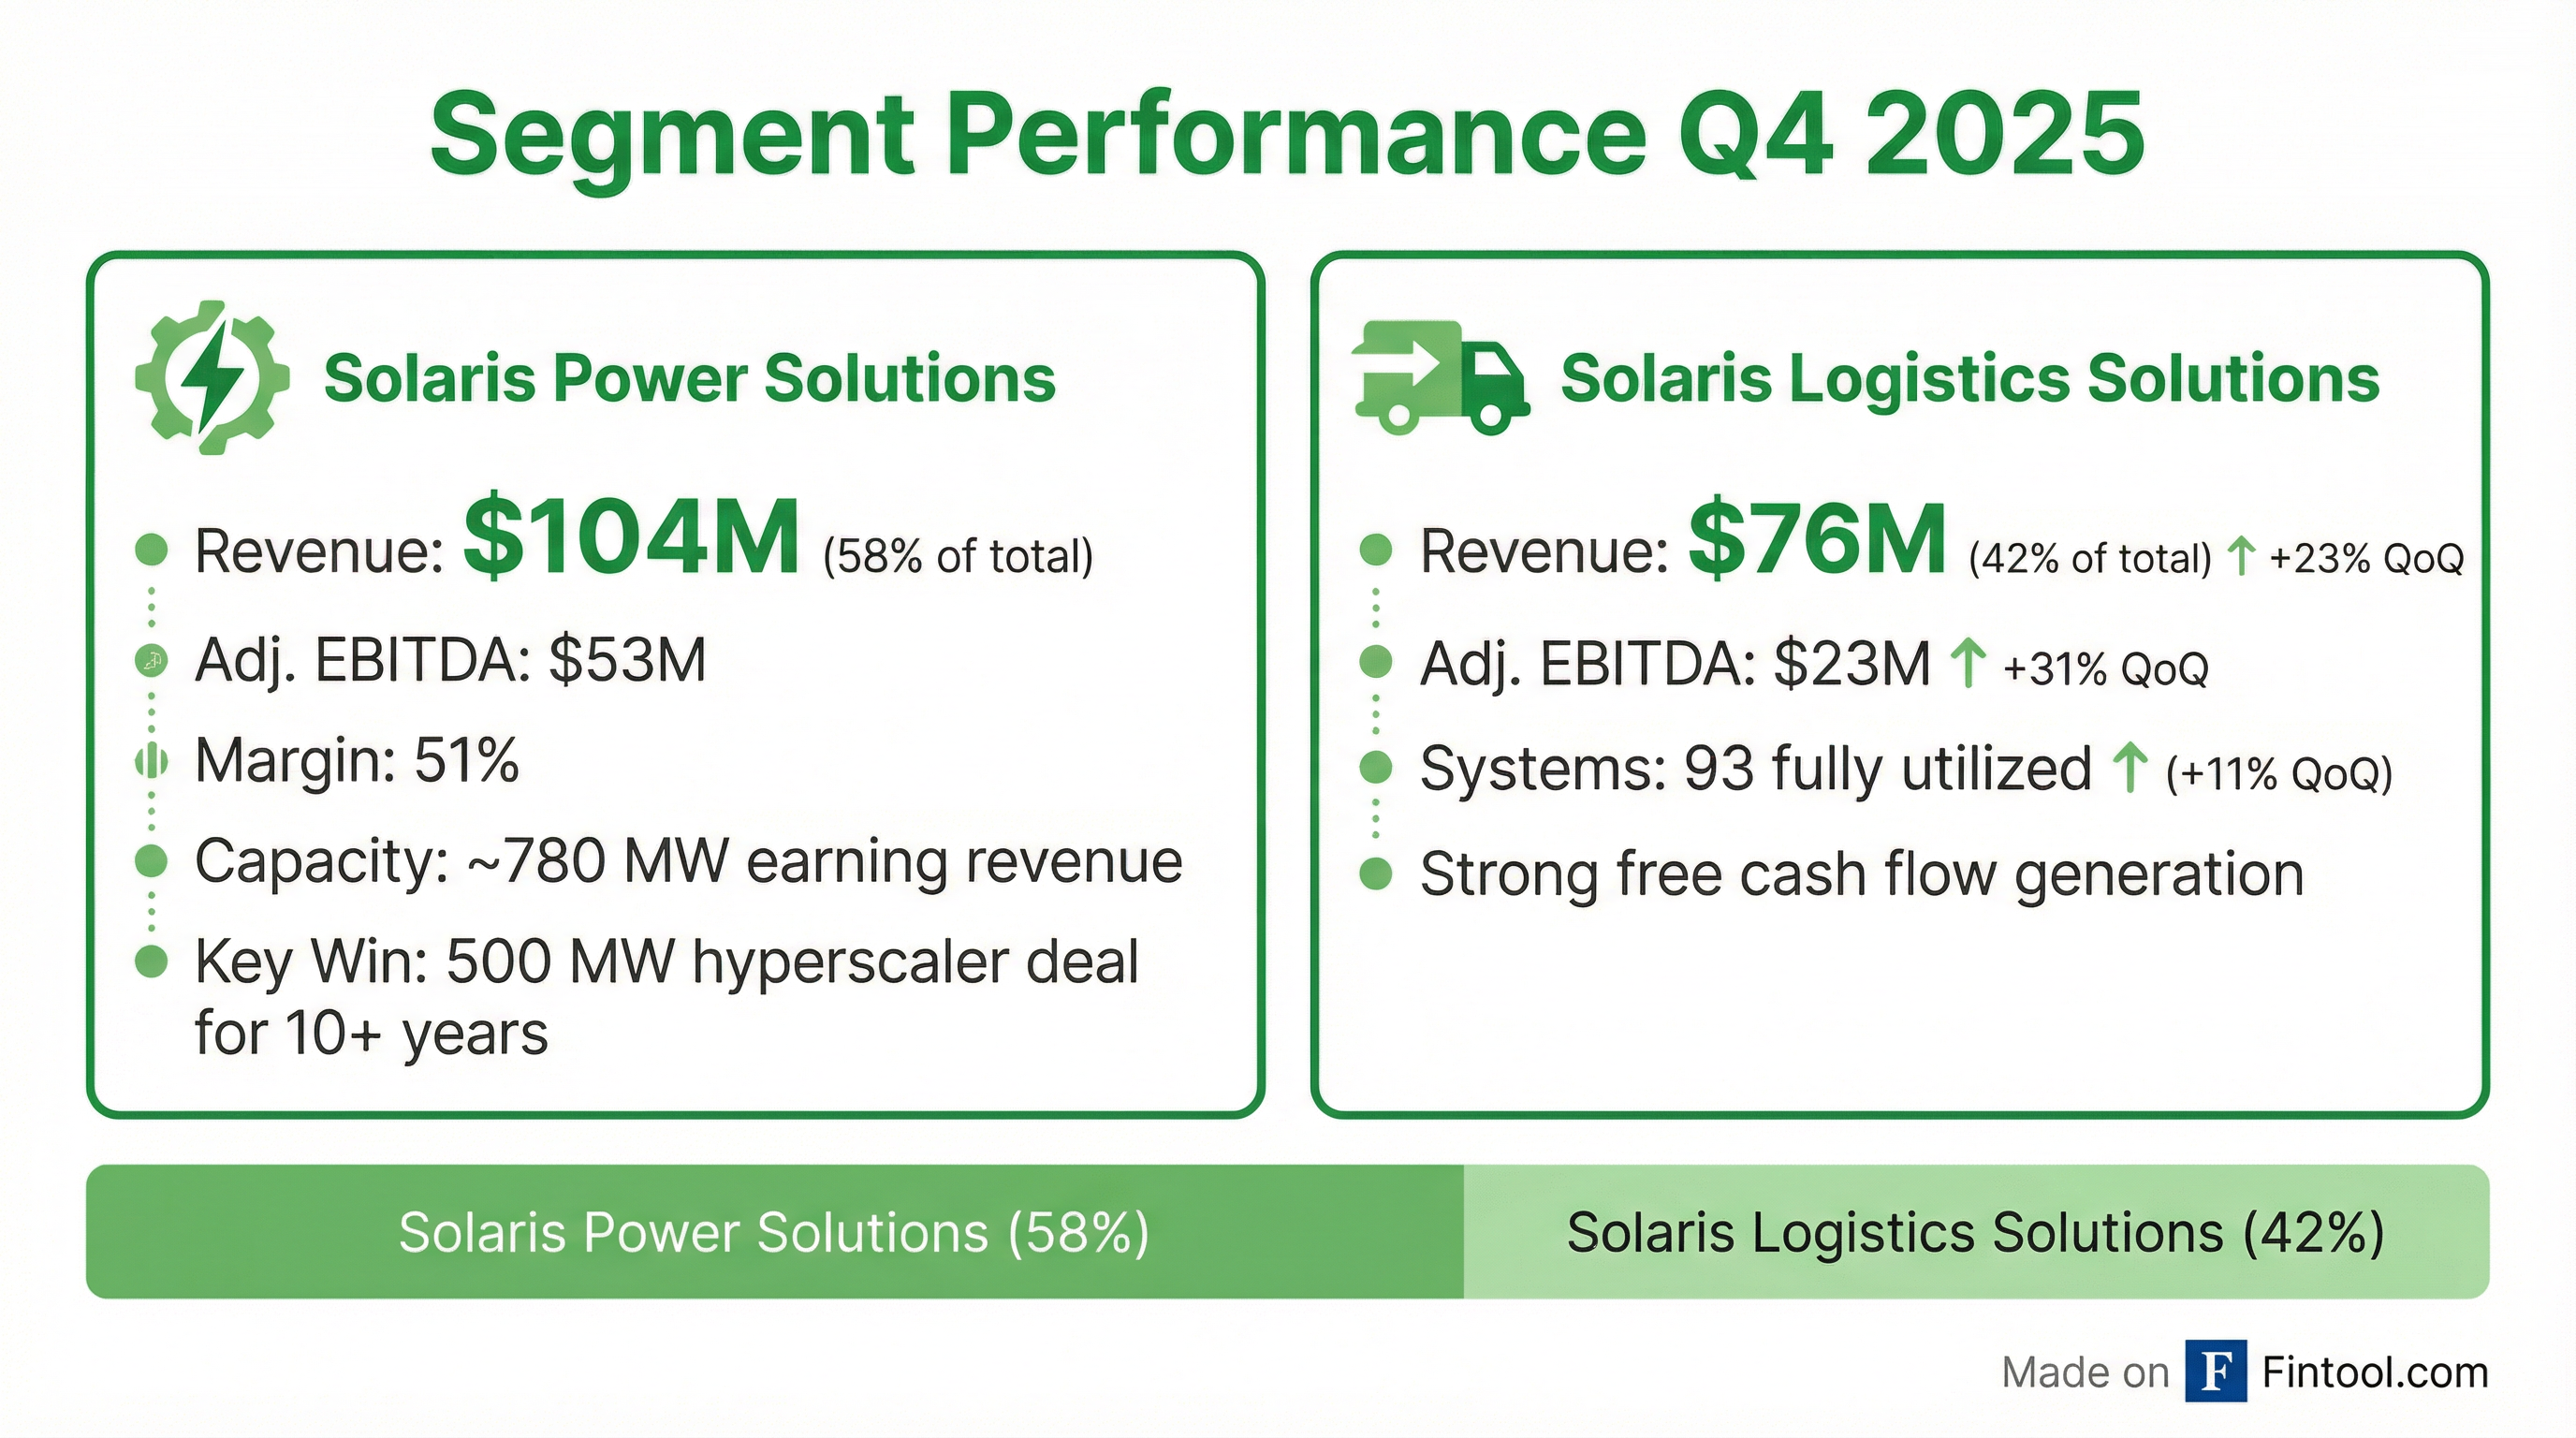
Solaris Power Solutions
Key highlights:
- 125% year-over-year Adjusted EBITDA growth in Q4 2025
- Power contributed ~60% of Q4 revenue and 70% of segment-level EBITDA
- Power expected to be dominant segment going forward as fleet deploys for data center contracts
Solaris Logistics Solutions
Key highlights:
- Logistics Revenue and Adj. EBITDA improved over 20% YoY in Q4 2025
- Strong full-year growth reflects acquisitions and oilfield activity rebound
How Did the Stock React?
SEI shares surged on the earnings beat:
The stock has nearly quadrupled from its 52-week low, reflecting the market's recognition of Solaris's pivot to AI data center infrastructure.
What About the Balance Sheet?
Solaris completed a significant capital structure transformation in Q4:
The debt structure reflects a successful refinancing:
- New 0.25% Convertible Notes: $748M issuance with $57.20 conversion price and capped call up to $88/share
- Term Loan B Retirement: Freed up secured borrowing capacity; resulted in $41.5M extinguishment loss
- Fully Funded Capex: Current planned expenditures through 2028 are now fully funded
What's the Capital Plan?
Solaris provided detailed capex guidance through full fleet deployment:
The Stateline JV capex is funded by a debt financing facility of up to $550M (80% LTV).
What About Shareholder Returns?
Solaris declared its 30th consecutive quarterly dividend: $0.12 per share payable March 20, 2026 to holders of record March 10, 2026.
What Changed From Last Quarter?
Key narrative shift: Solaris is evolving from short-term rentals to long-term infrastructure partnerships. The 10-15 year contract tenor and path to turnkey PPA demonstrate maturation into a durable infrastructure business with predictable cash flows.
What's the Pro Forma Earnings Potential?
Solaris outlined the path to full fleet deployment at 2,200 MW operated by early 2028:
At full deployment, this implies:
- ~180% EBITDA growth from current run rate
- Net Debt/EBITDA improving from ~3.6x to ~1.8-2.0x
- Significant operating leverage as MW capacity more than doubles
The difference between consolidated and net-to-SEI reflects the 49.9% non-controlling interest in the ~900 MW Stateline JV.
What Are the Catalysts Ahead?
- Stateline JV Ramp: 900 MW AI data center project with unnamed partner
- 500 MW Hyperscaler: Revenue contribution begins January 2027
- Path to Turnkey PPA: Framework to convert rental into long-term Power Purchase Agreement
- Additional Contracts: Management noted discussions for capacity "significantly surpassing current open availability"
- Earnings Call: February 25, 2026 at 8:00 AM CT
Key Takeaways
- Beat: Revenue +8.9%, Adj. EBITDA +13.0%, Adj. EPS +45.8% vs. consensus
- Guidance Raised: Q1 2026 EBITDA to $72-77M (from $70-75M); Q2 2026 established at $76-84M
- Major Win: 500+ MW hyperscaler deal for 10-15 years starting January 2027
- Pro Forma Potential: $575-625M Net EBITDA at 2,200 MW full deployment
- Fully Funded: Capital plan through 2028 fully funded via convertible notes
- Stock: +5.5% to $53.46
- Dividend: 30th consecutive quarter, $0.12/share
GAAP Reconciliation
Conference call: February 25, 2026 at 8:00 AM CT.
Related Research: