Sila Realty Trust (SILA)·Q4 2025 Earnings Summary
Sila Realty Trust Q4 2025: FFO Beats as Healthcare REIT Continues Acquisition Momentum
February 24, 2026 · by Fintool AI Agent
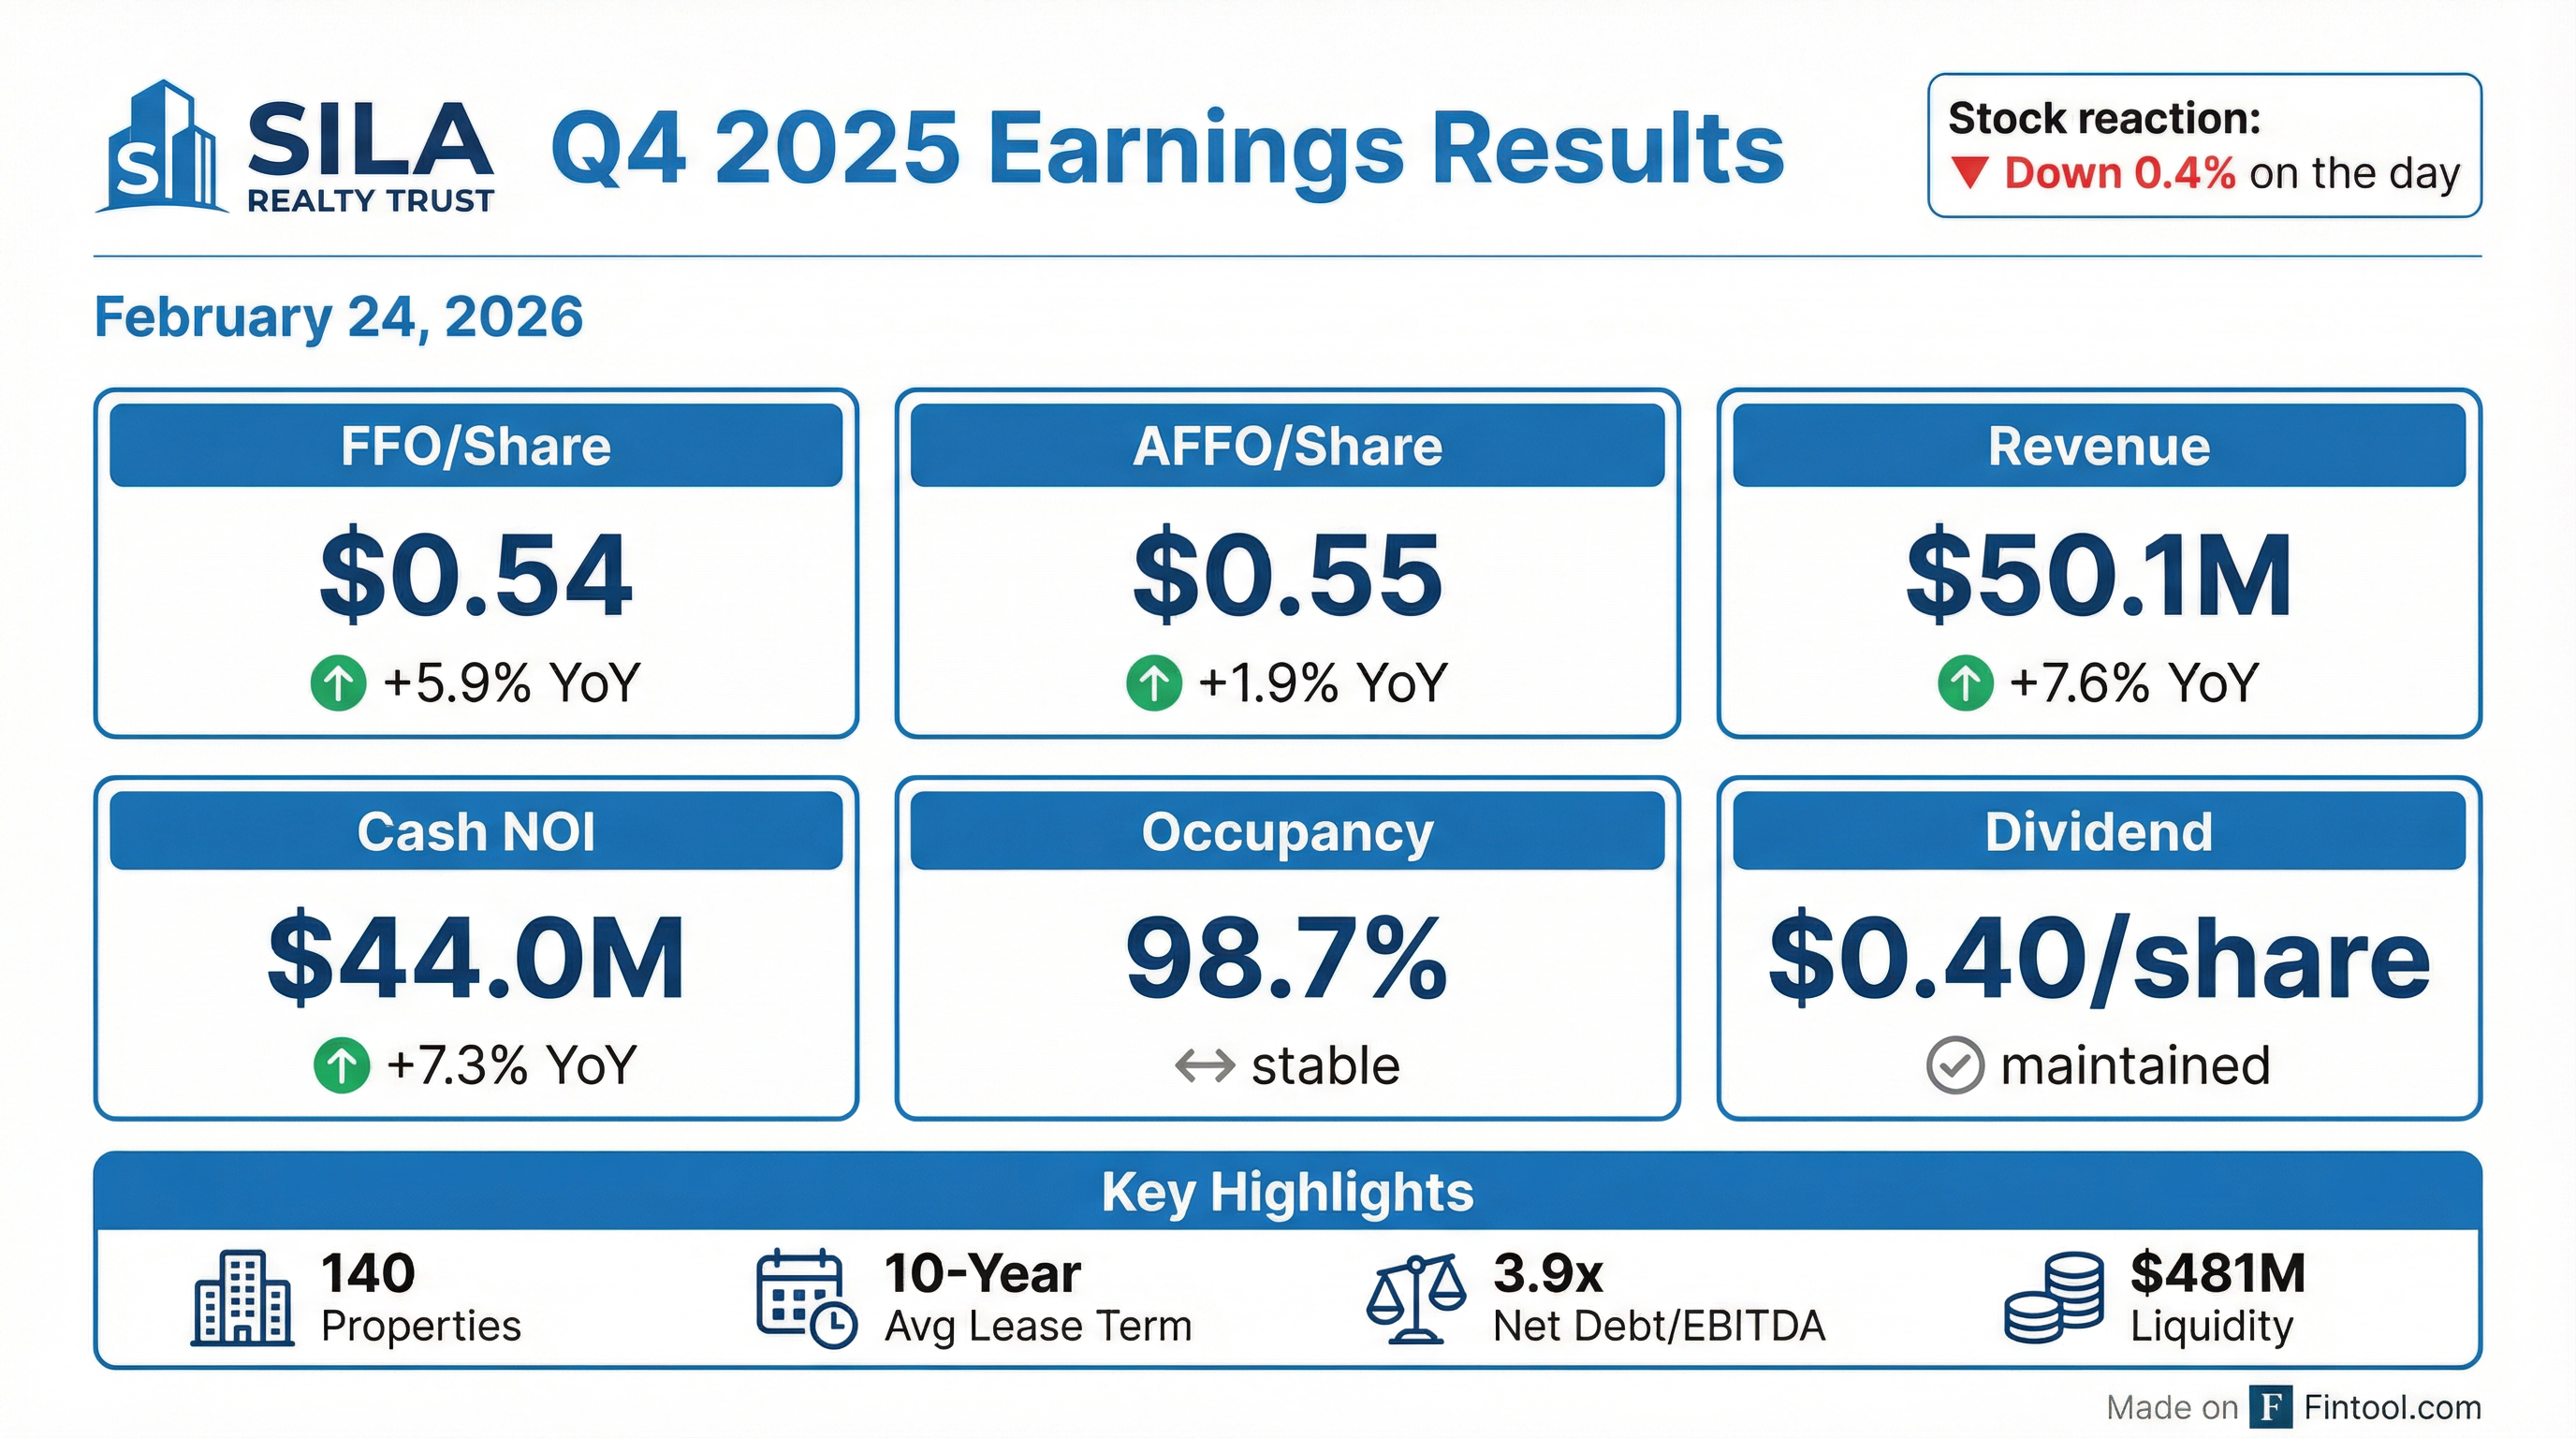
Sila Realty Trust (NYSE: SILA) delivered solid fourth quarter results, with FFO per share of $0.54 (up 5.9% YoY) and rental revenue of $50.1M (up 7.6% YoY). The healthcare-focused net lease REIT beat revenue consensus by 0.7% while maintaining strong portfolio metrics including 98.7% occupancy and a 10-year weighted average lease term.
The company maintained its quarterly dividend at $0.40/share and highlighted nearly $500M of liquidity for future acquisitions.
Did Sila Realty Trust Beat Earnings?
Yes — SILA beat revenue expectations and grew core operating metrics year-over-year.
The net income decline was driven by $3.2M in impairment and disposition losses plus $0.9M in demolition costs related to the Stoughton Healthcare Facility (taken out of service following the Steward bankruptcy). These are non-cash charges that don't affect FFO, the primary earnings metric for REITs.
Revenue beat consensus by +0.7%: Actual rental revenue of $50.1M vs. analyst expectations of $49.7M.*
Same-store Cash NOI grew 0.7% sequentially and 0.9% year-over-year across 132 comparable properties.
How Did the Stock React?
SILA shares traded down 0.4% on the earnings release day, closing at $25.51. The muted reaction suggests results were largely in-line with expectations, with no major surprises.
Stock Performance Context:
- Current Price: $25.51 (-0.4% on day)
- 52-Week Range: $21.94 - $27.50
- Market Cap: $1.41B
- Dividend Yield: 6.3% (at $1.60 annualized)
The stock is trading roughly mid-range for the year, up 9.4% from the 52-week low but 7.2% below the high.
What Did Management Say?
CEO Michael Seton highlighted the company's capital allocation prowess:
"The Sila team's prowess in allocating capital was on full display in 2025. We successfully acquired six high quality healthcare properties for approximately $149 million, all of which play a critical role in the social infrastructure of their respective patient communities."
On the balance sheet and growth outlook:
"Our liquidity of almost $500 million and low net debt to annualized EBITDAre ratio of 3.9x position Sila to take advantage of high quality opportunities as they may arise, while remaining thoughtful and disciplined in our approach to investing in necessity based healthcare real estate."
Management emphasized the sustainability and predictability of income streams, citing high EBITDARM rent coverage ratios and the portfolio's 10-year weighted average remaining lease term.
What Changed From Last Quarter?
Key changes:
- Occupancy dipped 0.4pp due to a 15,600 sq ft lease expiration at the Alexandria Healthcare Facility in Louisiana
- Lease term extended from 9.7 to 10.0 years — likely due to favorable renewals and new acquisitions with long-term leases
- Two redevelopment projects placed in service in Q4: a 44,746 sq ft inpatient rehab in San Antonio and a 12,163 sq ft medical outpatient building in El Segundo
Full Year 2025 Results
The AFFO decline was primarily due to 2024 including $4.1M in lease termination income (one-time) and a $2M GenesisCare severance fee that didn't recur in 2025. Stripping out these items, underlying performance improved.
2025 Acquisition Activity: The company acquired 6 properties totaling ~241,000 square feet for $148.9M:
Portfolio Deep Dive
Property Diversification (by Annualized Base Rent):
- Medical Outpatient Buildings: 35.3%
- Inpatient Rehabilitation Facilities: 34.8%
- Surgical and Specialty Facilities: 29.9%
Top 10 Tenants (% of ABR):
Credit Quality:
- Investment Grade Rated: 26.3%
- Affiliate Rated: 40.6%
- Non-Rated: 33.1%
EBITDARM Coverage Ratio: 5.9x for reporting properties (75.6% of portfolio) — indicating strong tenant health.
Balance Sheet & Liquidity
Debt Structure:
- 77.7% fixed through interest rate swaps at 4.6% weighted average rate
- 22.3% variable ($151M revolving line at ~4.9%)
- Total weighted average interest rate: 4.7%
Leverage increased in 2025 to fund acquisitions but remains conservative at 3.9x Net Debt/EBITDAre. The company has $449M of undrawn credit facility capacity.
Dividend & Capital Returns
The Board authorized the next quarterly dividend of $0.40/share payable March 18, 2026 to shareholders of record March 6, 2026.
With a 72.6% AFFO payout ratio, the dividend is well-covered with room for modest increases if FFO continues growing.
Subsequent Events
Post-quarter activity:
- January 15, 2026: Acquired an inpatient rehabilitation facility in Oklahoma City for $43.1M
- January 29, 2026: Sold the Saginaw Healthcare Facility for $14.5M (net proceeds $14.3M after transaction costs)
This continues the portfolio optimization strategy — selling smaller/older assets while acquiring larger, mission-critical healthcare facilities in growth markets.
Key Risks & Concerns
- Tenant Concentration: PAM Health at 15.3% of ABR represents meaningful single-tenant risk
- Rising Leverage: Net Debt/EBITDAre rose from 3.3x to 3.9x YoY, and interest coverage declined from 6.4x to 4.3x
- Steward Exposure: The Stoughton facility is being demolished following tenant bankruptcy, though only $83K of rent was received from bankruptcy proceedings
- Non-Rated Tenants: 33.1% of ABR comes from non-rated tenants, creating credit visibility challenges
Forward Outlook
Management did not provide explicit 2026 guidance but signaled continued acquisition activity given the nearly $500M liquidity position and favorable healthcare real estate fundamentals.
Key catalysts to watch:
- Deployment of ~$450M in dry powder for acquisitions
- Lease-up of the vacant Alexandria property
- Interest rate environment impact on acquisition cap rates
- Additional portfolio optimization (dispositions)
Conference Call: February 25, 2026 at 11:00 AM ET — Webcast Link
Summary
Sila Realty Trust delivered a solid Q4 2025 with FFO beating prior year by 5.9% and revenue exceeding consensus. The healthcare REIT's 140-property portfolio remains healthy with 98.7% occupancy, 10-year average lease terms, and 5.9x EBITDARM coverage. While leverage has increased to fund $149M in 2025 acquisitions, the 3.9x Net Debt/EBITDAre ratio and $481M liquidity position provide ample flexibility. The 6.3% dividend yield with 73% coverage makes SILA an attractive income vehicle for healthcare real estate exposure.
Values retrieved from S&P Global
Related Links: