StoneX Group (SNEX)·Q1 2026 Earnings Summary
StoneX Crushes Records: EPS Surges 48%, Announces Stock Split
February 5, 2026 · by Fintool AI Agent
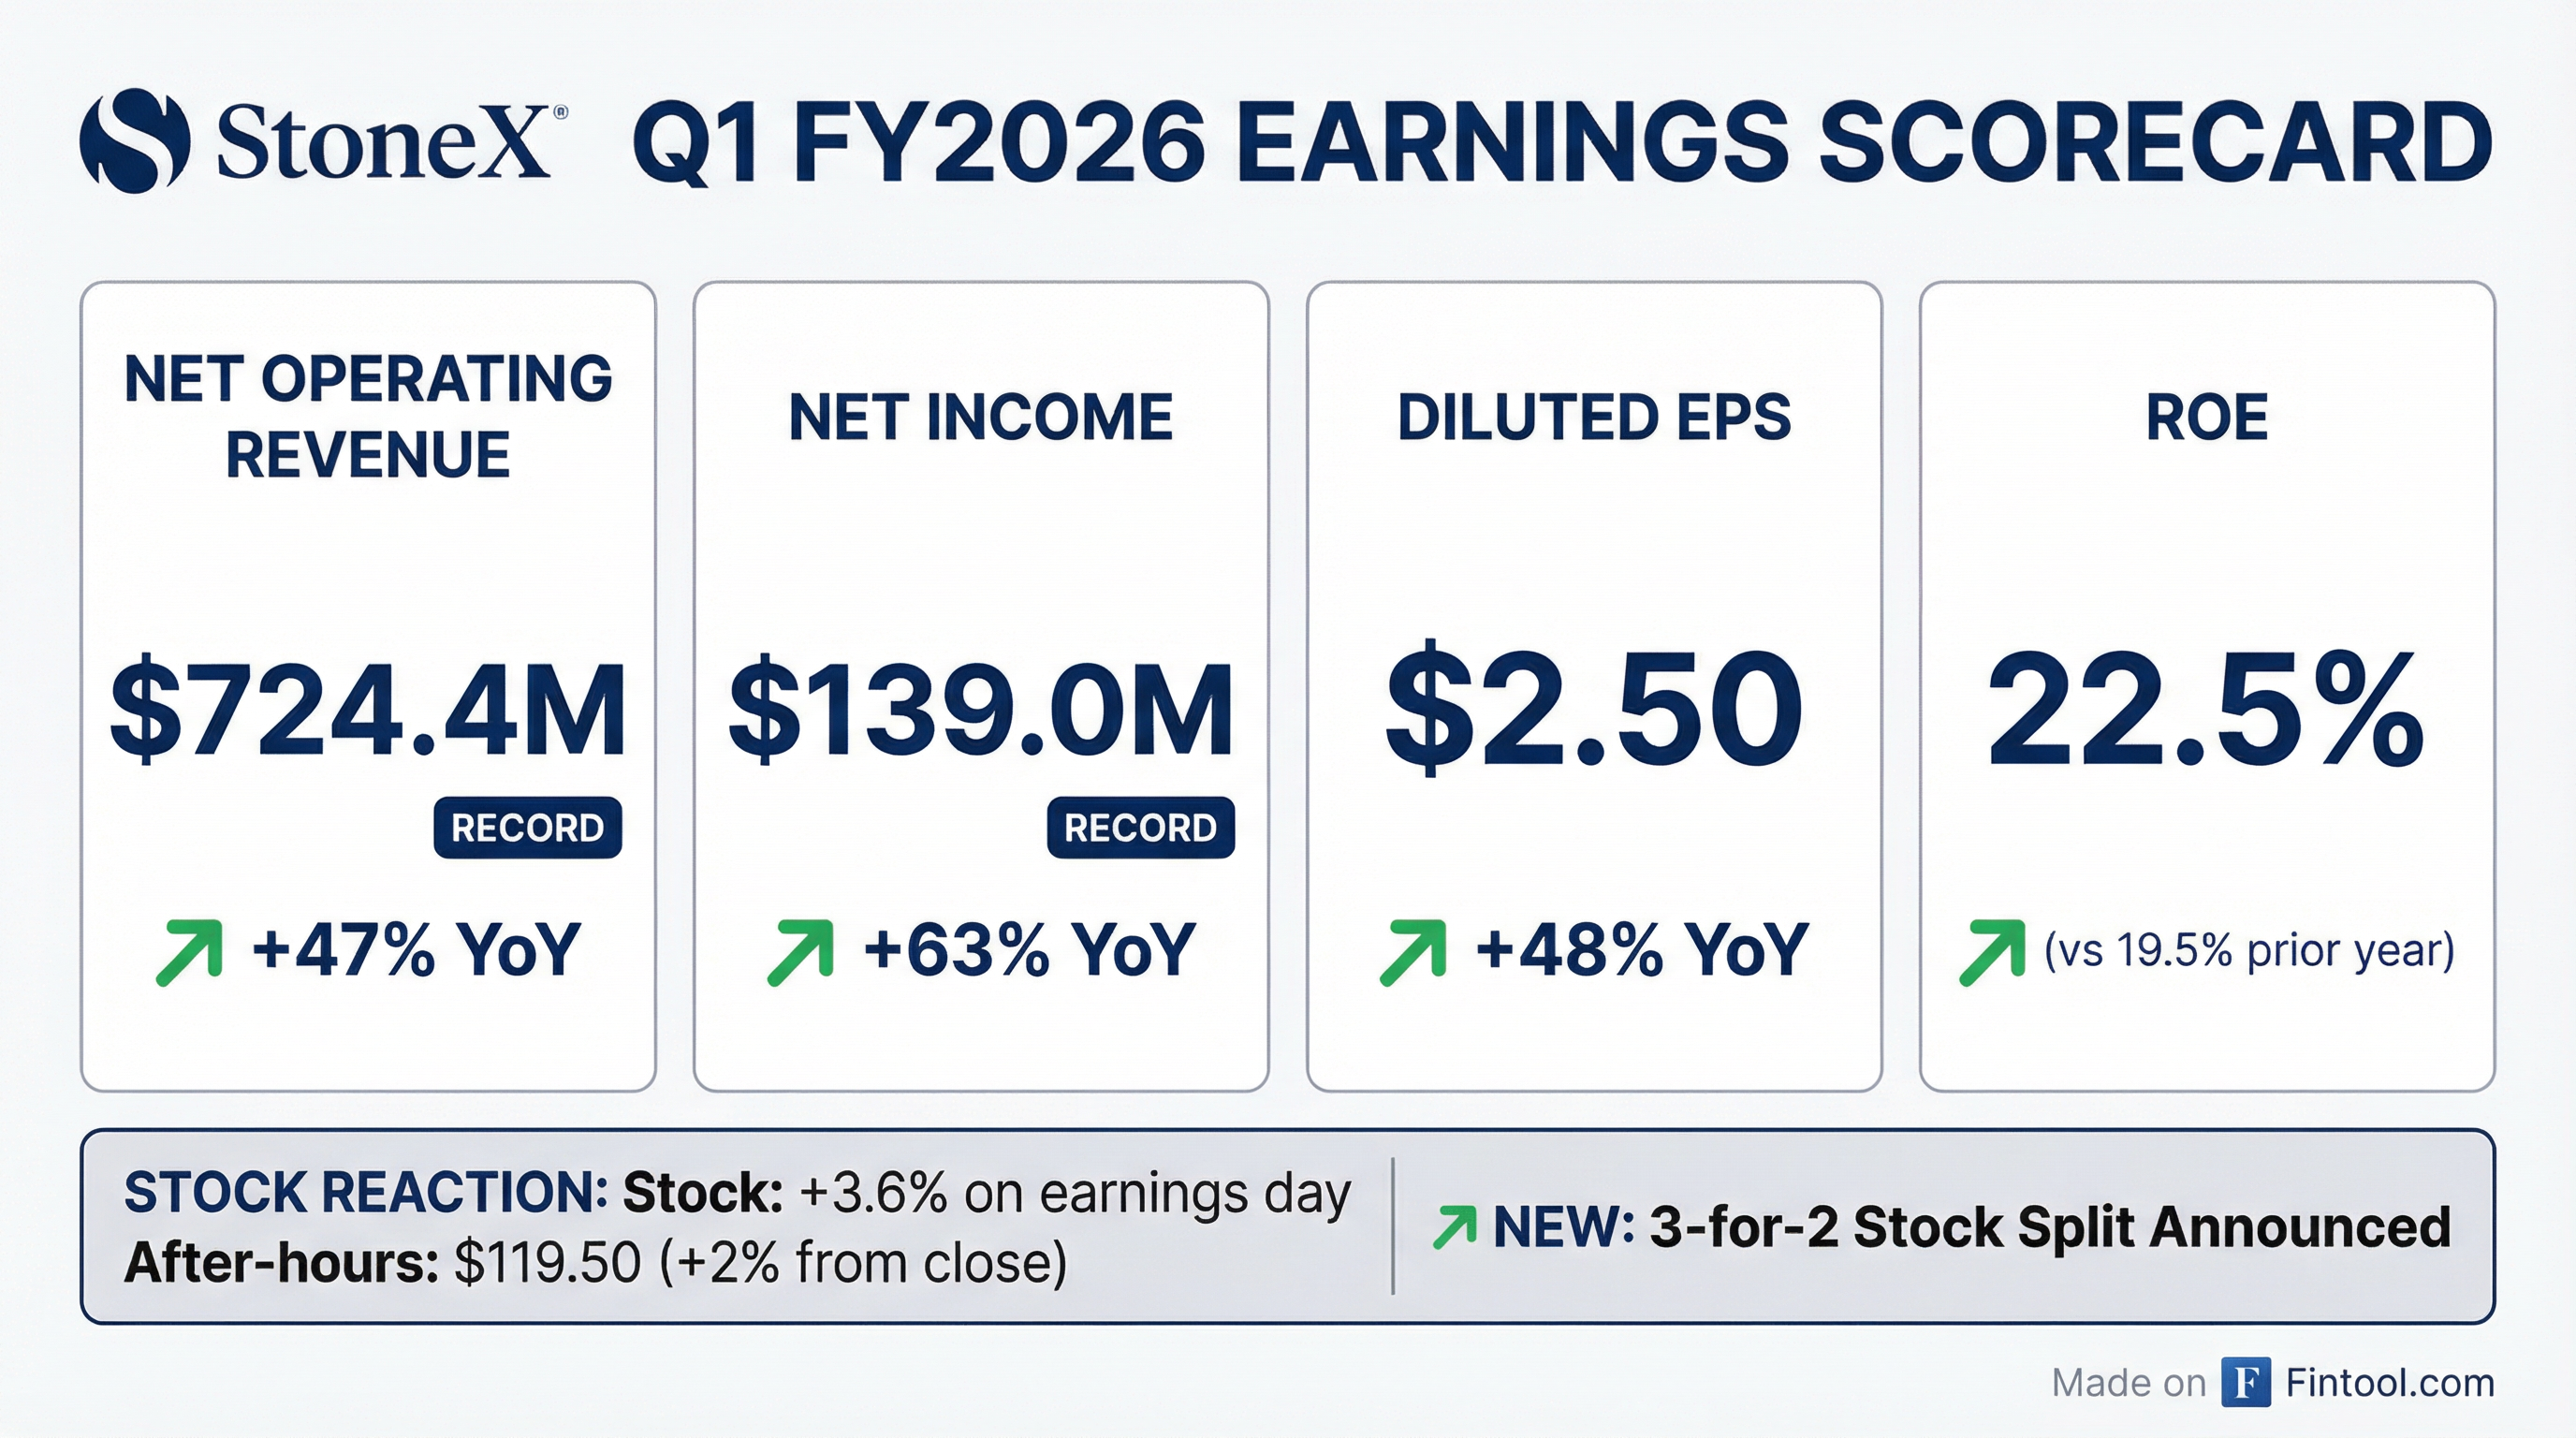
StoneX Group (NASDAQ: SNEX) delivered a blowout fiscal Q1 2026, posting record quarterly net operating revenues of $724.4 million (+47% YoY) and record net income of $139.0 million (+63% YoY). The financial services firm also announced a 3-for-2 stock split, signaling management confidence in the company's trajectory. Shares rose 3.6% on the news, with after-hours trading pushing above $119.
Did StoneX Beat Earnings?
StoneX crushed its prior-year results across every key metric:
CEO Philip Smith called it "another record, in terms of both net operating revenues and net income for StoneX," highlighting that the quarter was "driven by strong performances in both our Commercial and Institutional segments, in particular our Global Metals and Securities businesses, as well as our first full quarter with the acquired RJO and Benchmark businesses."
What Drove the Record Quarter?
Acquisitions Contributing at Scale
The RJO acquisition (effective July 31, 2025) marked its first full quarter of contributions, adding:
- 30.9 million listed derivative contracts
- $5.8 billion in average client equity
- $26.7 million in incremental interest expense (offset by client balance revenue)
Segment Performance
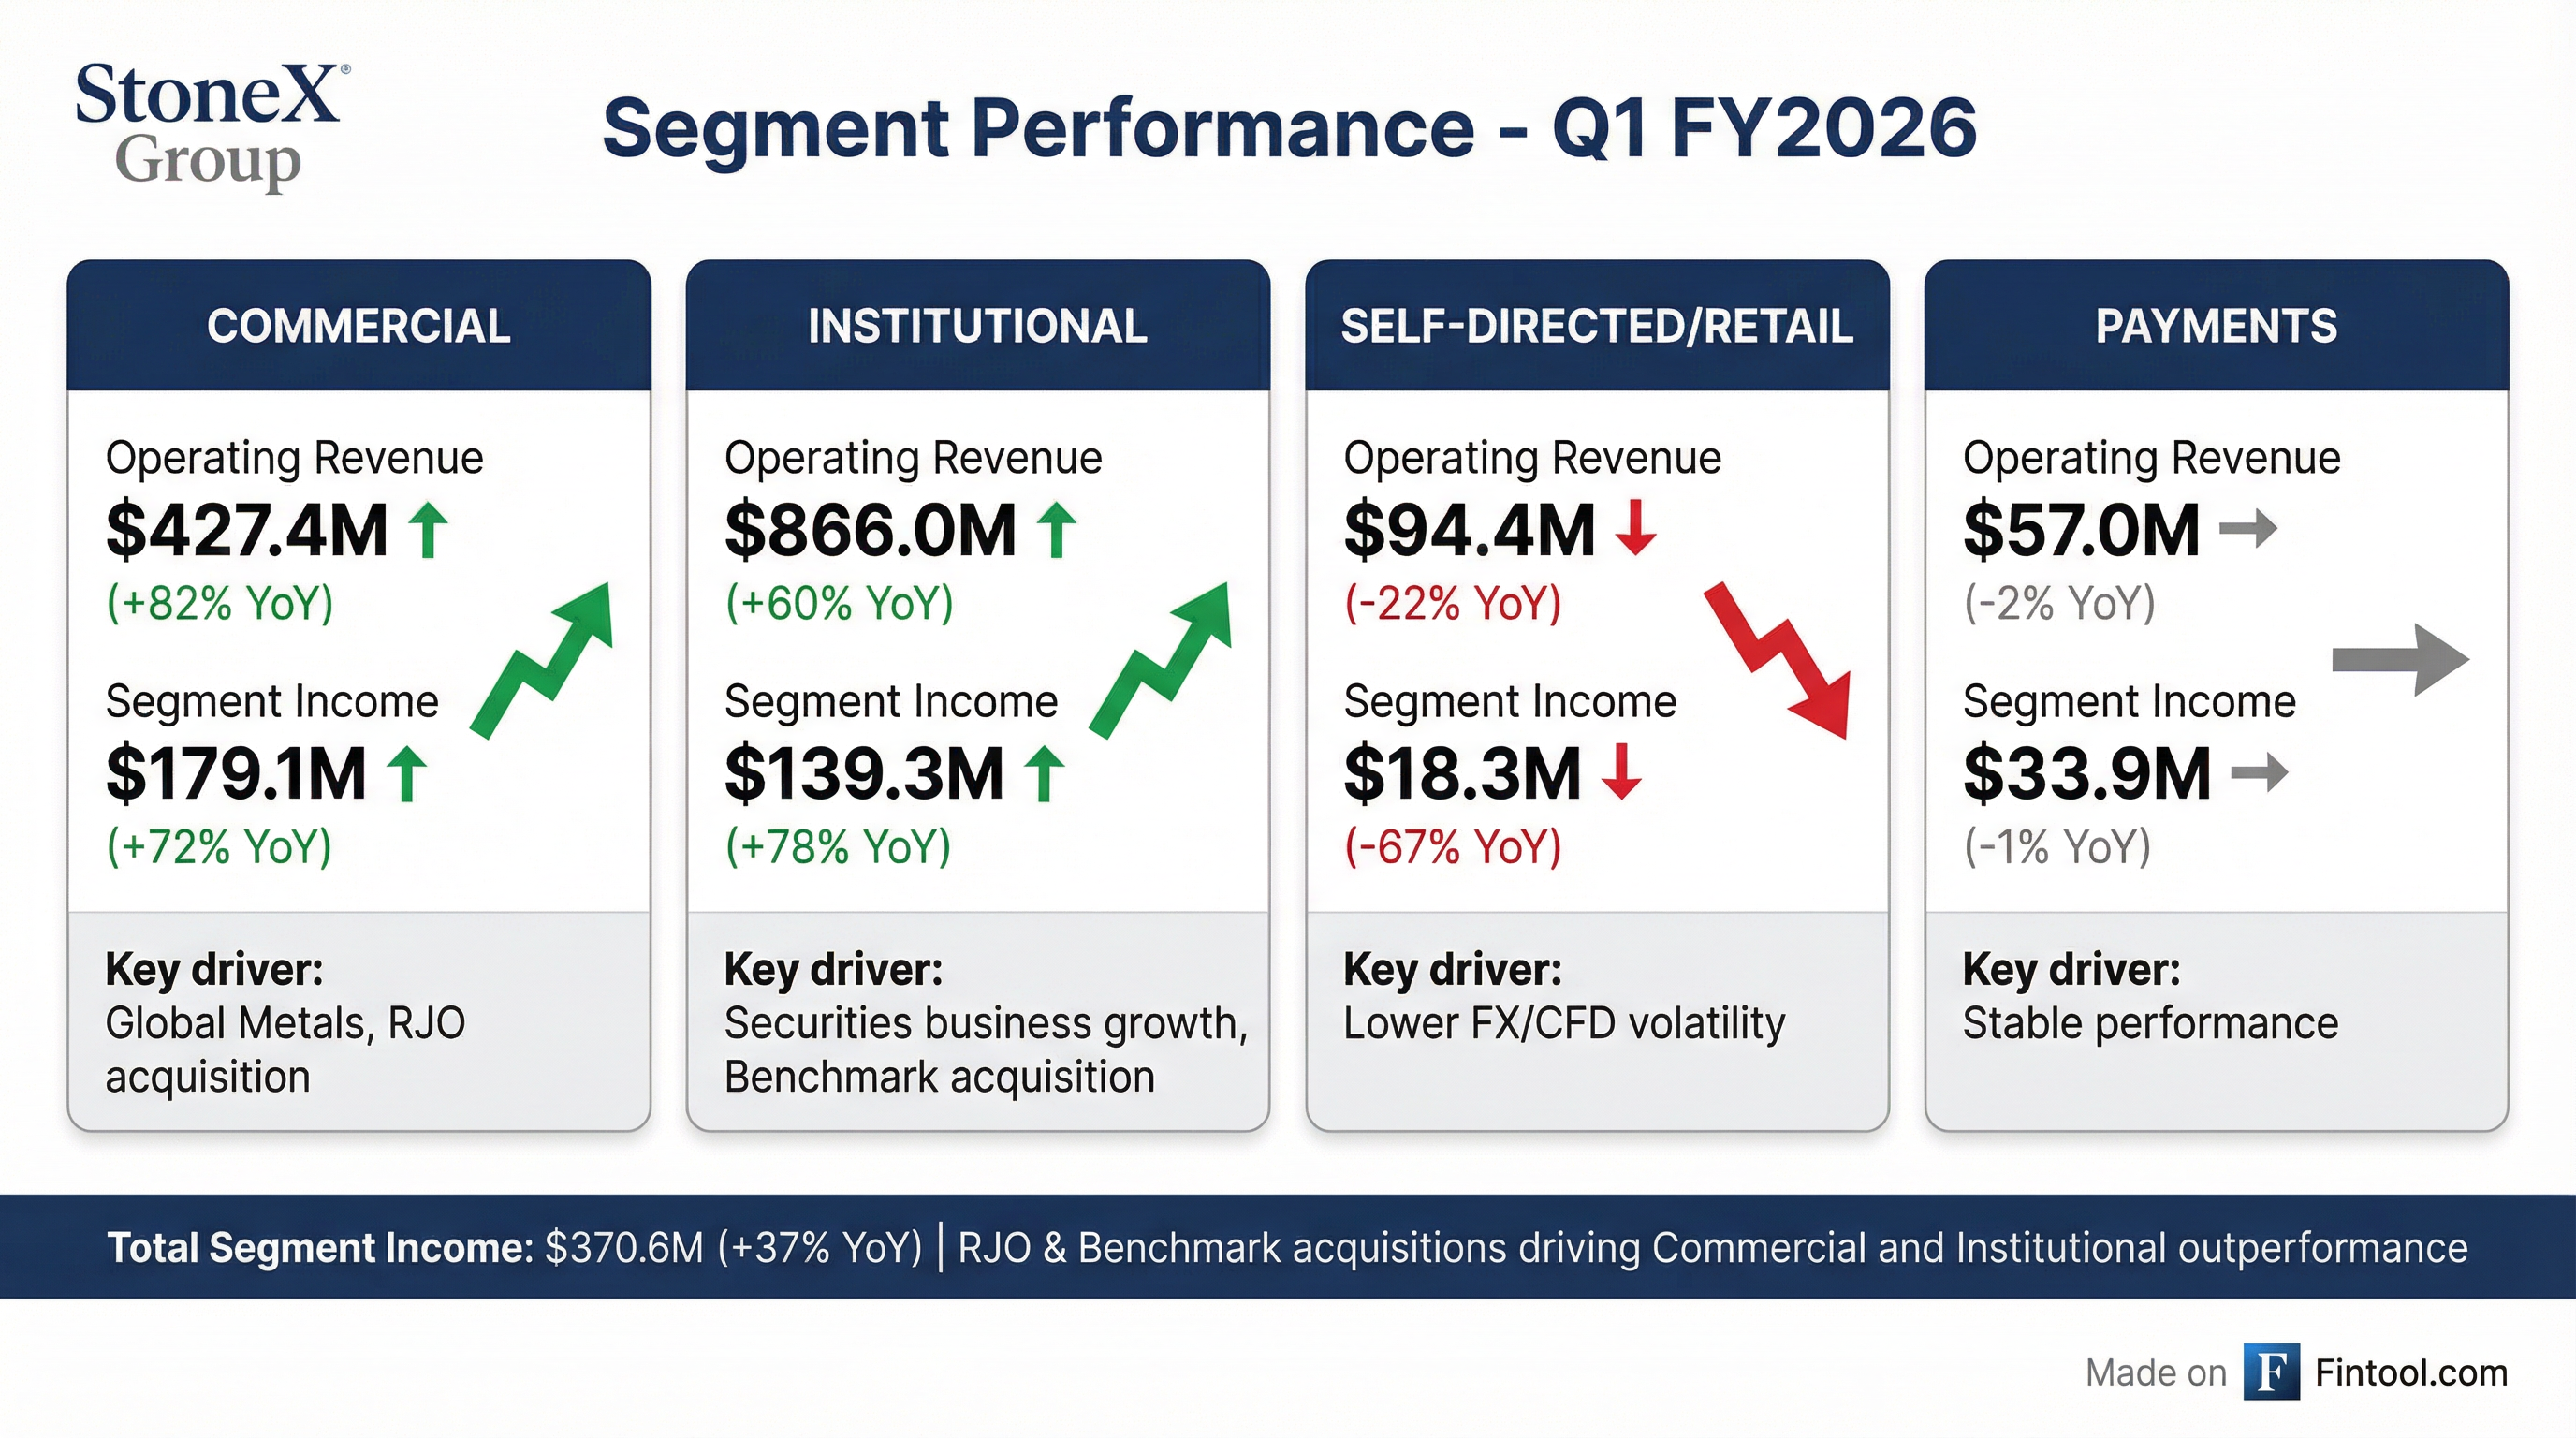
Commercial (+82%): Global Metals and physical commodities businesses drove the outperformance. Listed derivatives volume jumped 77% to 18.8 million contracts with average rate per contract up 21% to $6.87.
Precious Metals: The Breakout Story: The precious metals business alone generated $75 million in segment income this quarter—that's $24 million more than the entire fiscal year 2025. CEO Philip Smith highlighted StoneX's unique metals ecosystem:
- Only non-bank participant in setting gold, silver, platinum, and palladium daily price benchmarks
- CME-accredited vault now holds $1.2 billion+ in custody after just a few quarters of operation
- StoneX Bullion (direct-to-consumer platform) went from making ~$1.5M/year at acquisition to achieving that in a single day recently
Institutional (+60%): Securities business posted ADV of $10.6 billion (+22%) with RPM of $320 (+35%). Listed derivatives surged 173% in operating revenue.
Self-Directed/Retail (-22%): FX/CFD revenue dropped 30% due to lower volatility (RPM fell 41% to $110). ADV was actually up 13% to $8.6 billion, but tighter spreads hurt profitability.
How Did the Stock React?
SNEX shares responded positively to the results:
The stock has been on a tear, nearly doubling from its 52-week low. The combination of record results and the stock split announcement created strong buying pressure.
What's the Stock Split?
On February 3, 2026, StoneX's Board approved a 3-for-2 stock split to "make stock ownership more accessible to employees and investors."
Shareholders will receive one additional share for every two shares owned. Fractional shares will be paid in cash based on the March 11, 2026 opening price.
This is StoneX's second 3-for-2 split in less than a year—the prior split occurred on March 21, 2025.
What Changed From Last Quarter?
*Values retrieved from S&P Global
Key sequential improvements:
- Commercial segment income up 72% YoY (vs. +37% last quarter)
- Securities RPM accelerated to +35% YoY (showing margin expansion)
- RJO integration now fully reflected in results
- Variable expenses as % of total increased to 58% from 52%—showing operating leverage
Key Management Quotes
"We play a vital role in the global financial and physical markets by serving a wide and diverse range of clients. Our platform enables clients to access multiple markets, giving them the flexibility and choice they need to pursue opportunities and/or mitigate risk wherever they arise."
— Philip Smith, CEO
"This was an exceptional quarter whereby our global footprint, the depth of our product vertical, and our logistics expertise in being able to move physical metal globally... allowed StoneX to record its best revenue quarter ever."
— Philip Smith, CEO
"We remain well-positioned to capitalize on current market volatility due to our diverse offerings combined with our fortress balance sheet."
— Philip Smith, CEO
Key Operating Metrics
The doubling of average client equity in listed derivatives reflects the RJO acquisition's transformational impact on the firm's scale.
Balance Sheet Highlights
Book value per share grew 5.7% sequentially, with ROE on tangible book value reaching an impressive 32.4%.
RJO Integration Update
The RJO acquisition (closed July 2025) is progressing well, with synergy targets on track:
Integration Milestones:
- January 2026 (Completed): UK entity consolidation—RJO UK migrated into StoneX UK, releasing $20M in capital
- Q2 FY2026: Complete remaining non-US business consolidation
- End of FY2026: ~$40M of synergies in run rate; US FCM consolidation during summer
- FY2027: Capture remaining synergies
Interest Rate Sensitivity & Hedging
With $14.5B in average client equity + MMF/FDIC sweep balances (+86% YoY), StoneX has significant interest rate exposure—but is now actively hedging:
New Hedging Program: During Q1 FY2026, StoneX entered into $1.2 billion in fixed-rate SOFR swaps to hedge aggregate interest rate exposure. The swaps have a 2-year duration and an average rate of 3.32%.
Net interest/fee income from client balances was up $38.1M YoY in Q1, with RJO contributing $37.3M of the increase.
Q&A Highlights
Key insights from analyst questions on the earnings call:
On Precious Metals Sustainability: CEO Philip Smith noted the record quarter was "very little to do" with RJO acquisition—it was driven by heightened wholesale and retail interest, plus StoneX's ability to move physical gold across jurisdictions to capture locational premiums (including being a top importer of gold and silver into India).
On Regional Bank Opportunity: Management sees a "phenomenal uptick" opportunity in cross-selling to regional/community banks. "What they are becoming very interested in with us is the multitude and the breadth and depth of our product offering... We aspire to be a one-stop shop."
On Securities Rate Per Million: CFO Bill Dunaway indicated the ~$320 RPM is the new normalized run rate after earlier dipping during expansion into mainstream equities. "Somewhere in this 300, a little over 300 range is probably a more normalized rate for us now going forward."
On FX/CFD Weakness: The 30% drop in rate per million versus prior year was against an unusually strong Q1 FY2025 comparison period. The current ~$110 RPM is within normalized expectations, not a structural decline.
On Expense Outlook: Q2 will see a "tick-up" in non-variable compensation due to annual merit increases and benefit resets at calendar year start.
What to Watch Going Forward
Positive Catalysts:
- Continued integration synergies from RJO and Benchmark acquisitions
- Elevated market volatility driving trading volumes
- Securities business margin expansion (RPM +35% YoY)
- Global Metals benefiting from commodity price dynamics
Risk Factors:
- Self-Directed/Retail segment weakness persisting if FX volatility remains low
- Interest rate sensitivity on client balances
- Integration execution risk with recent acquisitions
- Market-making losses in volatile conditions
Conference Call
StoneX hosted its Q1 FY2026 earnings call on Thursday, February 5, 2026. Key topics included the record precious metals quarter, RJO integration progress, regional bank cross-sell opportunities, and interest rate hedging strategy.
Company Overview
StoneX Group Inc. is a Fortune-500 global financial services network connecting clients to markets through digital platforms, clearing, execution, and advisory services. The company serves 80,000+ commercial/institutional clients and 400,000+ retail accounts from 80+ offices across six continents with 5,400+ employees.
Related Links: