Sonos (SONO)·Q1 2026 Earnings Summary
Sonos Beats on EPS and Revenue as Cost Discipline Drives Record Profitability
February 3, 2026 · by Fintool AI Agent
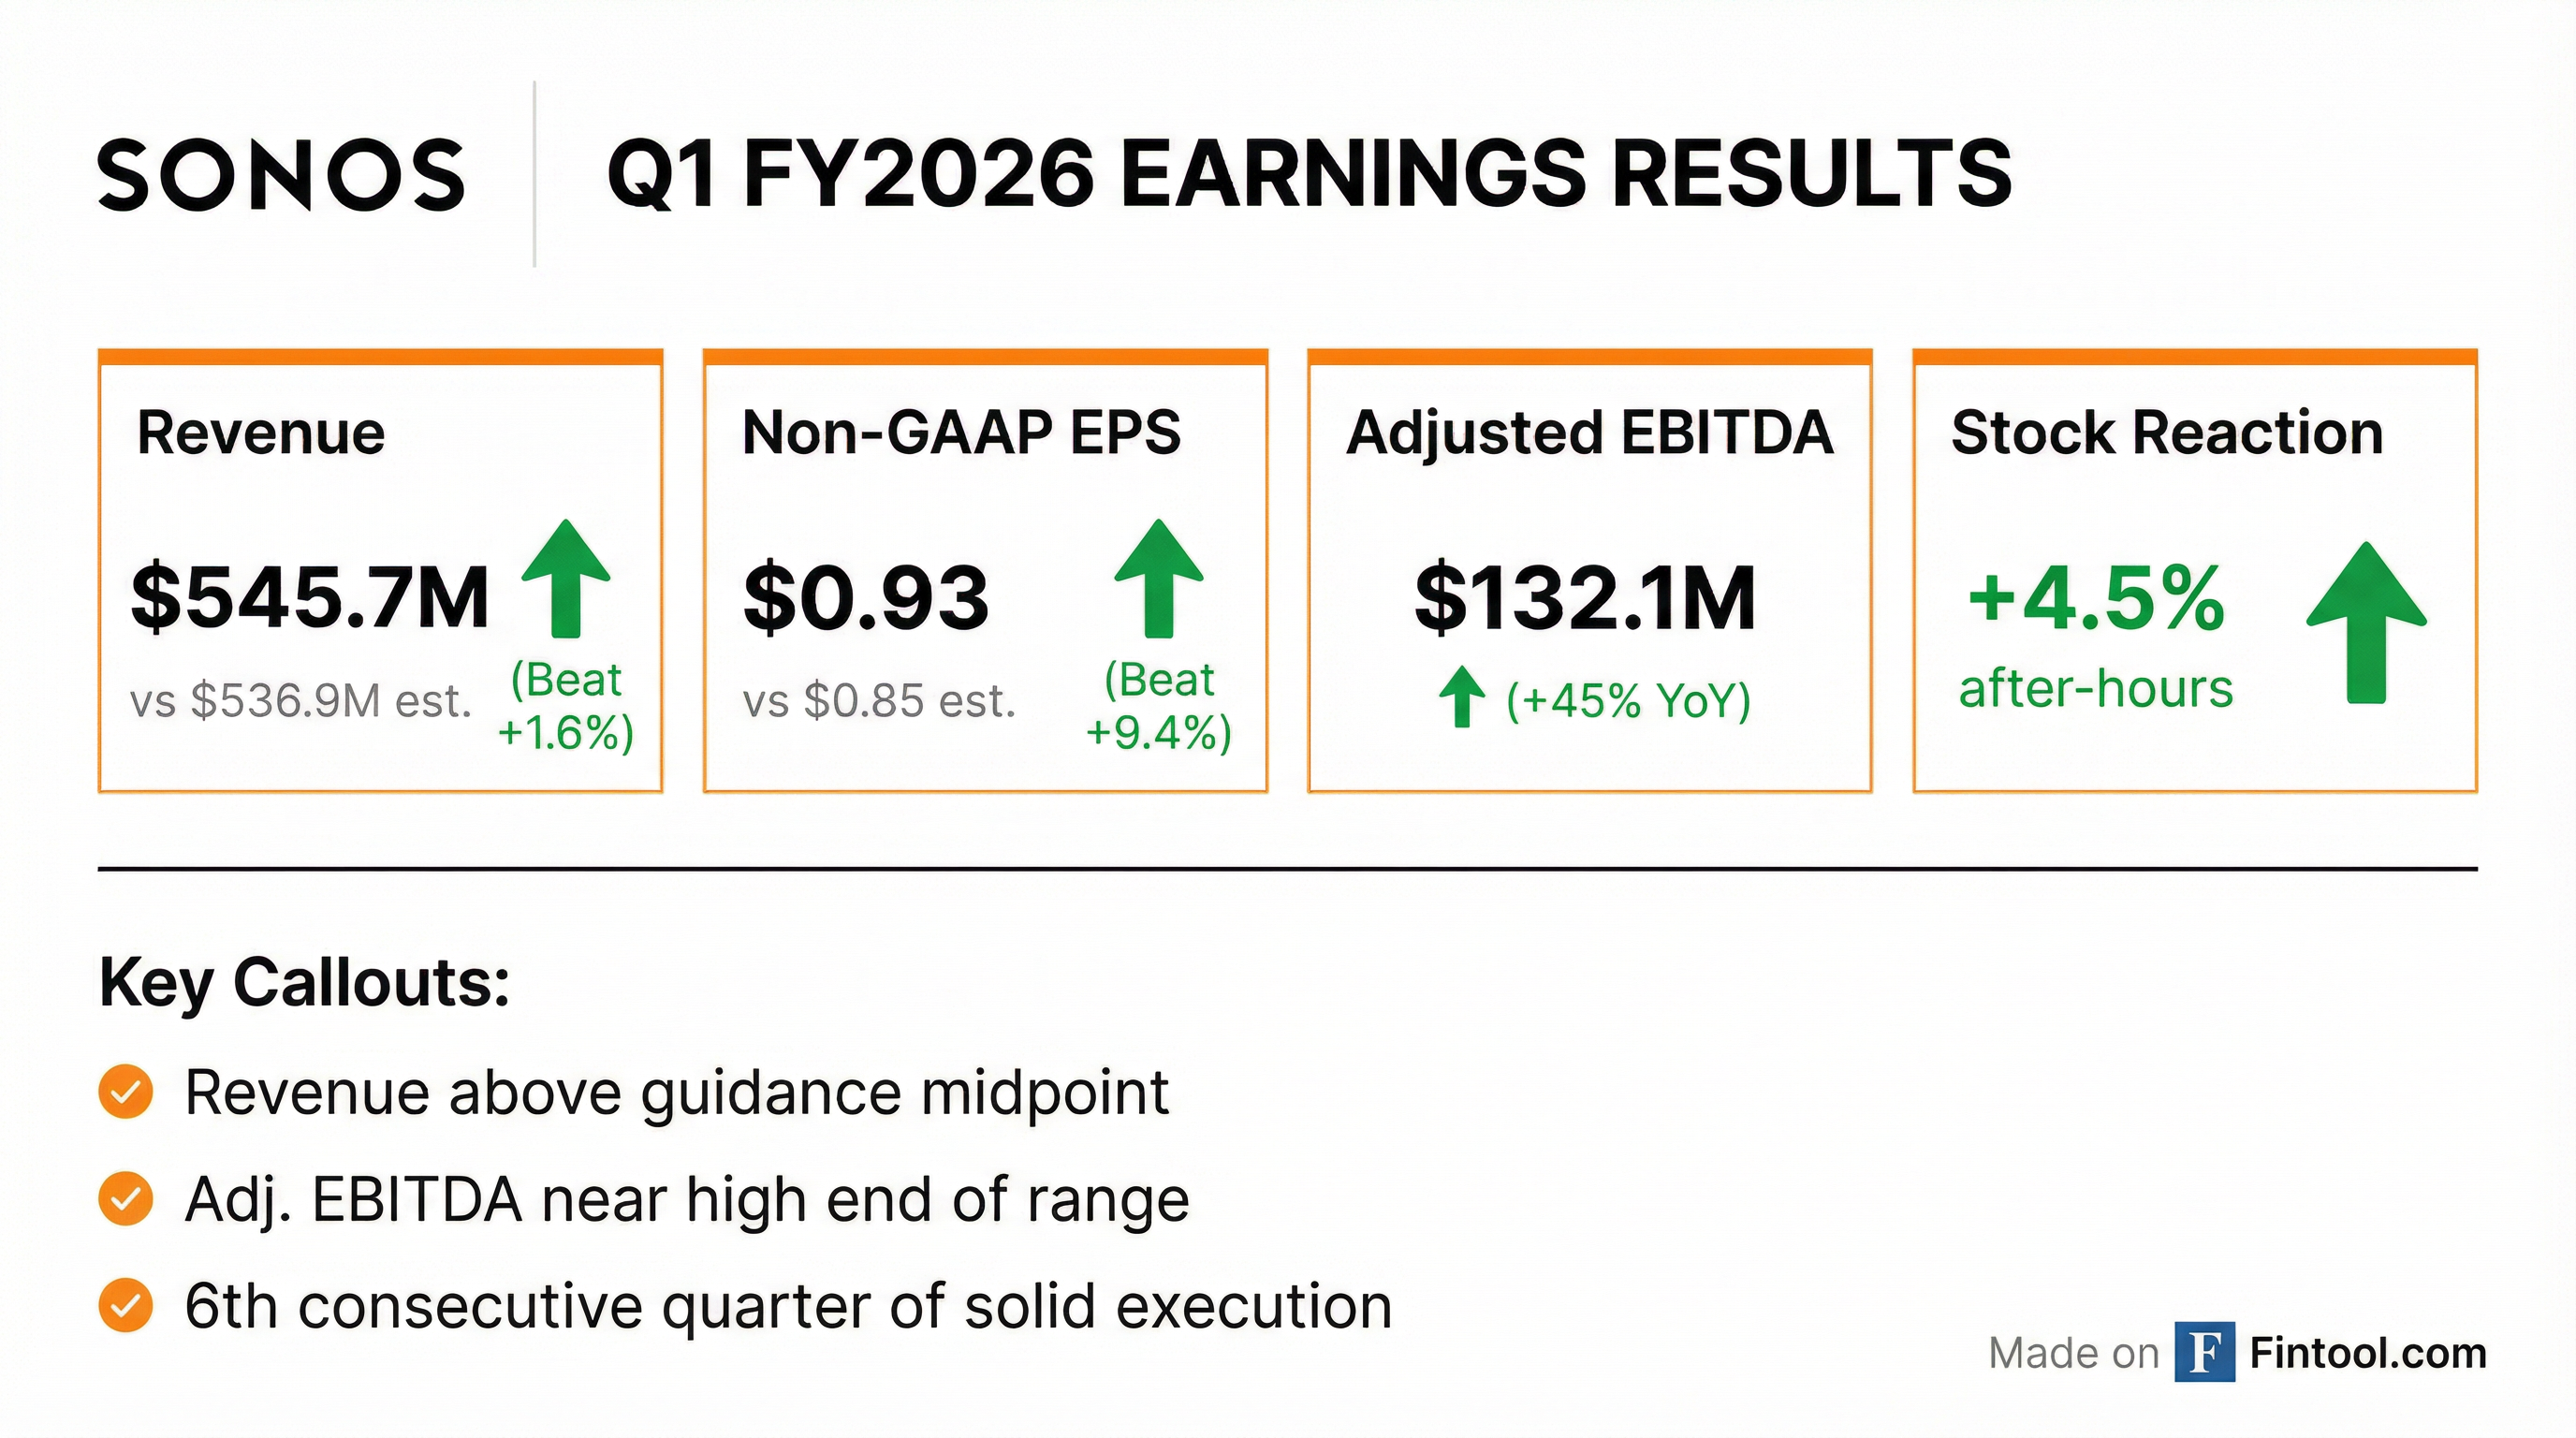
Sonos delivered a strong Q1 FY2026, beating both revenue and EPS estimates while generating more profit in a single quarter than it did in all of fiscal 2025. Revenue of $546 million came in above the guidance midpoint, while Adjusted EBITDA of $132 million landed near the high end of the guidance range, up 45% year-over-year.
The results mark the sixth consecutive quarter of solid execution under CEO Tom Conrad's leadership, as the company balances financial discipline with investments for long-term growth. Shares surged 12% in after-hours trading to $16.45 following the beat and strong Q2 guidance.
Did Sonos Beat Earnings?
Yes—Sonos delivered a double beat on both revenue and EPS:
The EPS beat was particularly notable given that last quarter (Q4 FY2025), Sonos missed estimates by reporting -$0.06 EPS versus $0.05 expected. This quarter's rebound demonstrates the seasonality of Sonos's business—Q1 captures holiday demand and typically represents the strongest quarter.
What Changed This Quarter?
Profitability Surge
The headline story is profitability. Sonos generated more profit in Q1 alone than in all of fiscal 2025:
Operating Expense Reduction
Operating expenses fell 21% YoY from $193M to $153M, driven by:
- R&D: $60M vs $81M (-26% YoY)
- Sales & Marketing: $65M vs $87M (-25% YoY)
- G&A: $28M vs $26M (+8% YoY—legal costs related to IP litigation)
Stock-based compensation also declined significantly from $25.3M to $15.2M (-40%), reflecting the reorganization that reduced management layers.
The transformation spans all functions:
- R&D: Functional reorganization, software resource consolidation, roadmap prioritization
- Sales & Marketing: CAC efficiency focus, reduced below-threshold branded spend, AI in customer service
- G&A: Shared services center, real estate optimization, IT tool consolidation
Management noted that ~25% of FY24 OpEx has been optimized through the transformation initiatives.
Cash Generation
Free cash flow was $157.3M, up from $143.1M in Q1 FY25. Cash and marketable securities totaled $363M, including $51M in short-duration T-bills.
Inventory management also improved, with total inventories decreasing 11% YoY to $350M, driven by component inventory workdown.
How Did the Stock React?
Sonos shares showed a muted reaction during the regular session but surged after-hours:
The strong after-hours move reflects investors rewarding the profitability beat, execution consistency, and Q2 guidance showing modest growth at the midpoint. The stock had declined 15% from its December highs heading into earnings, potentially pricing in concerns about tariff impacts and consumer spending.
Context: Over the past 6 months, SONO shares are up 32% compared to the Audio Video Production industry's 10.4% decline.
Platform Health & User Engagement
The earnings slides revealed strong platform KPIs that underscore Sonos's ecosystem durability:
Notably, 45% of new registrations come from existing customers, demonstrating strong repurchase behavior within the installed base.
IP Portfolio — Competitive Moat
Sonos's intellectual property portfolio provides significant barriers to entry:
- 1,900+ issued US patents
- 800+ US applications pending
- 4,700+ patents globally
- Rated #4 in Patent Power by IEEE Spectrum
- Featured on IPO's Patent 300 List for 8th consecutive year
The portfolio covers core playback, wireless networking, system setup, control interfaces, spatial audio, and AI/interoperability — foundational capabilities that underpin the Sonos system advantage.
Ecosystem Breadth
Sonos has built integrations with 100+ streaming, voice, and smart home service providers, including new partnerships with Peloton and Philips Hue. This ecosystem breadth reinforces the company's position as the standard for connected home audio.
Revenue by Segment and Geography
Product Mix
Sonos System Products grew 8% YoY, reflecting demand for components like the Amp and Sub. The company announced Amp Multi this quarter as part of its strategy to strengthen "Sonos as a system."
Geographic Mix
Americas showed modest growth despite facing tariff headwinds on products manufactured in Vietnam and Malaysia. EMEA weakness reflects a difficult consumer environment in Europe.
For context, FY25 full-year revenue by geography was: Americas $923M (64%), EMEA $441M (31%), and APAC $79M (5%). The company is distributed in 60+ countries and sees significant opportunity for geographic expansion, particularly given its #1 position in US premium home theater and #2 position in both EMEA home theater and streaming audio.
What Did Management Say?
CEO Tom Conrad emphasized the strong start to fiscal 2026 and the company's strategic vision:
"We delivered Q1 revenue of $546 million, with gross profit dollars growing 5% year over year. Adjusted EBITDA grew 45% year over year to $132 million... we generated as much adjusted EBITDA in this one quarter as we did in all of fiscal 2025."
On the path to growth:
"Returning our company to growth is not about a single quarter, a single launch, or a single trend. It's about sustained, coordinated action anchored in the power of the Sonos system."
On systemness as competitive advantage:
"Sonos is not a collection of products. It's a system that gets more valuable as you add to it, use it across more rooms, and rely on it over time."
CFO Saori Casey highlighted the operational transformation:
"This represents a continued improvement from a 6% decline in the first half of fiscal 2025 and a 3% decline in the second half of fiscal 2025."
The $12 Billion Installed Base Opportunity
Conrad provided specific quantification of the opportunity within Sonos's existing customer base:
Additionally, Sonos holds only ~6% of the $24B global premium audio market, with substantial room for share gains, particularly outside core markets. The premium audio TAM includes wireless speakers ($100+), soundbars ($200+), Hi-Fi systems ($300+), headphones ($300+), and related categories.
Era 100 as Growth Engine
Q1 marked the third consecutive quarter of accelerating new customer growth among households that start with Era 100, up more than 40% year-over-year. The price reduction strategy is working: Era 100 is serving as the gateway into the Sonos system, with newer cohorts showing strong repurchase behavior.
Five Growth Dimensions
Conrad outlined the strategic framework driving the return to growth:
- Product innovation — Hardware and software roadmaps tightly aligned; back-half launches planned
- Customer advocacy — Focus on performance, reliability, ease of use; 10 software upgrades in Q1
- Marketing excellence — New CMO rebuilding go-to-market around "full funnel brand architecture"
- Geographic expansion — Growth markets outpacing core; opportunities in pricing, partnerships, local relevance
- External trends — Positioning for conversational AI in the home
What Did Management Guide?
Sonos provided detailed Q2 and first-half guidance, pointing to modest growth at the midpoint and significant profitability improvement:
Q2 FY2026 Guidance
Q2 guidance does not include revenue contribution from Amp Multi, which won't be generally available until H2 FY2026.
First Half FY2026 Outlook
CFO Saori Casey noted that Q2 gross margin guidance embeds higher memory costs, though Sonos products have modest memory requirements of 512MB-2GB, with many containing 1GB or less.
Tariff and Macro Headwinds
Sonos faces approximately 20% tariffs on products manufactured in Vietnam and Malaysia. The company has mitigated most of the ~300 bps gross margin impact through:
- Selective price increases on certain products
- Promotional adjustments
- Cost-sharing with channel partners
CFO Saori Casey noted on the prior call that Q1 benefited from seasonal inventory build at lower tariff rates, with the effective tariff rate expected to step up and stabilize in Q2, creating ~100 bps additional headwind.
Q&A Highlights
Memory Cost Concerns
Asked about rising memory costs impacting the hardware industry, CEO Conrad noted Sonos is "taking action" with multiple approaches:
- Secured and certified additional memory suppliers to reduce spot market reliance
- Products have modest memory requirements (512MB-2GB, many at 1GB or less)
- Customers buy Sonos for experiences, not memory configurations
- Actively driving cost efficiencies across product architecture
Conrad confirmed supply should be adequate for H2 product launches.
AI Strategy — Three Dimensions
Conrad outlined Sonos's approach to AI across three areas:
-
Conversational AI in the home: Given Sonos's scale (53M+ connected devices, 17M homes), the company is positioned to explore new interaction models that feel "invited rather than tacked on"
-
Anticipatory design: AI-powered system features that anticipate user needs and serve the right content in the right setting with minimal input
-
Internal productivity: Sonos is "at the leading edge" of integrating AI development tools into workflows to accelerate software innovation
K-Shaped Economy & Market Health
On the premium home theater market, Conrad acknowledged a "K-shaped" macro environment with growing demand for premium experiences but diminishing demand for entry-level. Sonos's portfolio is well-positioned for this dynamic.
The installer channel now represents 22% of Sonos's business and growing, with Amp Multi designed specifically for these partners.
New CMO Impact
New CMO Colleen DeCourcy has been with Sonos for three weeks and is already aligning creative, messaging, and channel execution around a consistent "system narrative." The goal is to move from episodic product-launch-driven marketing to sustained brand presence.
Historical Financial Trends
*Values retrieved from S&P Global
Sonos exhibits significant seasonality, with Q1 (holiday quarter) representing the strongest period for both revenue and profitability. The company has now delivered positive Adjusted EBITDA in 4 of the last 5 quarters.
Forward Catalysts
-
New Product Launches in H2 FY2026: Management indicated new hardware launches are concentrated in the back half of the fiscal year, with "a lot planned for the rest of 2026"
-
Amp Multi: Unveiled last week, offering multi-zone amplification with simpler installation, configuration, and tuning for professional installers. Makes complex systems easier to deploy and allows Sonos to be "built directly into the architecture of sophisticated homes." Generally available H2 FY2026.
-
AI Integration: Three-pronged approach — conversational AI in home, anticipatory design features, and internal productivity tools
-
New CMO: Colleen DeCourcy joined as Chief Marketing Officer in January and is already aligning messaging around consistent system narrative
-
Continued Share Repurchases: $105M remaining on buyback authorization; company repurchased $25M in Q1 (1.5M shares at average price of $16.79)
-
Geographic Expansion: Growth markets continuing to outpace core markets
Risks and Concerns
- Revenue Still Declining: Despite the beats, Q1 revenue declined 0.9% YoY—the company is still working toward returning to growth
- Memory Cost Inflation: Q2 gross margin guidance embeds higher memory costs, though Sonos products have modest memory needs
- Tariff Headwinds: ~300 bps gross margin headwind largely offset by pricing and cost actions
- Consumer Spending: K-shaped economy with weak demand at entry-level price points
- Q2 Seasonality: Adjusted EBITDA guided to -$18M to $10M, reflecting normal seasonality
Key Takeaways
- Double Beat: Revenue +1.6% and EPS +9.4% vs consensus
- Profitability Surge: Adjusted EBITDA up 45% YoY; margin expanded 760 bps — more EBITDA in Q1 than all of FY2025
- Q2 Guide Shows Growth: Revenue +2% YoY at midpoint; H1 EBITDA up 42%
- Era 100 Momentum: New customer growth accelerating 40%+ YoY for third straight quarter
- Cost Discipline: Operating expenses down 21% YoY
- Strong Cash Generation: Free cash flow of $157M; net cash position of $363M
- Stock Reaction: +12.4% after-hours to $16.45
Disclosure: This analysis was generated by Fintool AI Agent and should not be considered investment advice.