SUNCOR ENERGY (SU)·Q4 2025 Earnings Summary
Suncor Shatters Records as Oil Sands Giant Delivers Best Year Ever
February 4, 2026 · by Fintool AI Agent
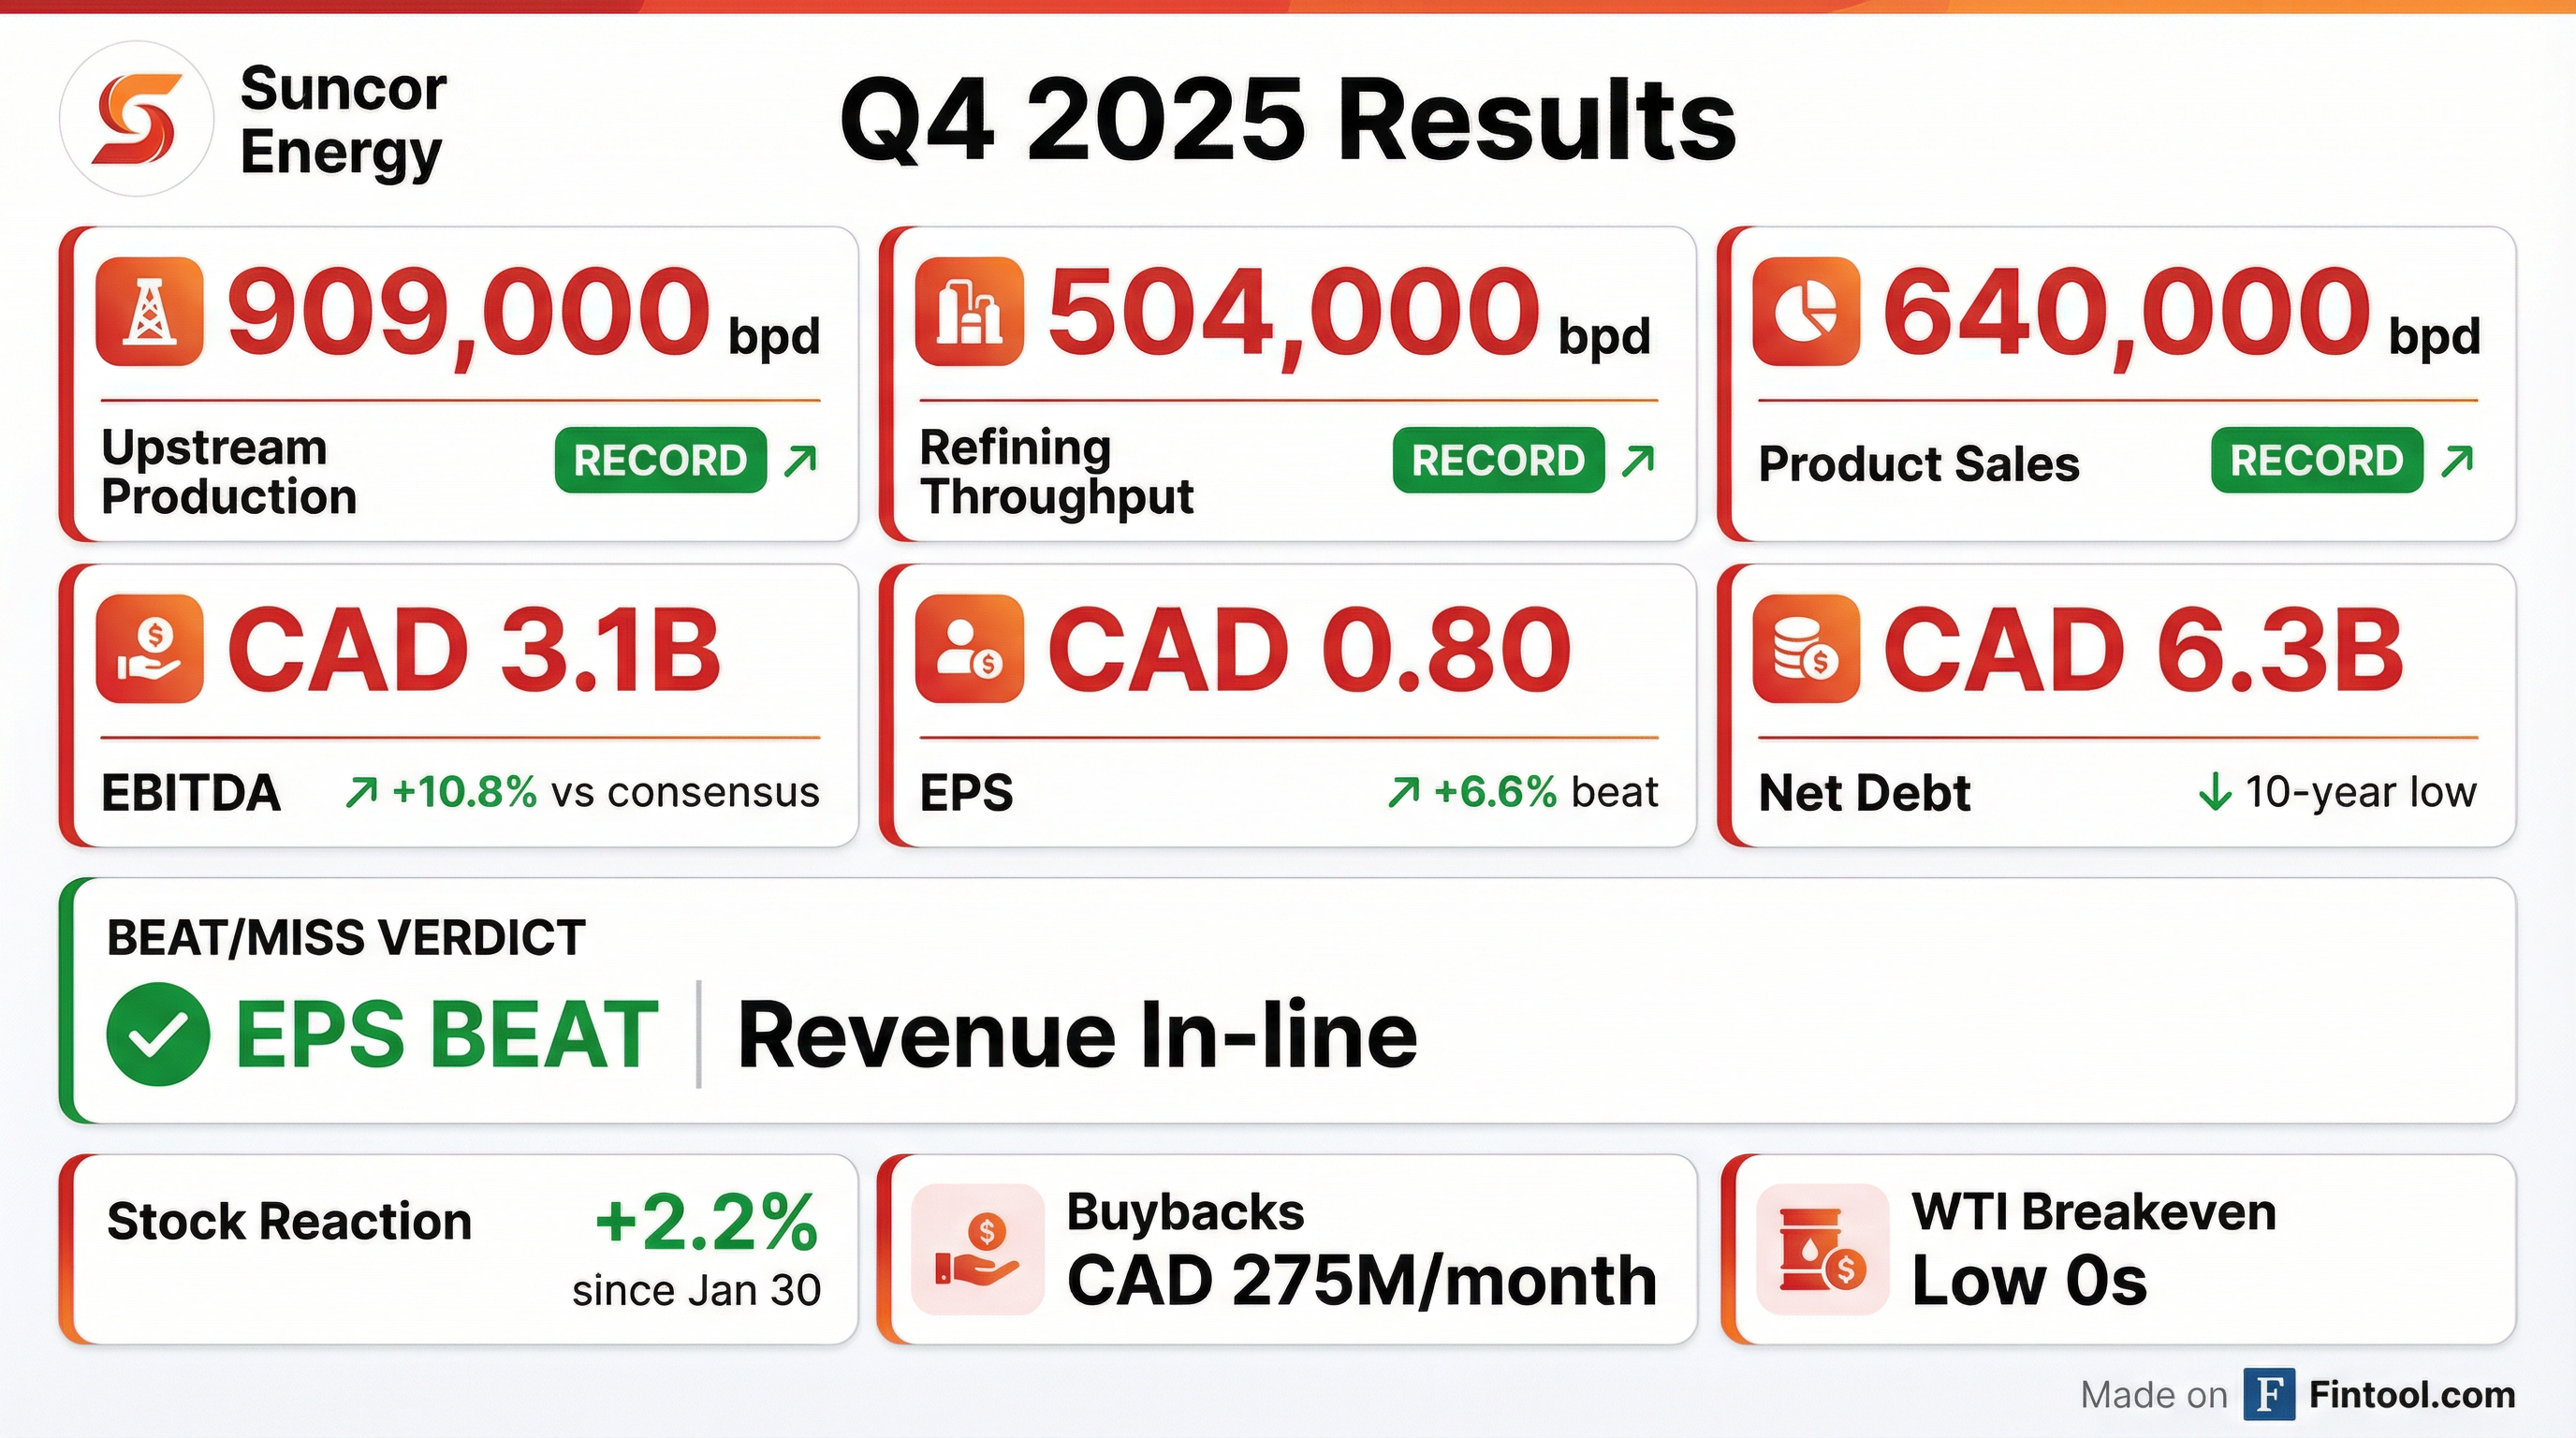
Suncor Energy delivered a commanding Q4 2025, beating EPS estimates by 6.6% and EBITDA by nearly 11% while posting all-time records across upstream and downstream operations. CEO Rich Kruger declared 2025 "the best year in company history" and announced the company achieved its entire 3-year strategic plan in just 2 years.
The stock rose 2.2% since January 30 on the strength of operational excellence that management says is "far from done yet."
Did Suncor Beat Earnings?
Yes — EPS and EBITDA beat, revenue in-line.
*Values retrieved from S&P Global
The EPS beat was driven by record production volumes and strong refining margins. EBITDA significantly outpaced expectations despite WTI averaging just $59/barrel in Q4 vs $71 in Q1 2025.
What Did Suncor Report for Production?
Suncor set records across virtually every operational metric:
"Over the last two years, we've increased production 114,000 barrels a day with the same asset base. No costly acquisitions, no major capital-intensive projects — growth from within." — CEO Rich Kruger
All four refineries operated at 100%+ utilization for the second consecutive quarter.
How Did Suncor Achieve Its 3-Year Plan in 2 Years?
At the Spring 2024 Investor Day, Suncor outlined ambitious 3-year targets for 2024-2026. Management announced they've now met or exceeded every target a full year early:
Net debt of CAD 6.3 billion is the lowest in over a decade, down nearly 50% from 3 years ago.
What Did Management Guide?
2026 Outlook
Management maintained strong forward momentum:
- Buybacks: CAD 275M/month continuing into 2026 (up 10% from 2025 average)
- Capital: Targeting ~CAD 6B annually, with ability to "have our cake and eat it too" — develop resources while returning capital
- Fort Hills: Targeting 200,000 bpd production level (vs 175 KBD prior) from a 220,000 bpd capacity
CFO Troy Little emphasized: "We don't pay you what is left over. We pay you first. We look at our cash flow results, pay our dividends, fund our buybacks, and only then consider our spending on other things."
Investor Day Preview (March 31)
Management teased a new value improvement plan with two horizons:
- Short-term: Next 3 years
- Long-term: Next 15 years, focused on bitumen supply and development options
"It needs to be bold and ambitious, clear and compelling to keep your interest and support. I can't wait to hear what we have to say." — CEO Rich Kruger
How Did the Stock React?
*Values retrieved from S&P Global
Shares touched a new 52-week high of $55.30 intraday, reflecting market confidence in the operational turnaround story.
What Changed From Last Quarter?
Key Deltas vs Q3 2025
*Values retrieved from S&P Global
The +6% AFFO increase came despite WTI falling from the mid-$60s to $59/barrel — demonstrating the resilience of Suncor's low-cost model.
Safety Milestone
2025 marked the safest year in company history — the third consecutive record year — with injuries and incidents down 70% since 2022.
What Did Management Say About Key Topics?
Autonomous Mining
Peter Zebedee (EVP Oil Sands) highlighted progress on autonomous haul trucks:
- Fully deployed 140 autonomous haul trucks at Base Plant
- Implemented "Mud Mode" technology to reduce slippage in soft conditions
- "Mud Mode 2.0" coming by spring 2026
- Moved 1.4 billion tons of material in 2025 — up 12% YoY at flat costs
Refining Advantages
On Canadian refining margins: "If you were choosing to be a refiner anywhere in the world and profitability was at the top of your list, I think you'd have picked Canada... product pricing based on import parity, locally advantaged crude prices." — CEO Kruger
Dave Oldreive (EVP Downstream) noted: "We had record crude throughput, but we also had record gasoline production, record diesel production, record jet fuel production."
Edmonton Refinery Win
A CAD 140,000 investment (routing changes + improved catalysts) delivered:
- +8,000 bpd diesel yield increase
- ~CAD 45M annual incremental value
- Implemented in Q4, full impact in 2026
Montreal Refinery Win
A CAD 100,000 investment (two control valves, one pump impeller, small motor) delivered:
- +20,000 bpd throughput capacity
- ~CAD 100M annual improvement
Capital Allocation Priorities
Management emphasized a disciplined framework:
- Dividends — paid first
- Share buybacks — CAD 275M/month, 163M shares repurchased over 3 years (12% of float)
- Maintenance capital — sustaining the business
- Growth capital — only after shareholder returns funded
"We've been constructing a longer-term plan where we can develop incremental resources over time, and we can continue to return capital to shareholders while we're doing that." — CEO Kruger
Financial Performance Trends (8 Quarters)
*Values retrieved from S&P Global
The improving net debt trajectory — down nearly $2B over two years — provides balance sheet flexibility and supports the aggressive buyback program.
Risks and Concerns
Tariff Uncertainty
While not directly addressed, management noted their integrated model provides insulation from WCS differential volatility: "When others have more volatility than we have... there's opportunities in that for us."
Oil Price Sensitivity
Despite strong operational performance, the business remains tied to commodity prices. Q4 AFFO held up despite WTI falling to $59/bbl, but sustained sub-$50 oil would test even Suncor's low-cost structure.
Execution of Long-Term Plan
The March 31 Investor Day will reveal ambitious 15-year plans. Execution risk on major capital projects remains a key factor for the investment thesis.
Key Takeaways
- Operational excellence continues — Records across production, refining, and sales demonstrate cultural transformation under Kruger's leadership
- 3-year plan achieved in 2 — Every strategic target met or exceeded a year early
- Shareholder returns prioritized — Buybacks increased to CAD 275M/month, independent of oil price
- Balance sheet strength — Net debt at CAD 6.3B, lowest in a decade
- More to come — March 31 Investor Day will unveil new 3-year and 15-year plans