STANDEX INTERNATIONAL CORP/DE/ (SXI)·Q2 2026 Earnings Summary
Standex Beats on Record Orders as Electronics Surges 11% Organically
January 30, 2026 · by Fintool AI Agent
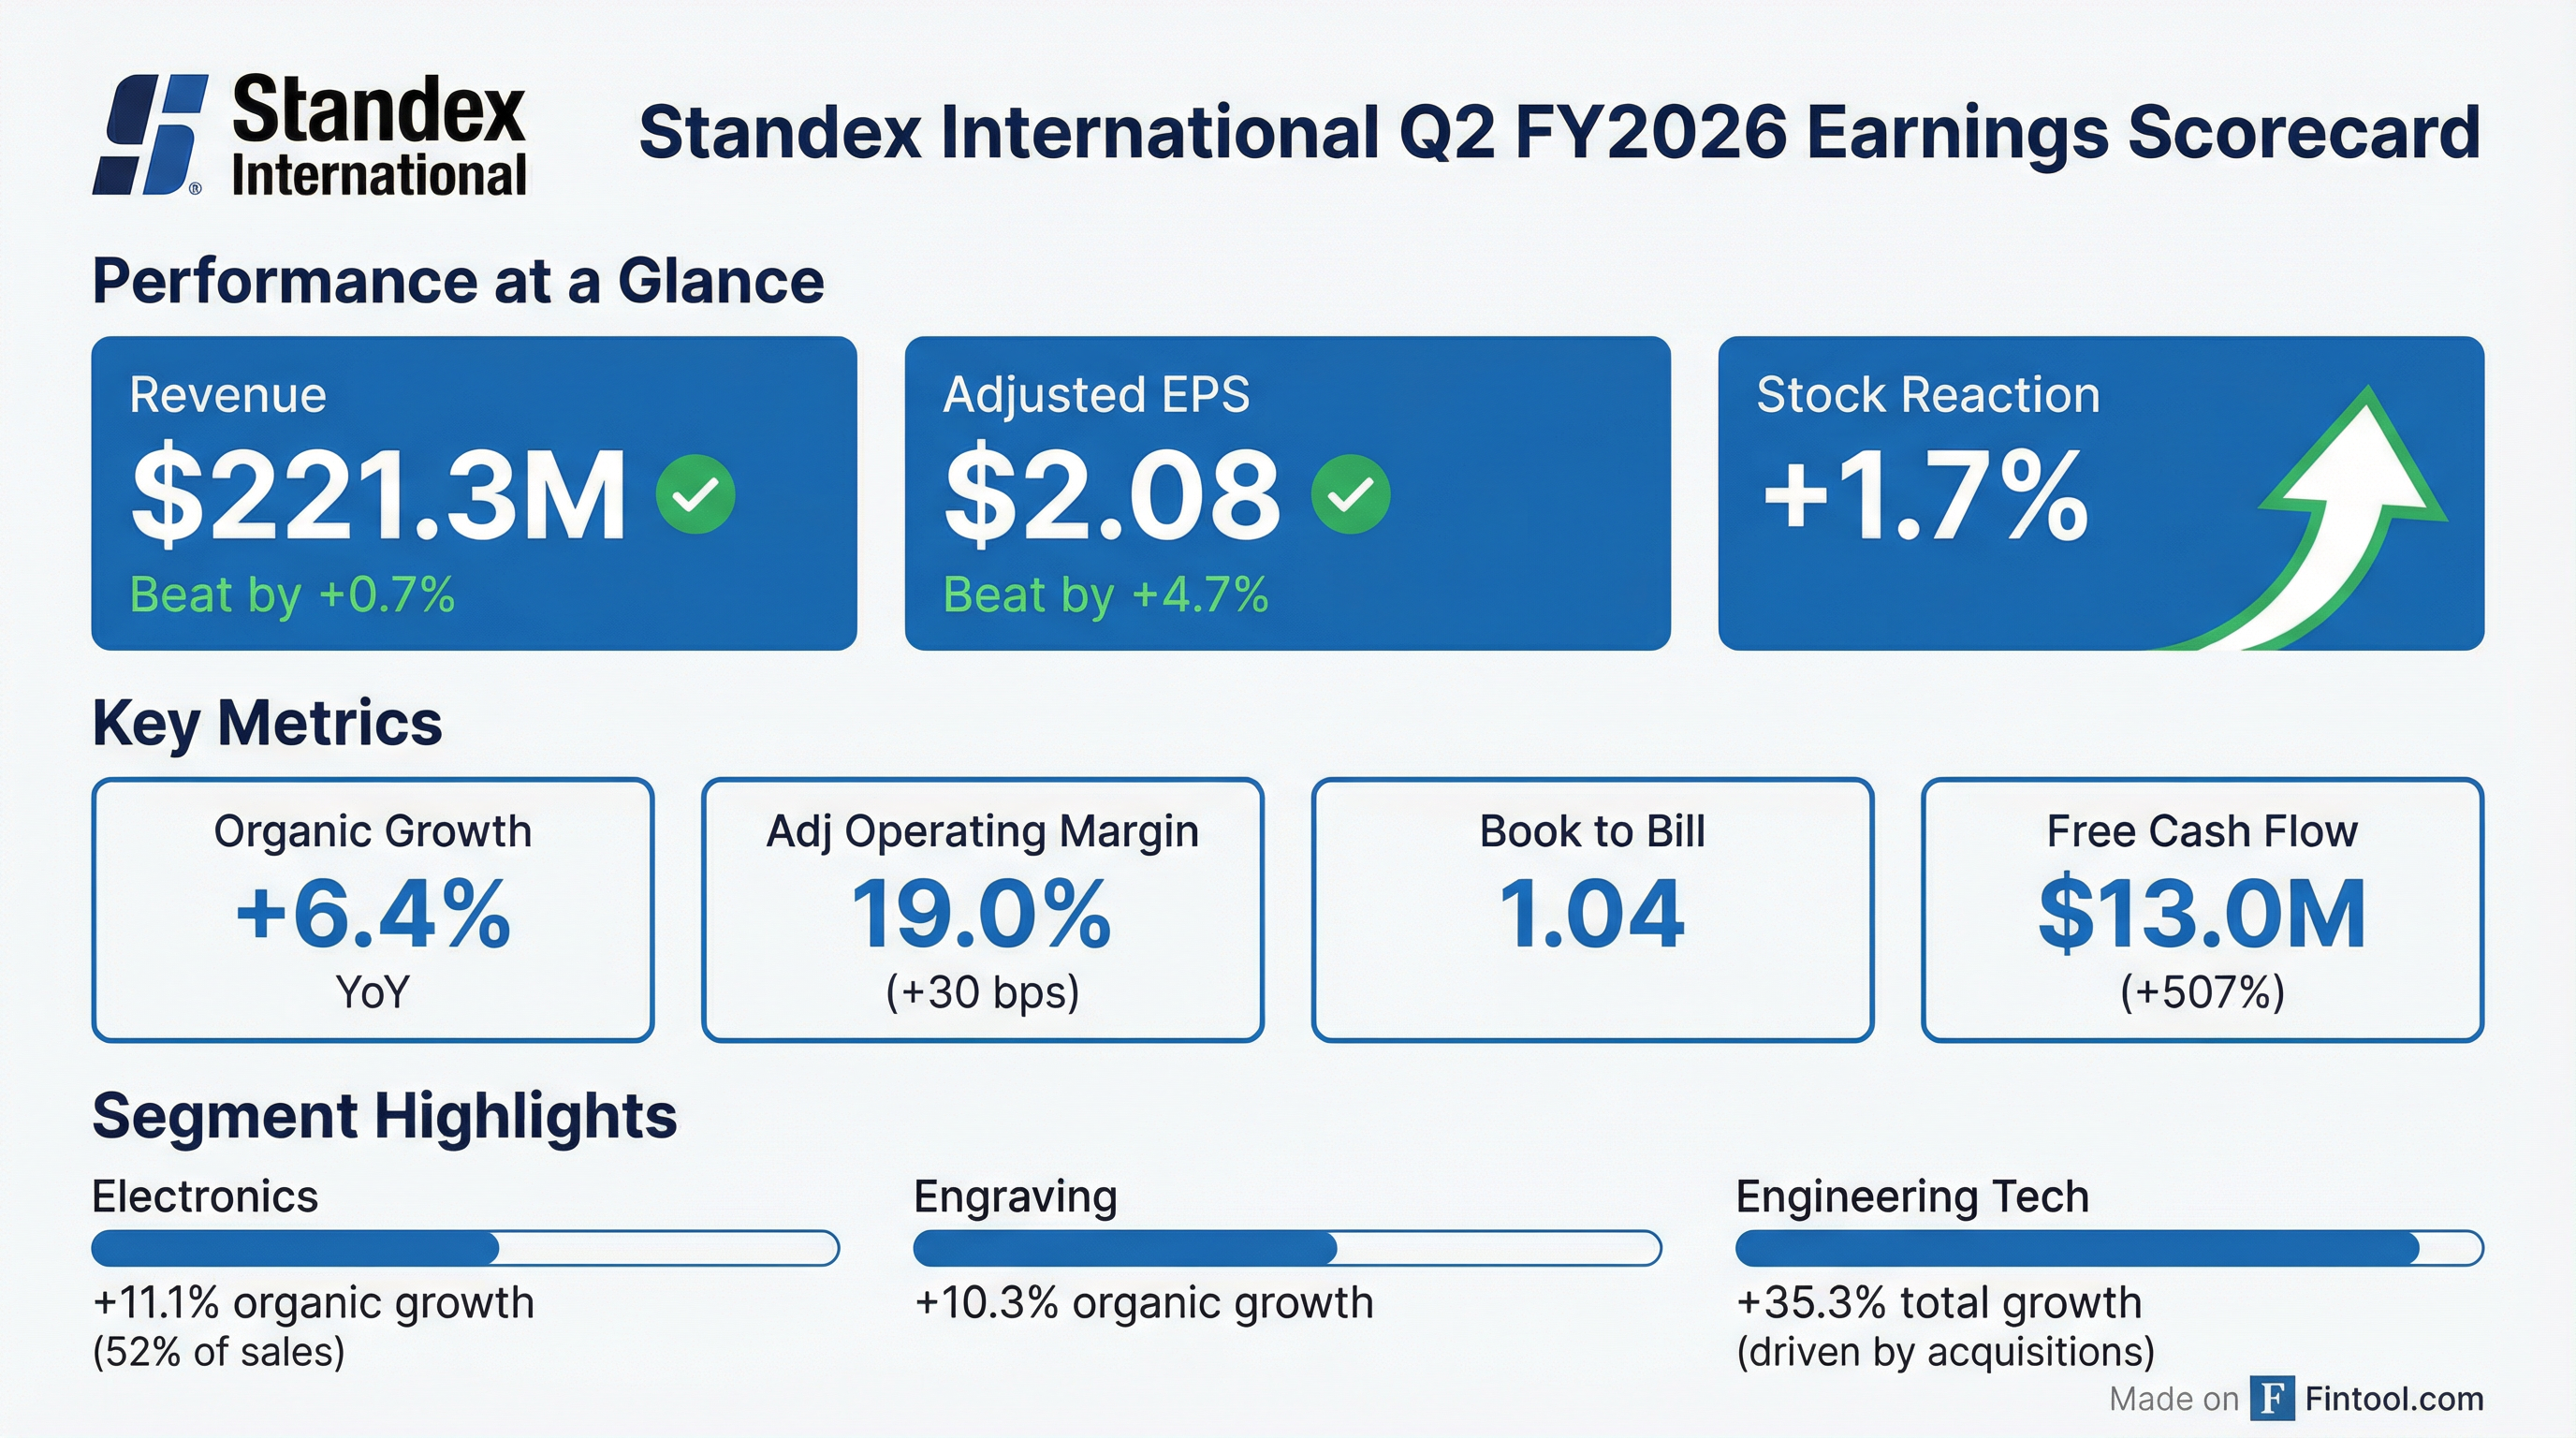
Standex International (NYSE: SXI) delivered a solid Q2 FY2026, beating both revenue and EPS estimates on the back of record quarterly orders and accelerating organic growth in its Electronics segment. The diversified industrial company reported revenue of $221.3M (+16.6% YoY) and adjusted EPS of $2.08 (+8.9% YoY), driven by new product momentum and strength in fast growth end markets.
The stock rose +1.7% to $246.19 on the results, trading near its 52-week high of $253.14.
Did Standex Beat Earnings?
Yes — Standex delivered a double beat.
This marks the company's fifth consecutive revenue beat and extends its EPS beat streak to eight quarters.*
*Values retrieved from S&P Global
What Were the Key Highlights?
Record Quarterly Orders: Standex achieved approximately $231M in orders — the highest in company history — with a book-to-bill ratio of 1.04. Electronics book-to-bill reached 1.08, with Grid at ~1.2x and core electronics at ~1.03-1.04x.
Organic Growth Acceleration: Total organic growth of 6.4% was led by Electronics at 11.1% organic, driven by sales into fast growth markets (electrical grid, defense, aviation) and new product launches.
Margin Expansion: Adjusted operating margin expanded 30 basis points YoY to 19.0%, driven by higher volume, pricing initiatives, and favorable product mix.
Deleveraging Progress: The company paid down ~$10M of debt in Q2, reducing net leverage to 2.3x from 2.4x in Q1 FY26.
How Did Each Segment Perform?
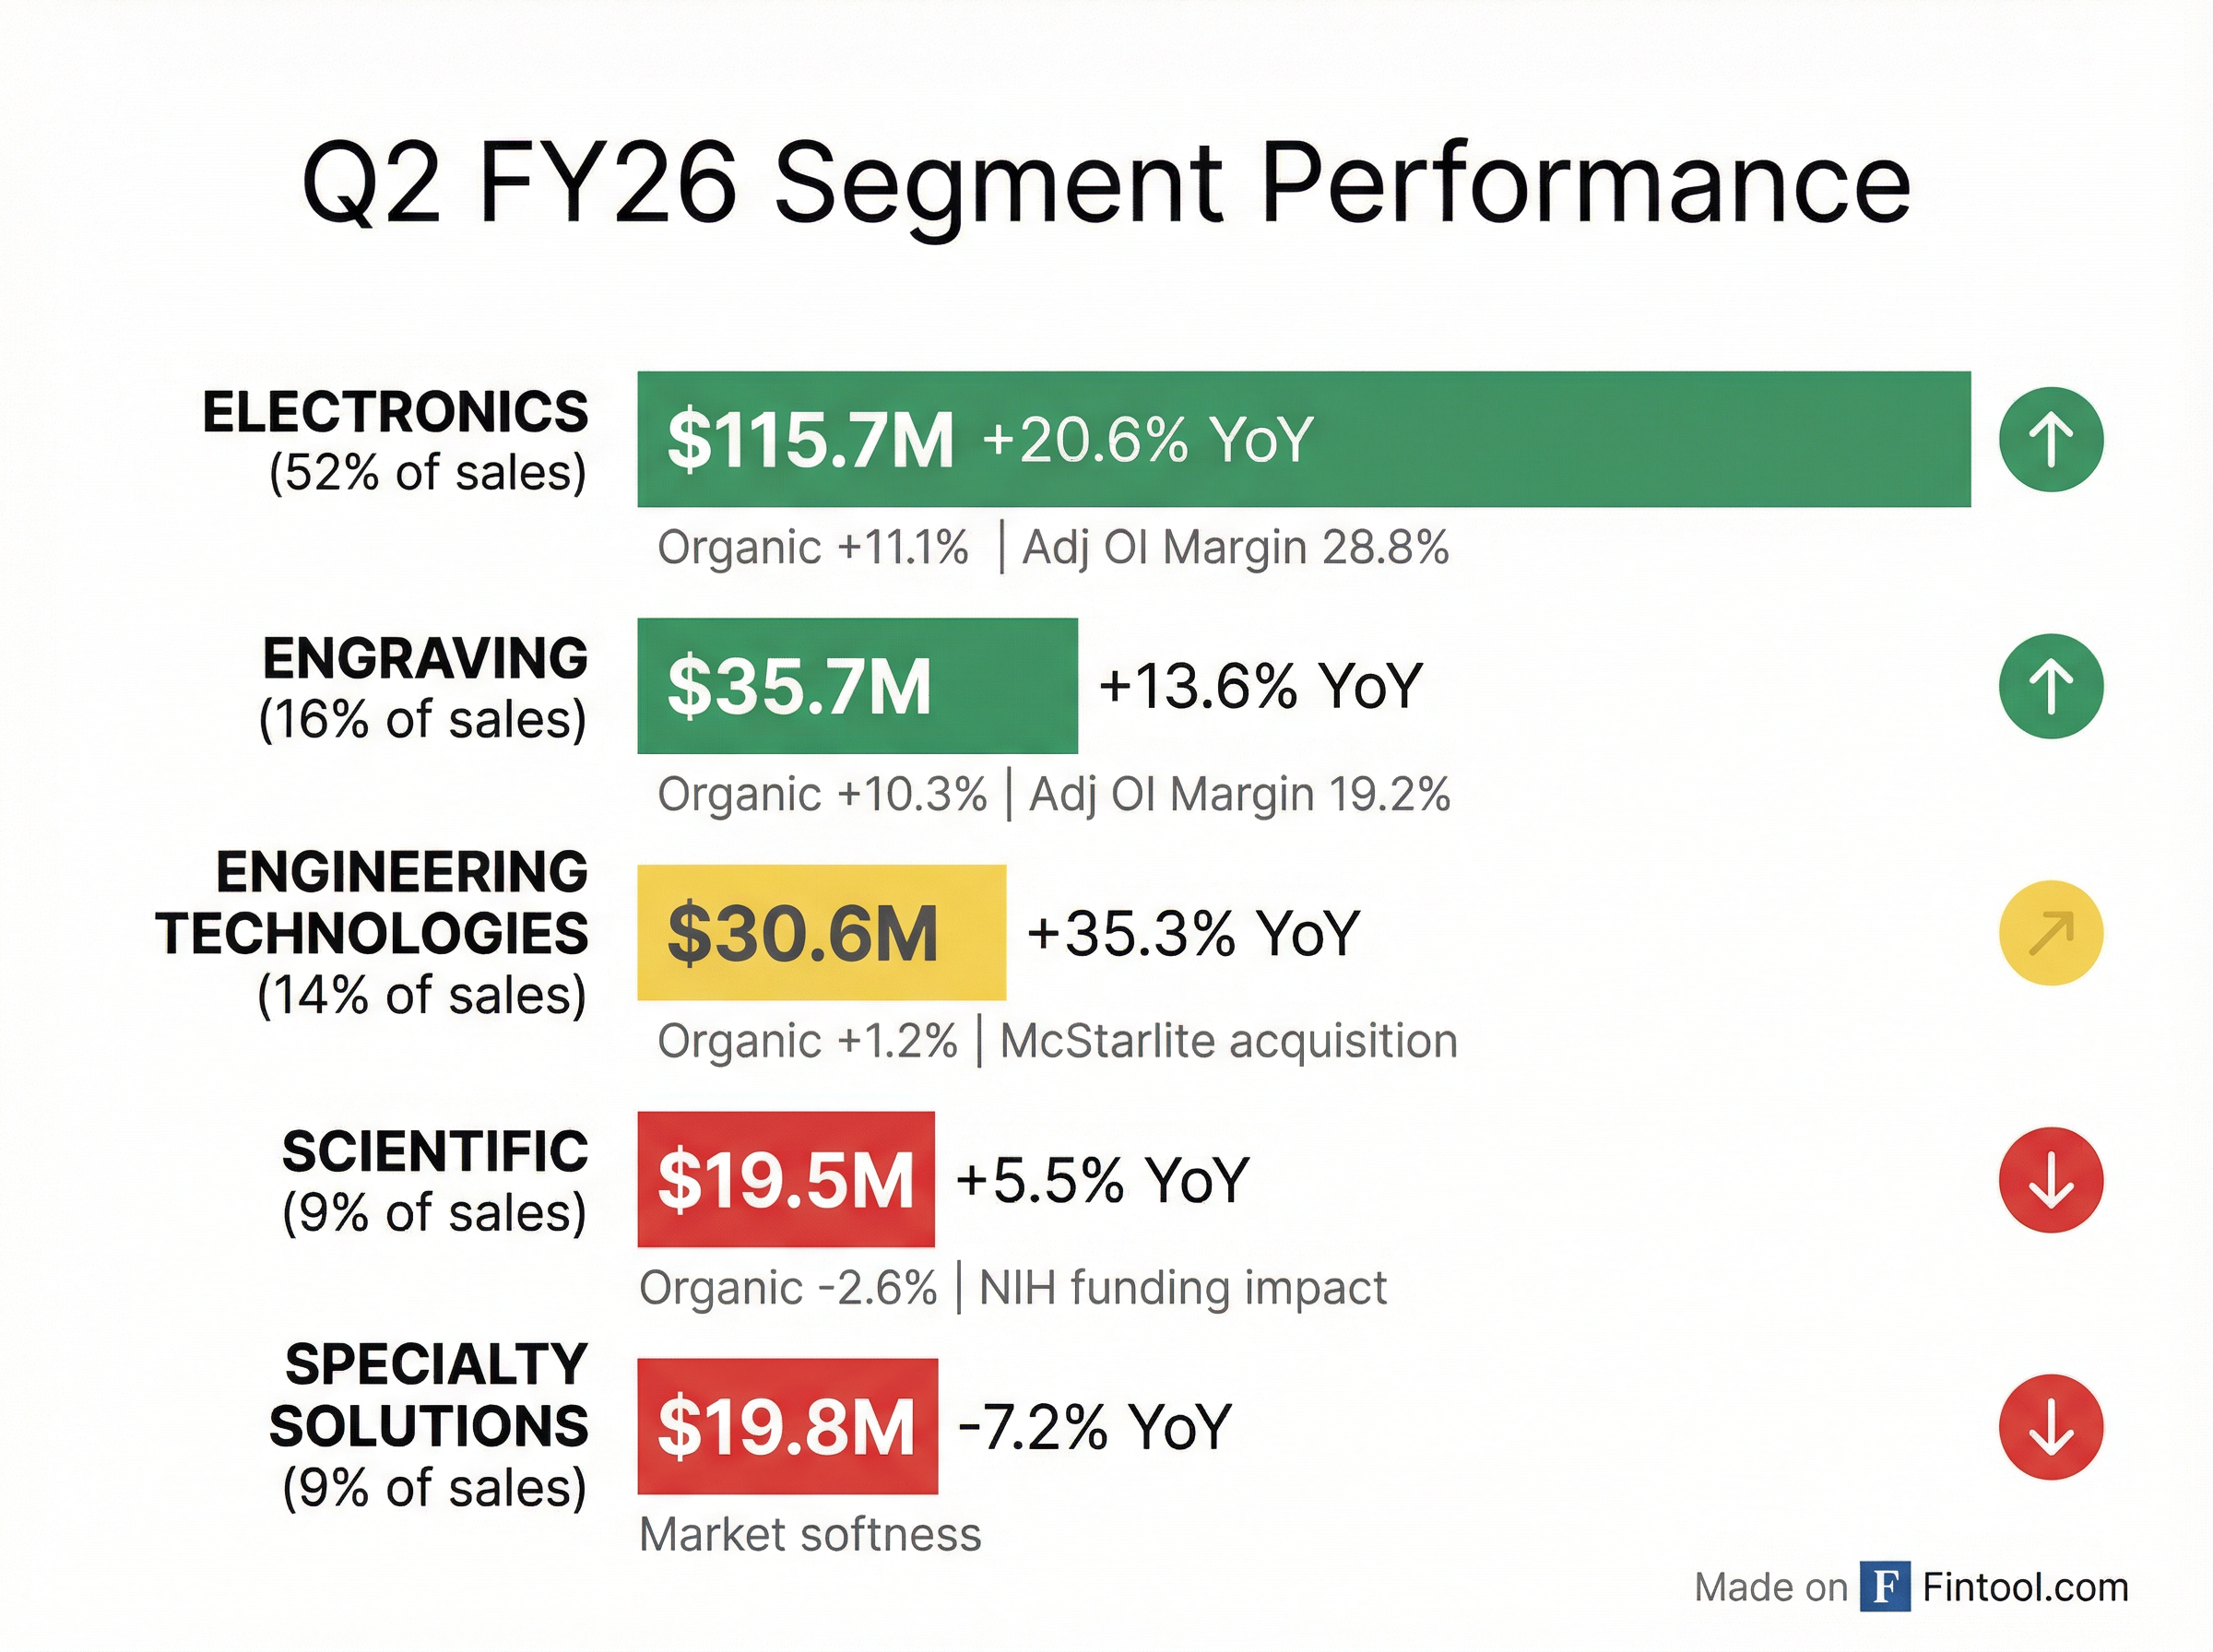
Electronics (52% of sales): The standout performer with 11.1% organic growth, driven by strong demand in electrical grid infrastructure, defense applications, and new product introductions. Orders of ~$125M resulted in a robust 1.08 book-to-bill ratio.
Engraving (16% of sales): Strong rebound with 10.3% organic growth from improved demand in Europe and North America. Margin expansion of 490 bps reflects productivity initiatives and prior restructuring benefits.
Engineering Technologies (14% of sales): Revenue surged 35.3% driven by the McStarlite acquisition (33.4% contribution). Organic growth was modest at 1.2% due to customer project timing delays.
Scientific (9% of sales): Organic decline of 2.6% due to lower demand from academic and research institutions impacted by NIH funding cuts.
Specialty Solutions (9% of sales): Challenged by general market softness, declining 7.2% with significant margin compression.
What Did Management Guide?
Q3 FY26 Outlook:
- Revenue: Significantly higher YoY with mid-to-high single digit organic growth; slightly to moderately higher sequentially
- Adjusted Operating Margin: Slightly higher YoY; slightly to moderately higher sequentially
FY2026 Full Year (Reiterated):
- Revenue growth of >$110M over FY25 (~13% growth)
- Fast growth market sales to grow >45% YoY and exceed $270M
- New product sales raised to $85M (up from prior $78M guide), contributing ~300 bps of incremental growth
- Plan to release >15 new products
- Continued adjusted operating margin expansion
CEO David Dunbar stated: "We are well positioned to deliver mid-to-high single digit organic growth in the fiscal third quarter, primarily driven by new product launches, strong tailwinds in the electrical grid, defense and aviation end markets, and improving general industrial markets."
What Changed From Last Quarter?
Key sequential improvements:
- Organic growth acceleration from 1.3% to 6.4% — the strongest organic growth since Q4 FY25
- Record order intake — highest quarterly orders in company history
- Electronics momentum — organic growth improved from 5.9% in Q1 to 11.1% in Q2
- Free cash flow increased 25% sequentially to $13.0M
How Did the Stock React?
SXI shares rose +1.7% on the day of earnings to $246.19, trading near the 52-week high of $253.14.
The stock has more than doubled from its 52-week low of $128.85, reflecting improved execution, strategic acquisitions, and momentum in fast-growth end markets.
Capital Allocation Update
FY26 Capital Plans:
- CapEx expected between $33-38M (vs $28.3M in FY25)
- Interest expense guided at $7.0-7.5M for Q3 FY26
- ~$28M remaining on share repurchase authorization
- ~$213M of available liquidity
Key Risks and Concerns
-
NIH Funding Impact: Scientific segment faces headwinds from federal research funding cuts, driving 2.6% organic decline
-
Specialty Solutions Weakness: The smallest segment continues to struggle with general market softness, posting -7.2% organic decline and significant margin compression
-
Tariff Exposure: Management noted potential impacts from "unforeseen economic, global trade, or tariffs related disruptions" in their outlook caveat
-
Customer Project Timing: Engineering Technologies organic growth was suppressed by delays in customer project timing
-
Elevated Debt: Net debt of $437.7M and leverage of 2.3x, though improving, remains elevated following recent acquisitions
Forward Catalysts to Watch
-
Electronics Momentum: With 11.1% organic growth and 1.08 book-to-bill (Grid at 1.2x), watch for continued strength in electrical grid infrastructure and defense spending
-
Grid Capacity Expansion: Management targets >2x capacity in 3-5 years via Croatia (ramping now), Mexico, new Houston site (~18 months), and India expansion. "All expansion plans are at the request of customers."
-
New Product Pipeline: 9 of >15 planned products released; raised sales target to $85M — execution drives 300 bps growth contribution
-
Fast Growth Markets: Tracking toward >$270M (45%+ growth) with Grid ~52% of total
-
Deleveraging Progress: Path to sub-2.0x leverage as debt paydown continues
-
M&A Pipeline: Active funnels in Grid expansion, sensor/switch adjacencies, and space market
Q&A Highlights
On Narayan Acquisition Accounting (the $18M non-controlling interest adjustment):
CFO Ademir Sarcevic explained the complexity: When Standex acquired Amran (U.S.) and Narayan (India), they purchased 85% of Amran with cash + 15% with Standex shares, and 90% of Narayan in cash with plans to acquire the remaining 10% with Standex shares. However, Indian government approval for Indian nationals to hold foreign equity was not obtained. Per the purchase agreement, the remaining 10% must now be valued using trailing 12-month EBITDA at a 12x multiple. The large adjustment reflects the "phenomenal performance" of the business since acquisition.
On Grid Competitive Positioning:
CEO David Dunbar: "About 40% of instrument transformers are made by electrical equipment OEMs — GE, Siemens, Schneider, Eaton. They are outsourcing more and more. The other 60%, there are different suppliers in every region of the world... Amran Narayan is quickly becoming a valued partner to the global equipment OEMs." Key differentiators: faster prototypes, faster delivery than internal teams, quality track record, and cost advantage from India supply chain.
On Electronics Segment Breakdown:
Management provided color on the three major pieces:
- Grid business: Growing at historical rates, book-to-bill ~1.2x
- Switches & sensors (reed switches, relays): Growing upper single digits; Asia very strong, Europe picking up, North America flat
- Magnetics (primarily North America): Growing less than mid-single digits
Core electronics (ex-Grid) grew mid-single digits organically. The Grid business pushed total segment organic growth above 10%.
On Fast Growth Markets Breakdown ($270M+ target):
Grid represents ~52% of fast growth market sales.
On Capacity Expansion Timeline:
Since acquisition, Amran/Narayan capacity has increased ~50% through additional shifts, Lean initiatives, and some automation (from ~$100M to ~$150M). Over the next 3-5 years, Standex plans to more than double capacity through:
- Croatia site (now ramping, machinery being installed)
- Mexico plant expansion (machinery being moved in)
- Houston site (new larger facility in ~18 months)
- India expansion
- Continued Lean and automation
CEO: "All the expansion plans we're talking about are really at the request of customers. We don't have to go prospecting for business."
On M&A Pipeline:
Management outlined three focus areas:
- Grid expansion: Acquiring other instrument transformer makers or products requested by OEM customers like Schneider and Eaton
- Legacy electronics: Expanding sensor/switch capabilities to offer broader component solutions
- Space: Building capabilities in the emerging commercialization of space market — "not just putting satellites in orbit anymore... there's gonna be a lot going on up there"
On What Could Go Wrong:
CEO Dunbar was candid: "North America is still pretty weak... In terms of what could go wrong, if we don't see a pickup in North America, that would be a [concern]." General industry markets remain soft, visible in Specialty Solutions and parts of legacy electronics. The positive: new products and fast growth markets are now overcoming weakness elsewhere.
On Engraving Recovery:
The ~$8M increase in new product sales for FY26 is "almost entirely from the Engraving business" — specifically new soft trim parts using proprietary processes. Traditional engraving: NA bottomed and flat, Europe starting to pick up, programs expected to launch in summer/fall.