Tempus AI (TEM)·Q4 2025 Earnings Summary
Tempus AI Crushes Q4 as Adj. EBITDA Turns Positive, Guides to 25% Growth
February 24, 2026 · by Fintool AI Agent
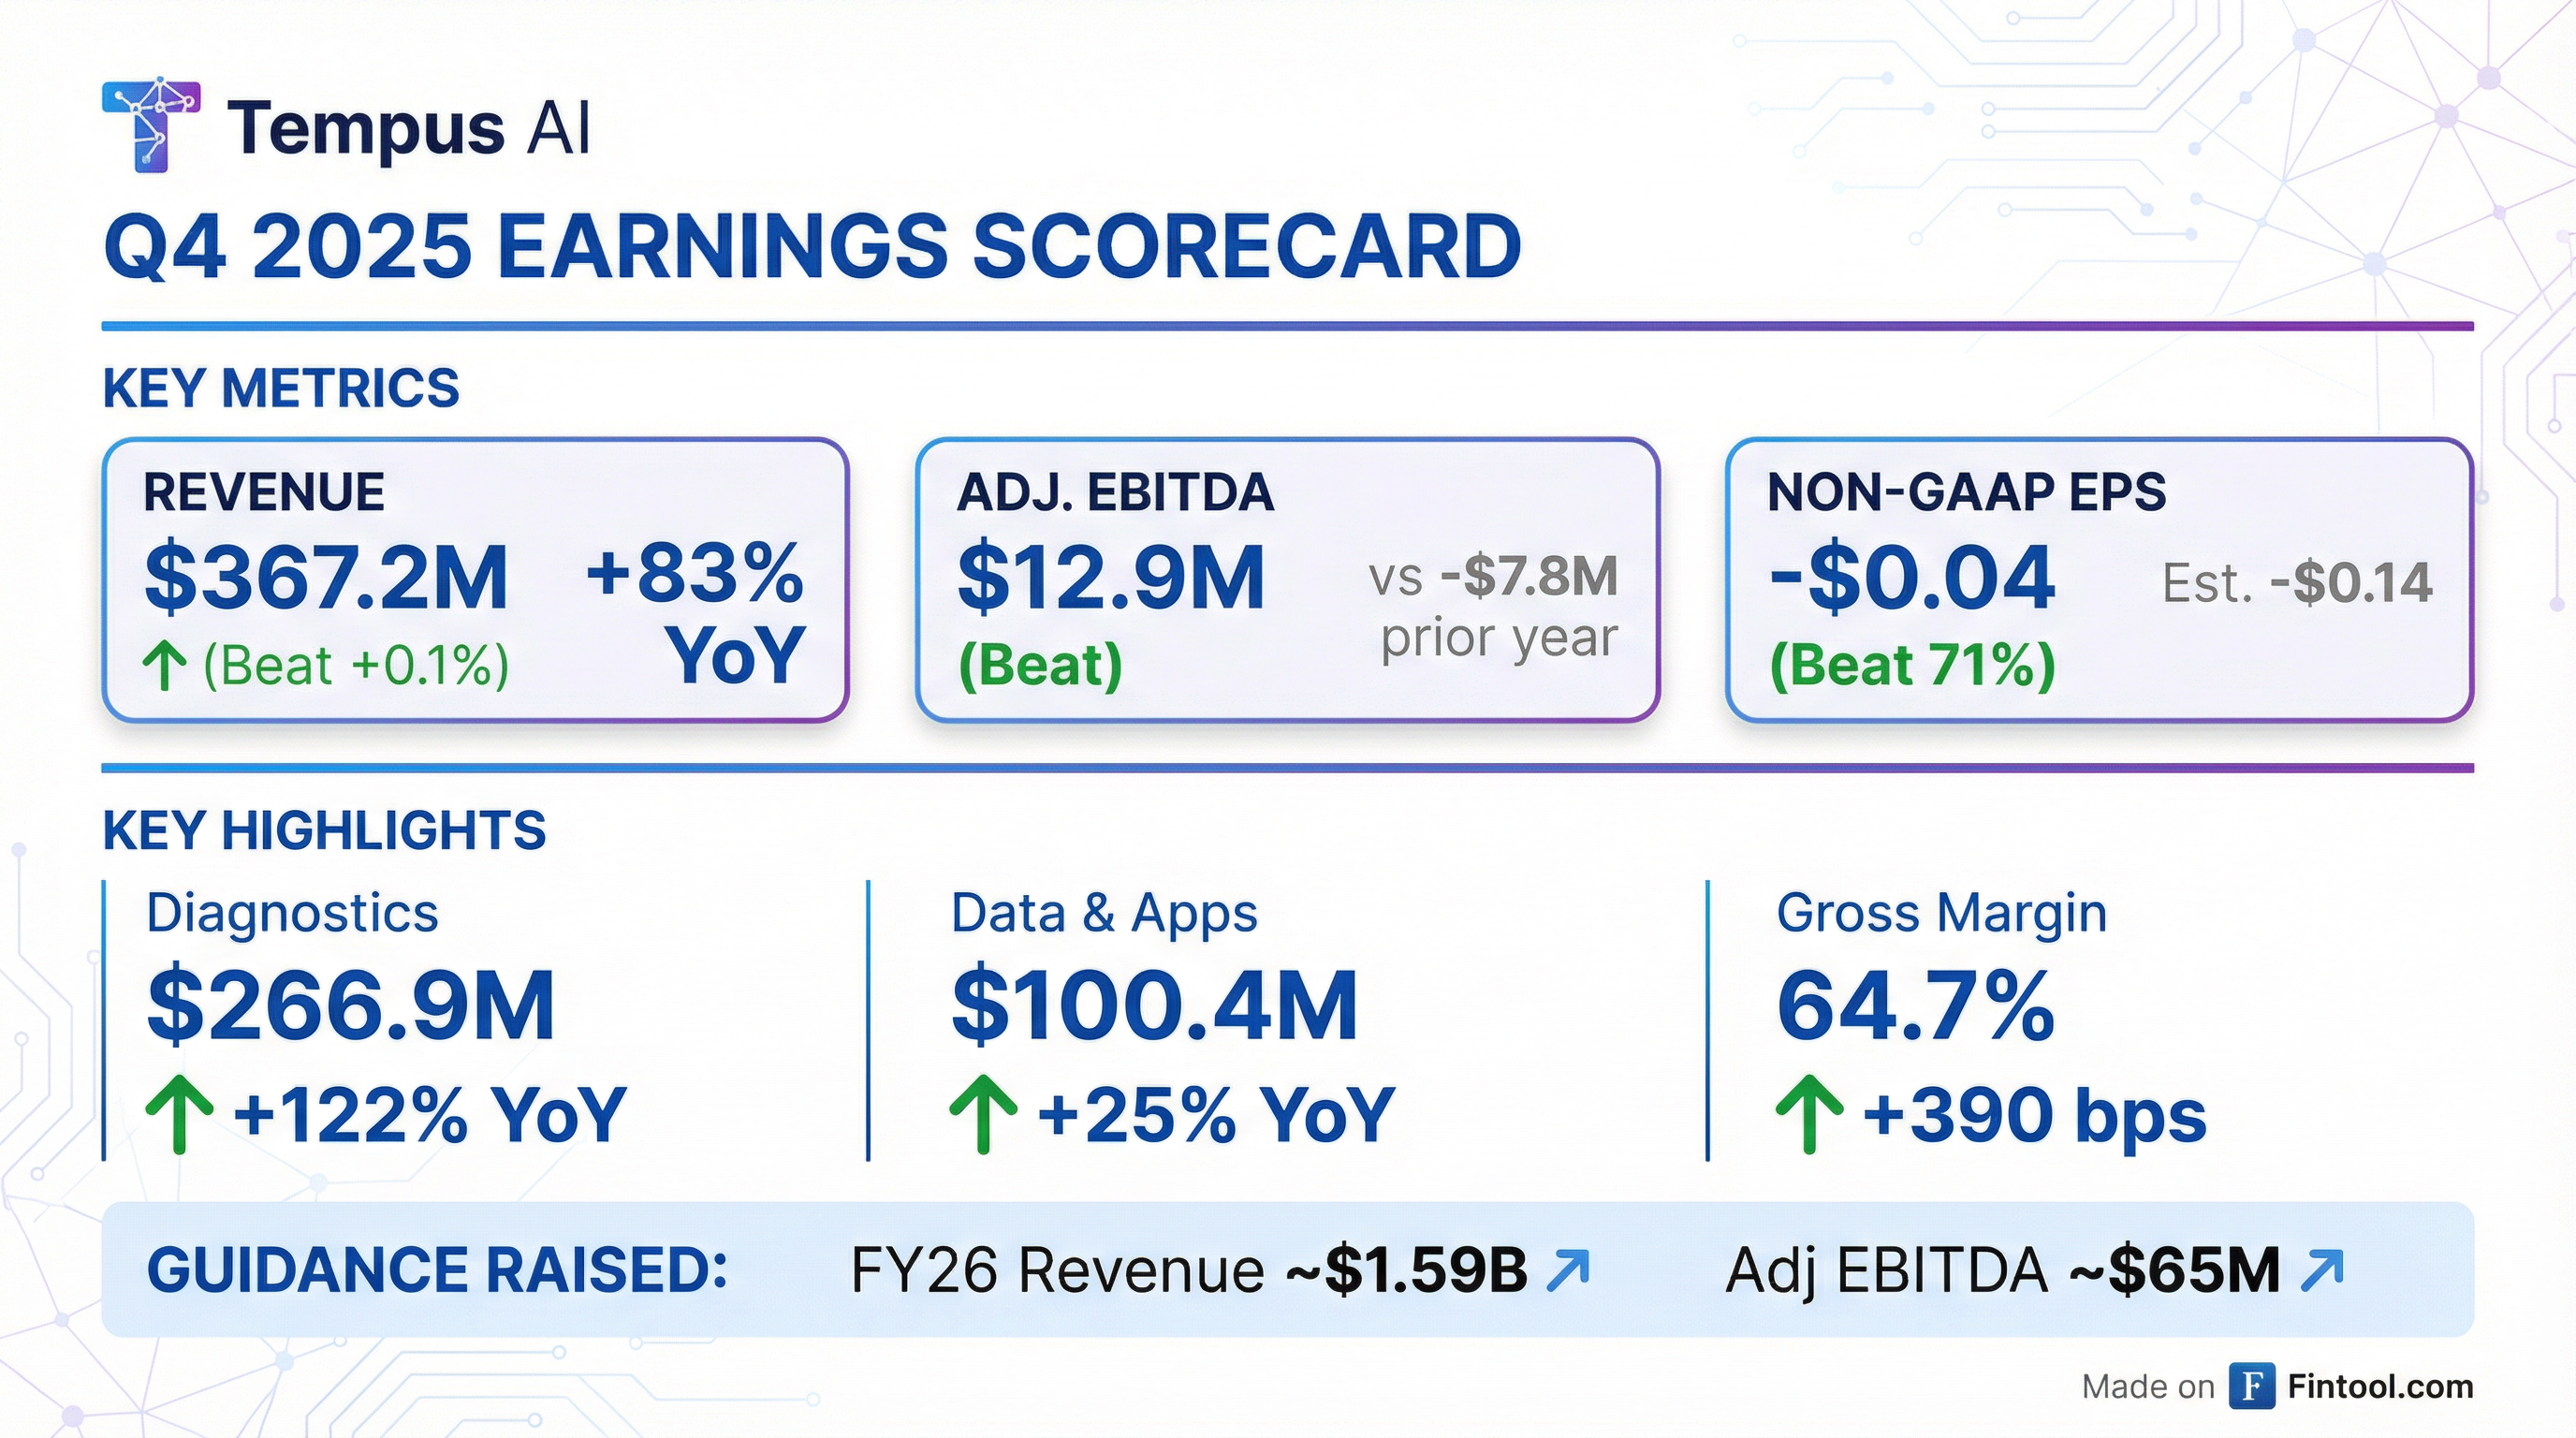
Tempus AI delivered a strong Q4 2025, reporting revenue of $367.2M (+83% YoY) that slightly beat consensus while crushing EPS expectations with a Non-GAAP loss of just $0.04 versus the $0.14 loss expected . The precision medicine company achieved a key milestone with adjusted EBITDA reaching $12.9M—its strongest quarter ever—up from -$7.8M in Q4 2024 . Management guided to 25% revenue growth in 2026 with continued EBITDA expansion, signaling confidence in the durability of its data-driven healthcare platform.
Did Tempus AI Beat Earnings?
Tempus AI beat on all key metrics . The EPS beat was particularly notable—the 71% outperformance reflects the company's operating leverage as it scales. This marks Tempus's third consecutive EPS beat in the last four quarters .
Full Year 2025 Performance:
- Revenue: $1.27B (+83% YoY)
- Gross Profit: $797.9M (+109% YoY)
- Adjusted EBITDA: -$7.4M (improved from -$104.7M in 2024)
What Changed From Last Quarter?
The inflection to meaningful positive adjusted EBITDA marks a structural shift in the Tempus business model. Key changes from Q3 2025:
Key Drivers:
- Oncology ASP expansion: Average revenue per test reached $1,640 in Q4, with a clear pathway to >$2,200 as xT CDx migration and xF FDA clearance drive pricing power
- MRD volume acceleration: 4,700 tests in Q4 (+56% QoQ) signals the emerging MRD opportunity
- Data & Applications scale: Insights revenue grew 69.5% YoY excluding the prior year AstraZeneca warrant impact
How Did the Segments Perform?
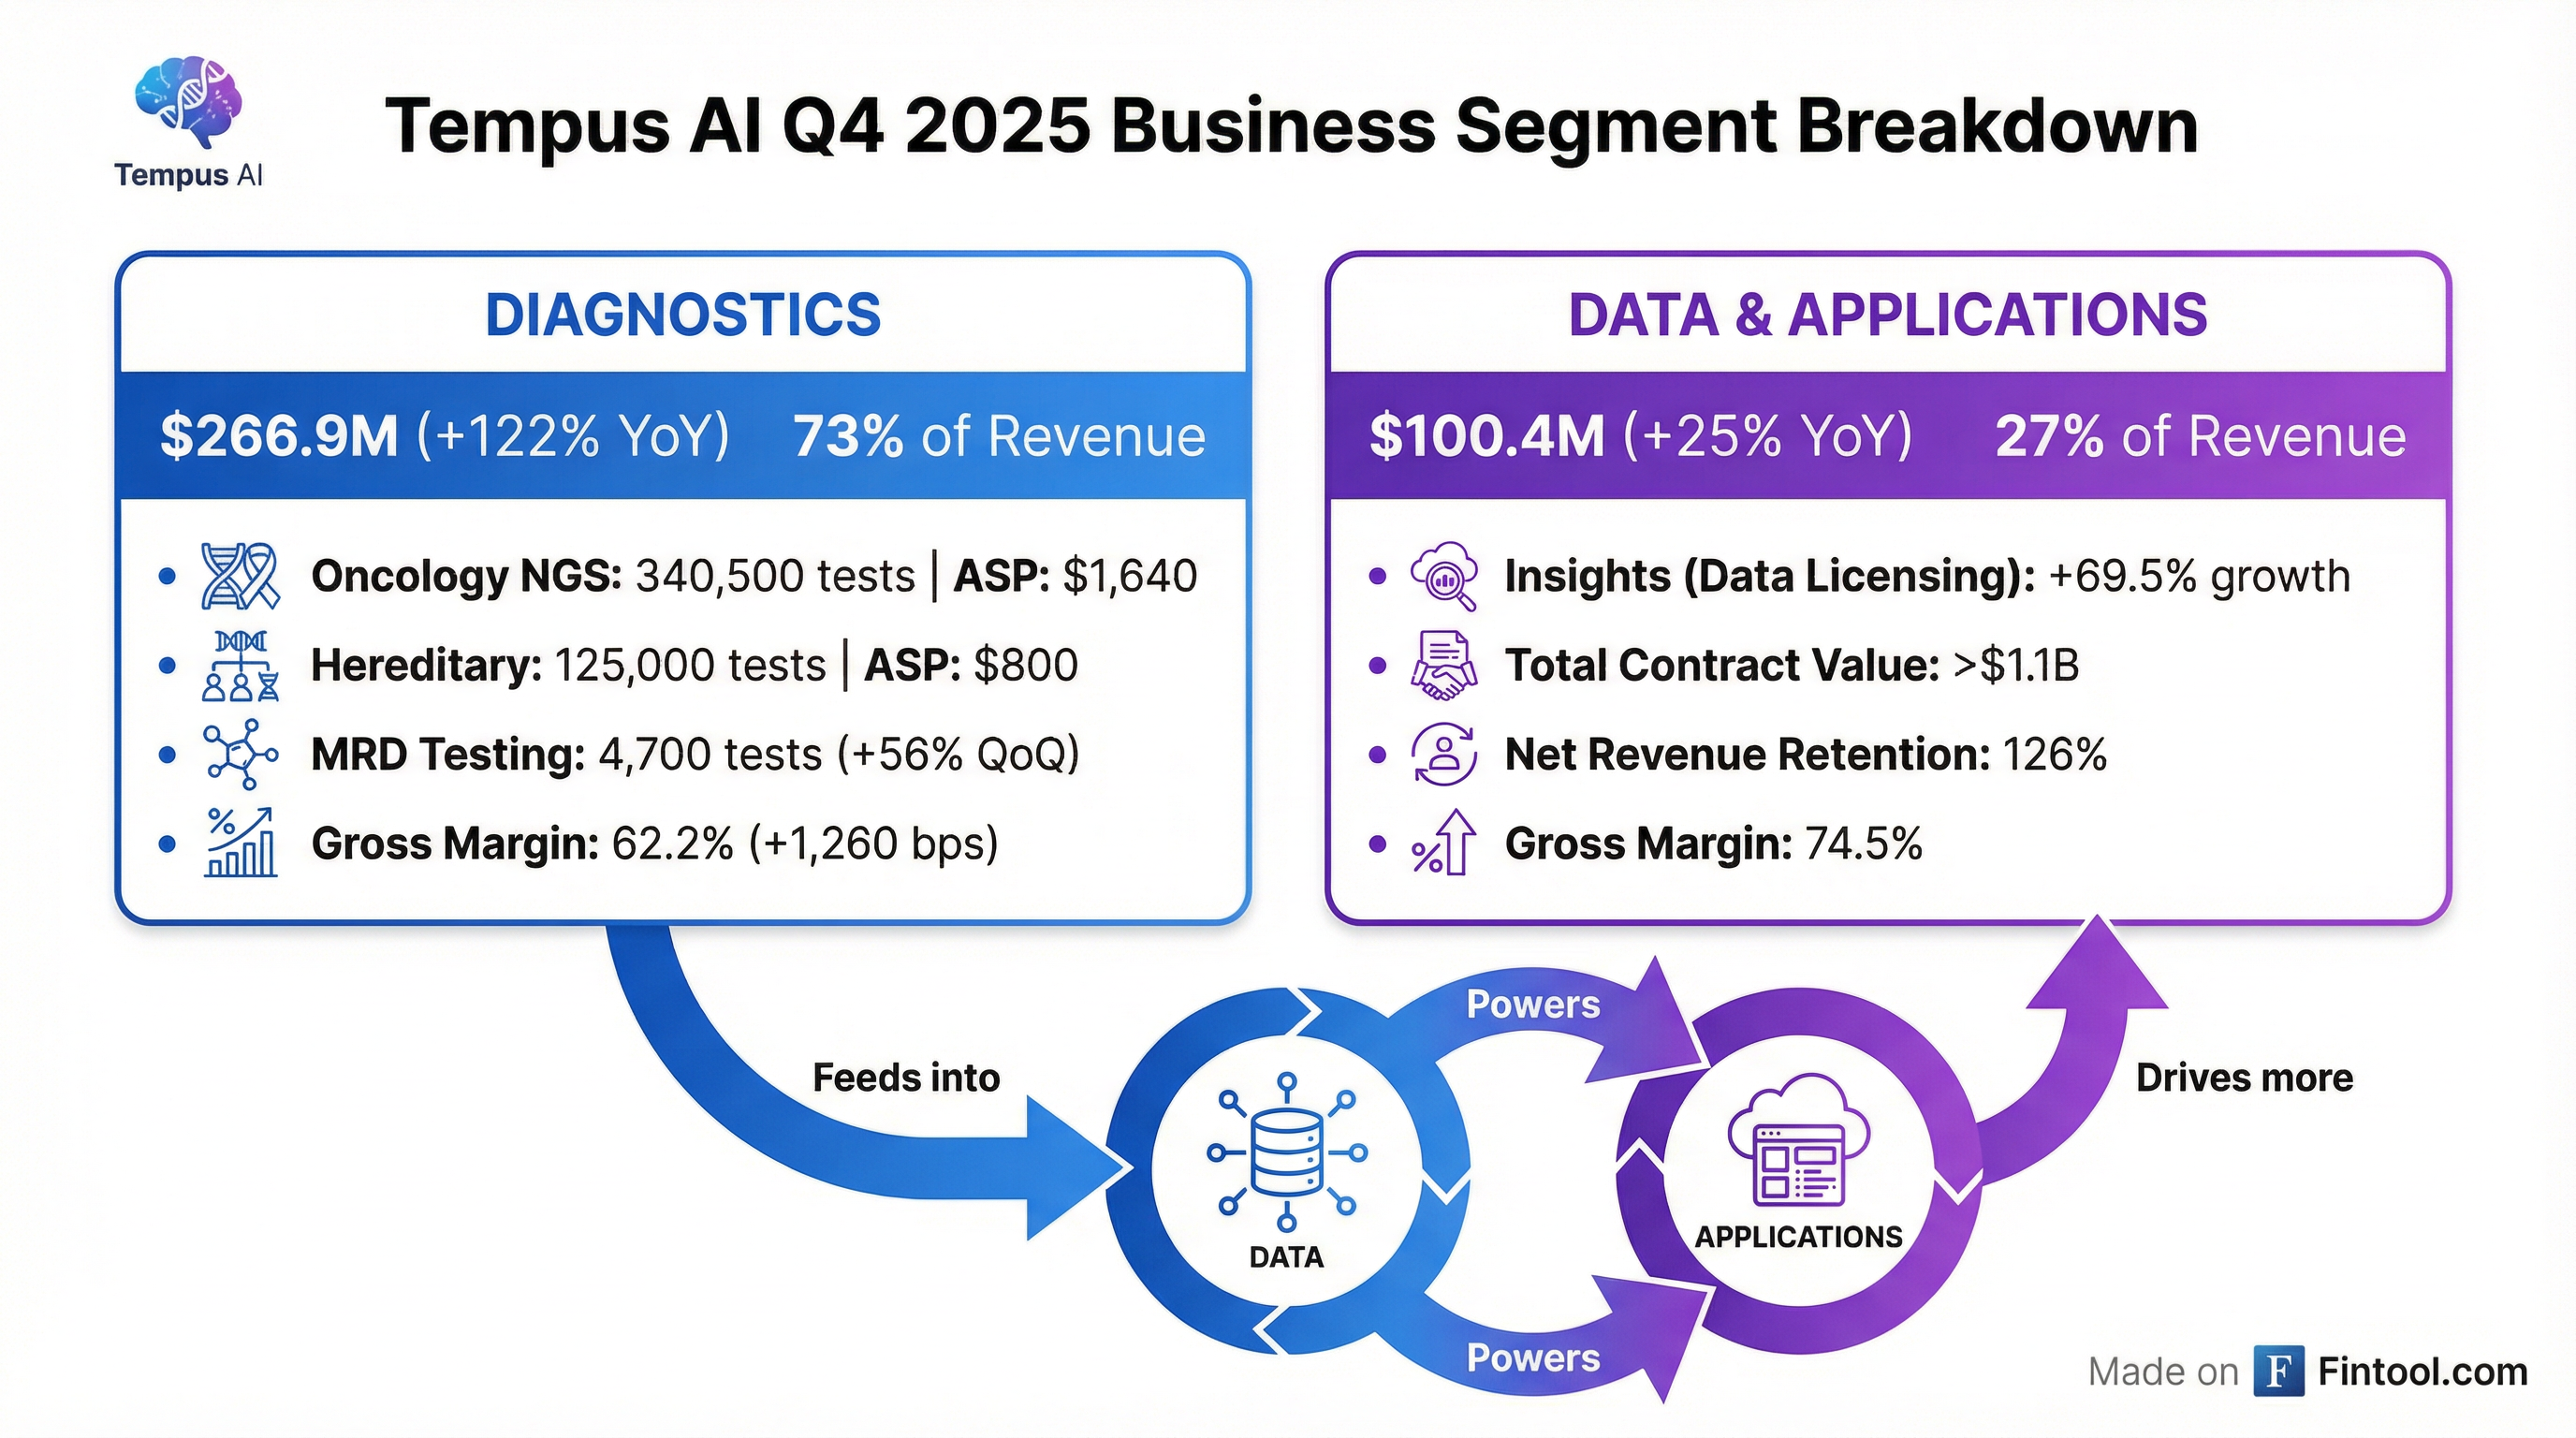
Diagnostics: $266.9M (+122% YoY)
The Diagnostics business drove the quarter, accounting for 73% of revenue :
Key highlights:
- Non-GAAP gross margin improved to 62.2% from 49.6% in Q4 2024
- Paige Predict AI-powered digital pathology launched, analyzing H&E slides to predict 123 biomarkers across 16 cancer types
- Strategic collaborations with NYU Langone Health and Northwestern Medicine announced
Data & Applications: $100.4M (+25% YoY)
Data licensing momentum continued with strong enterprise bookings :
- Insights growth: +69.5% YoY (excluding AZ warrant impact)
- Total Remaining Contract Value: >$1.1B
- Net Revenue Retention: 126%
- Non-GAAP gross margin: 74.5%
The AstraZeneca/Pathos foundation model collaboration continues to drive bookings, with management highlighting the "self-reinforcing platform" that generates proprietary data through diagnostics which feeds the data licensing and AI applications businesses .
What Did Management Guide?
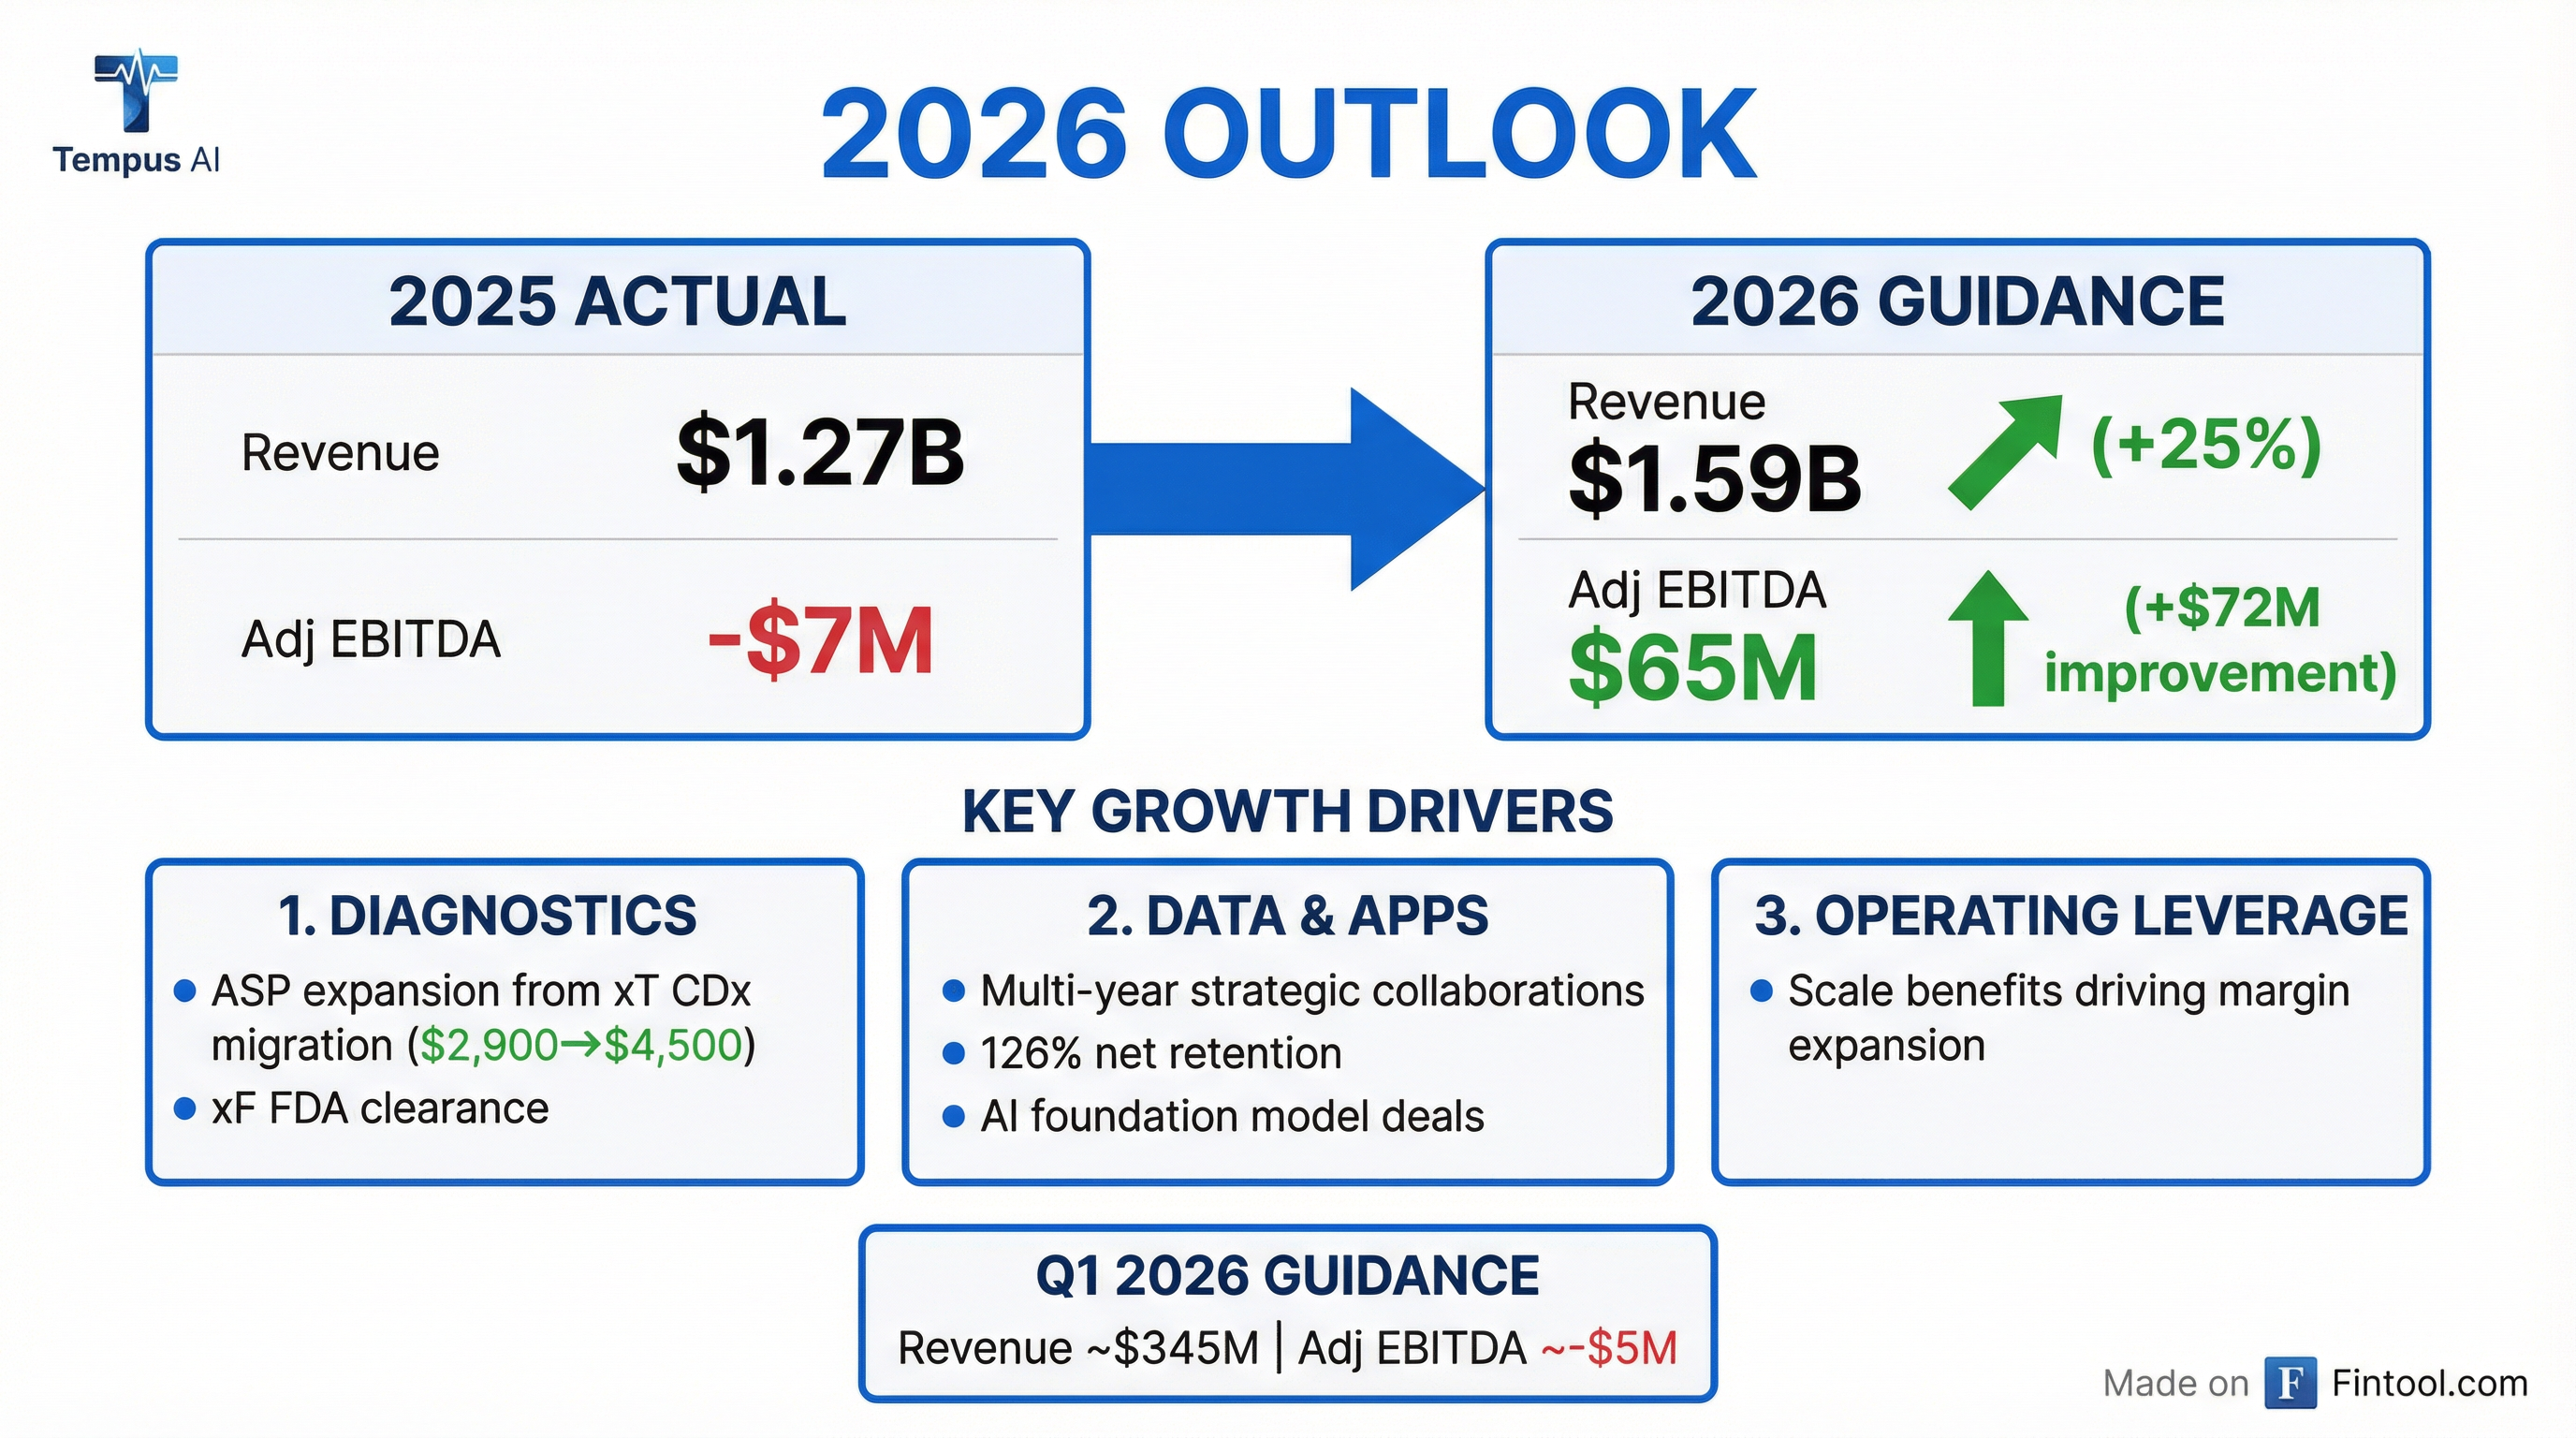
Management provided full 2026 guidance signaling continued strong growth and profitability inflection :
2026 Guidance Components:
- Stock-based compensation: ~$200M
- Interest expense: ~$60M
- D&A: ~$120M
- JV losses: ~$20M
Key ASP Catalysts for Oncology over the next several years :
- xT CDx migration: ~$200 uplift (LDT ~$2,900 → CDx $4,500)
- xF FDA clearance: ~$230 uplift
- Broader commercial coverage: ~$150+ uplift
- Target ASP: >$2,200 (vs $1,640 today)
Management expects "25% top-line growth over the next 3 years" and plans to reinvest the majority of incremental gross profit to accelerate platform expansion while still generating meaningful adjusted EBITDA and free cash flow .
What Are the Key Risks?
-
Hereditary growth moderation: Management expects hereditary testing growth to taper throughout 2026 as it laps market share gains from Q1 2025
-
Q1 EBITDA seasonality: Q1 2026 adjusted EBITDA guided to ~-$5M, with "continued quarter over quarter improvement throughout 2026, similar to previous years"
-
Stock compensation pressure: $200M annual SBC expense remains elevated relative to the company's market cap
-
Macro headwinds: The stock declined 32.9% during Q4 amid trade tensions impacting healthcare technology
Capital Position and Balance Sheet
Tempus ended 2025 with a solid balance sheet :
The company raised $750M in 0.75% convertible notes in 2025 to strengthen liquidity and reduce interest expense .
What's the Investment Case Now?
Bulls will point to:
- Durable 25% growth outlook for 3+ years with visible operating leverage
- ASP expansion runway from xT CDx migration and xF FDA clearance
- Self-reinforcing platform with proprietary data moat
- AI foundation model partnerships with pharma (AstraZeneca, Pathos) validate data value
Bears will point to:
- Premium valuation (5.82x forward P/S vs 5.66x industry average)
- Elevated stock-based compensation (~$200M annually)
- Hereditary growth moderating after market share gains
- 32.9% stock decline in Q4 despite strong fundamentals
Forward Catalysts to Watch
- Q1 2026 results: Hereditary growth trajectory and MRD volume continuation
- xF FDA clearance: Liquid biopsy filing expected, would drive ASP expansion
- Additional pharma partnerships: Data licensing bookings momentum
- Digital pathology traction: Paige Predict adoption driving testing integration
See the full Q4 2025 earnings presentation and explore Tempus AI company profile.