TFS Financial (TFSL)·Q1 2026 Earnings Summary
TFS Financial Beats Q1 as Net Interest Income Surges 11% YoY, Stock Hits 52-Week High
January 29, 2026 · by Fintool AI Agent
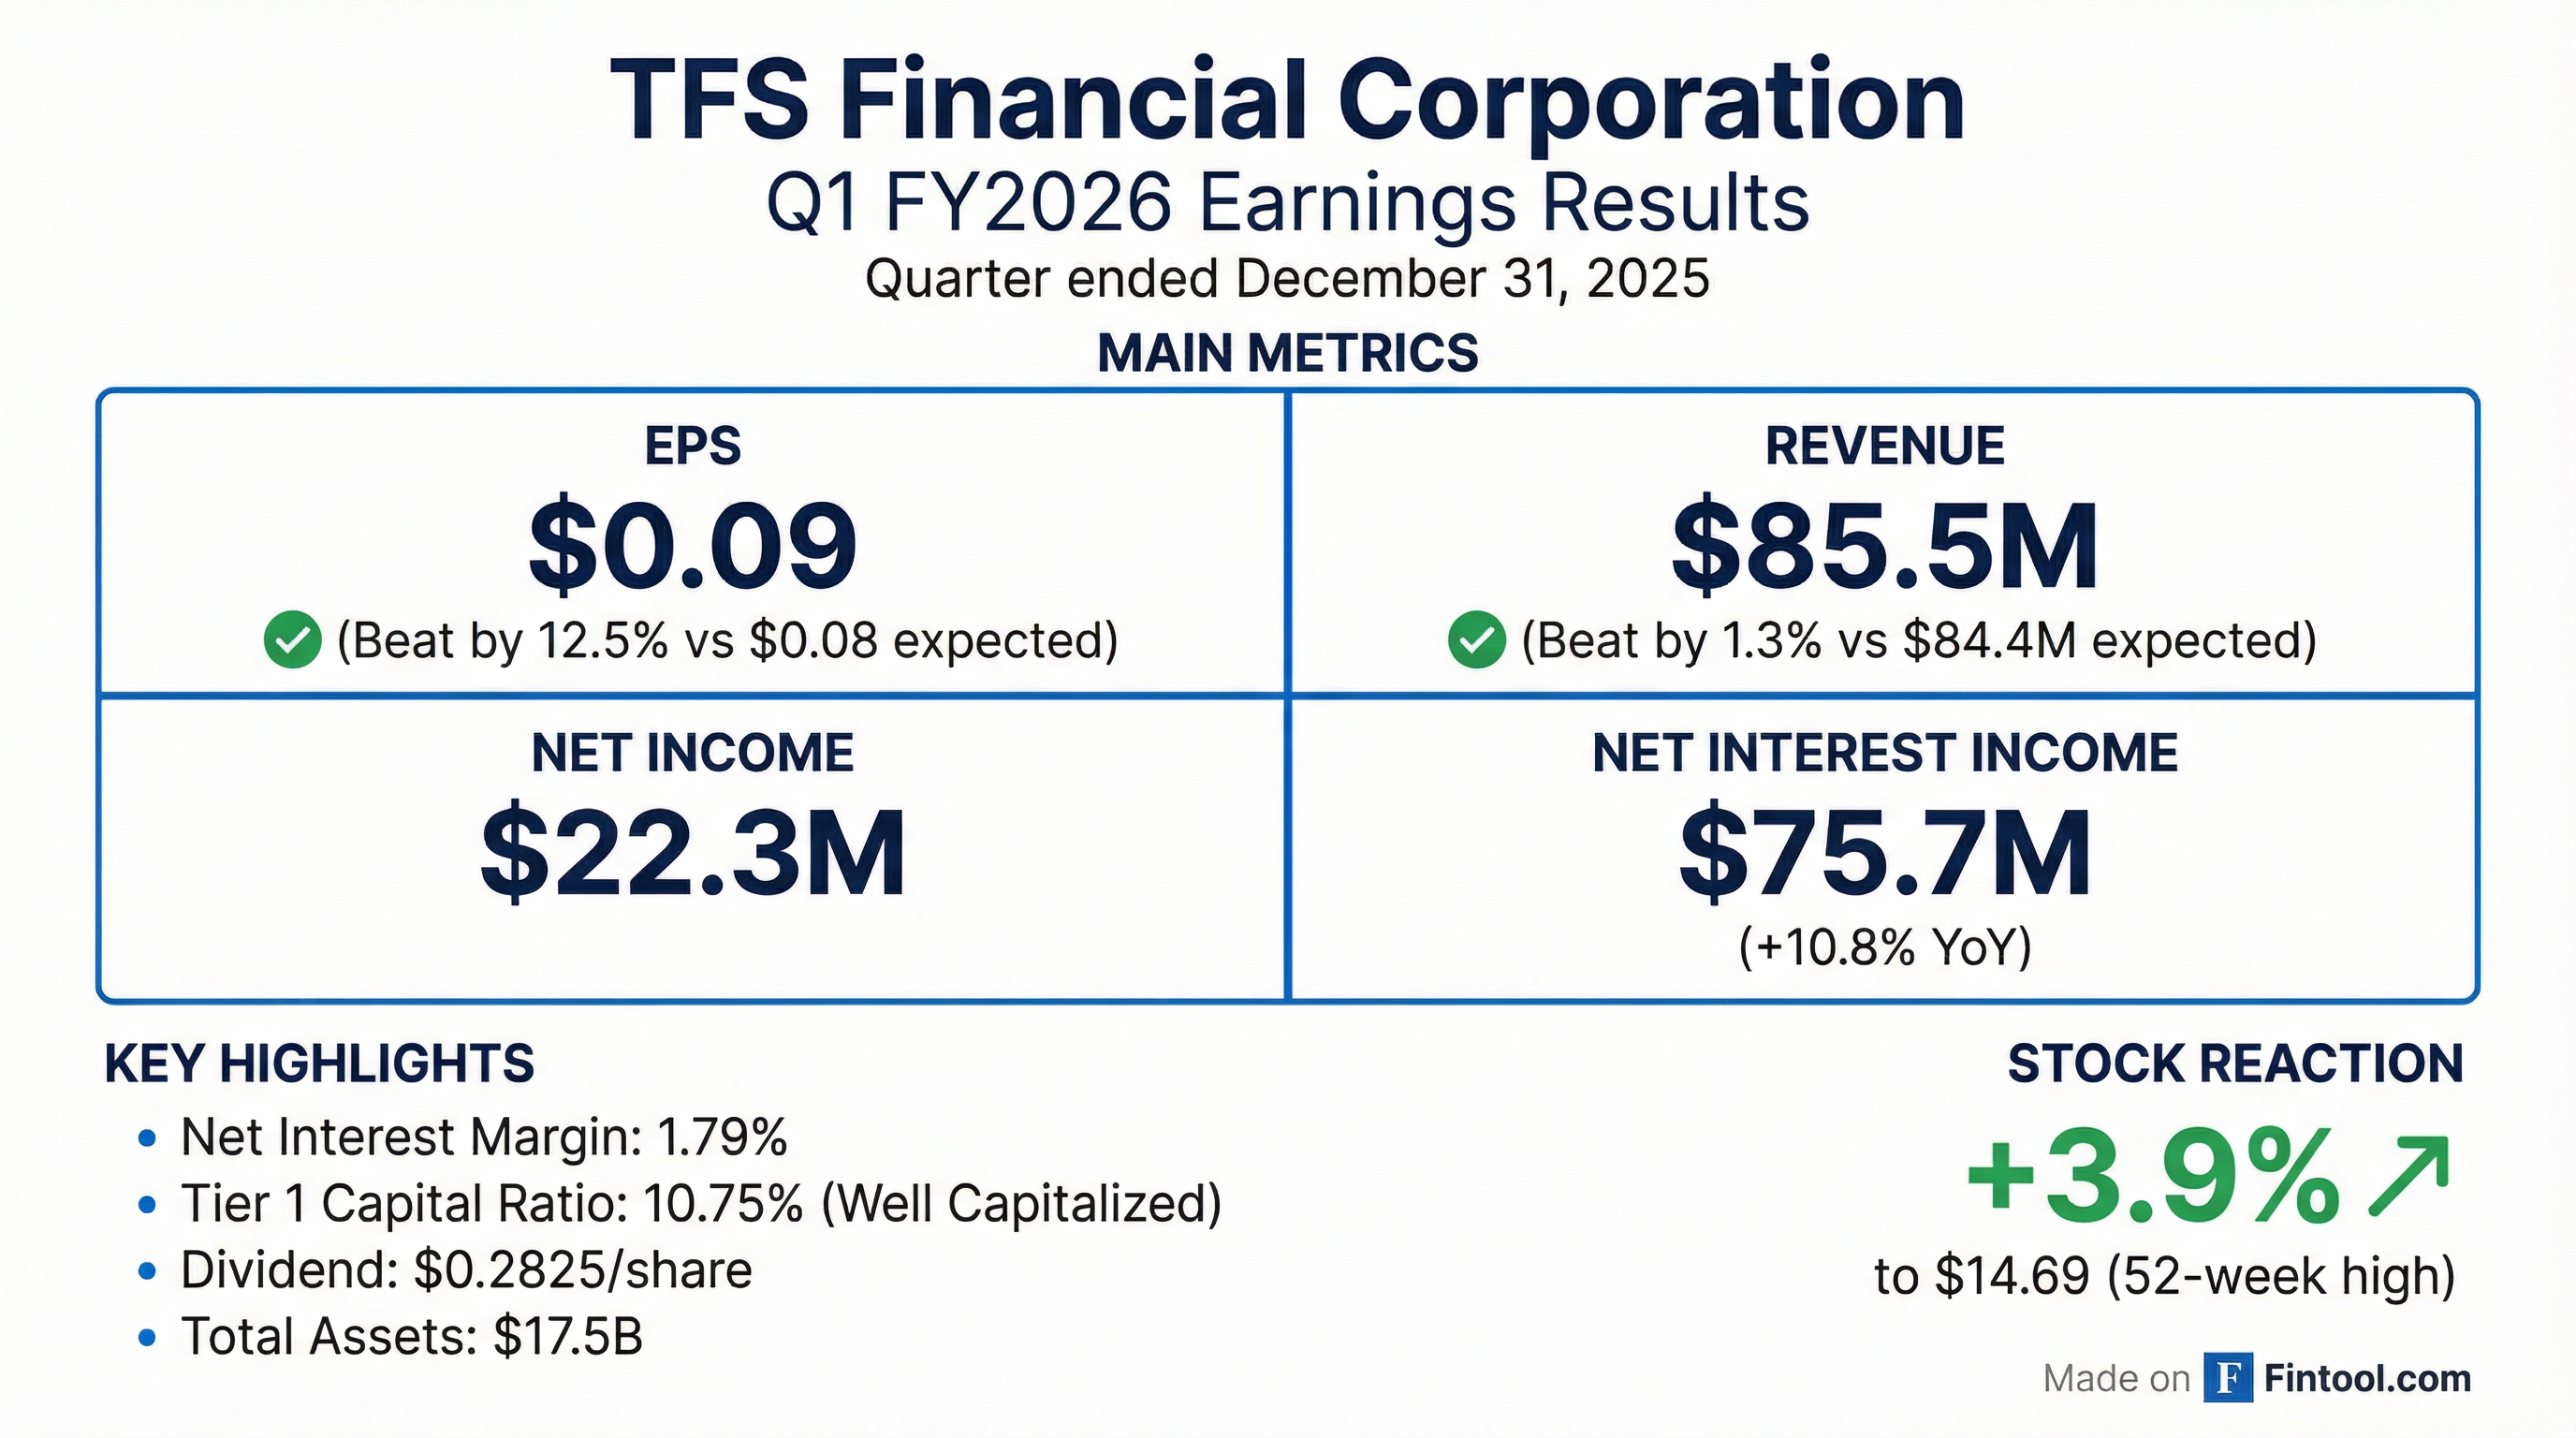
TFS Financial Corporation (NASDAQ: TFSL), the holding company for Third Federal Savings and Loan Association of Cleveland, delivered a solid beat on both earnings and revenue for Q1 FY2026 (quarter ended December 31, 2025). The company reported EPS of $0.09, beating consensus of $0.08 by 12.5%, while revenue of $85.5M topped expectations of $84.4M by 1.3%. Shares surged 3.9% to $14.69, hitting a 52-week high.
Did TFS Financial Beat Earnings?
Yes — beat on both EPS and revenue.
The key driver was net interest income, which increased $7.4 million, or 10.8%, to $75.7 million year-over-year. The interest rate spread improved to 1.47% from 1.34% in the year-ago quarter, and net interest margin expanded to 1.79% from 1.66%.
Beat/Miss History (Last 8 Quarters):
TFS Financial has beaten or met estimates in all 8 quarters, with 5 beats and 3 in-line results.*
How Did the Stock React?
TFSL shares gained 3.9% on January 29, closing at $14.69 — a new 52-week high. The stock has outperformed significantly over the past year, trading near the top of its $11.29-$14.73 range.
Key price levels:
- 52-Week High: $14.73 (reached today)
- 52-Week Low: $11.29
- 50-Day Average: $13.97
- 200-Day Average: $13.39
What Changed From Last Quarter?
Sequential comparison (Q1 FY2026 vs Q4 FY2025):
The sequential decline in net income was driven by:
- Lower net interest income (-$1.6M): Three 25 bps Fed rate cuts reduced yields on home equity lines of credit and cash equivalents
- Higher non-interest expense (+$4.2M): Includes a one-time $1,500 after-tax bonus to all associates (totaling $2.2M) celebrating record FY2025 earnings, plus $1.7M higher marketing costs
Year-over-year tells a different story: Net interest income surged 10.8% ($7.4M) as the company benefited from higher earning asset yields (+15 bps) while keeping funding cost increases contained (+2 bps).
What Did Management Say?
Chairman and CEO Marc A. Stefanski highlighted the company's ability to adapt to the changing rate environment:
"We have had a positive start to our fiscal year as we quickly adapted to three recent Fed rate cuts. Our net interest income increased by $7.4 million over the same period in 2025, and we continue to effectively navigate competition for savings customers while also managing our margin. Our Tier 1 capital ratio of 10.75%, demonstrates our strength and stability as we consistently exceed the amount considered well capitalized."
Note: TFS Financial does not host earnings conference calls, so no Q&A insights are available.
Key Financial Metrics
Balance Sheet Highlights (as of December 31, 2025)
Capital Ratios (Regulatory)
Credit Quality
Credit quality remains stable with minimal delinquencies. The company recorded a $1.0 million release of provision for credit losses during the quarter, compared to a $1.0 million provision expense in Q4 FY2025.
Underwriting Standards:
- Average FICO score of 772 and average LTV of 71% for first mortgage loans originated during Q1 FY2026
- For all active accounts: mortgage loans have average FICO of 761 and LTV of 69%; HELOCs have average FICO of 768 and combined LTV of 60%
- Net recoveries recorded in each of the past nine fiscal years (cumulative $50.2 million)
Loan Origination Activity
First mortgage originations increased 79% year-over-year, with 85% representing purchase transactions (vs. refinancing). The home equity portfolio grew $236.0 million during the quarter, while residential core mortgages decreased $153.9 million.
Loan Portfolio Composition & Yields
By Product Type (as of 12/31/2025):
Geographic Breakdown (1st Lien Residential):
Loan Yield Evolution Since March 2022
The loan portfolio has materially repriced higher as low-yield legacy loans pay down and higher-yielding originations replace them:
Fixed Rate Mortgage Portfolio:
Adjustable Rate Mortgage Portfolio:
ARM Reset Schedule (Interest Rate Sensitivity)
$2.26 billion of ARMs reset in the next 12 months at an average yield of 3.73%. Reset rates are linked to the Prime Rate (currently 6.75% as of 12/31/25).
Recent activity shows approximately 70% of ARMs reset at new rates, 20% re-lock, and 10% refinance.
Capital Allocation
Dividends
- Quarterly dividend: $0.2825 per share declared and paid
- Dividend waiver: Third Federal Savings, MHC (~81% owner) waived its share of dividends, approved by member vote through July 8, 2026
- Remaining waiver capacity: $0.565 per share through July 8, 2026
Share Repurchases
- Q1 FY2026: 139,442 shares repurchased at average cost of $13.66/share ($1.9M total)
- 8th repurchase program: 5,195,356 shares repurchased of 10,000,000 authorized (since January 2017)
MHC Structure: Value to Minority Shareholders
TFS Financial operates under a mutual holding company (MHC) structure where Third Federal Savings, MHC owns ~81% of shares and minority public shareholders own ~19%. The dividend waiver creates significant value for minority shareholders:
Funding Profile
Deposit Composition (as of 12/31/2025):
- 96.1% of deposits are FDIC-insured
- CD portfolio weighted average maturity (WAM): 10.05 months
- $5.61 billion of CDs mature in the next 12 months
- Deposit cost of funds held steady at 2.96%
Borrowings Composition:
Forward Risks
Management highlighted several risk factors in their forward-looking statement disclosure:
- Interest rate sensitivity: Further Fed rate cuts could pressure yields on home equity lines (linked to WSJ Prime Rate)
- Deposit competition: Ongoing initiatives to attract/retain deposit customers increasing marketing costs
- Real estate market conditions: Concentrated exposure to residential mortgages in Ohio and Florida
- Regulatory changes: Basel III capital requirements and dividend waiver approval process
- Government shutdown effects: Current federal shutdown noted as uncertainty factor
Company Overview
Third Federal Savings and Loan Association was founded in Cleveland in 1938 by Ben and Gerome Stefanski, parents of current Chairman and CEO Marc Stefanski. Now in its 88th year of service, the company operates:
- 21 full-service branches in Northeast Ohio
- 2 loan origination offices in Central and Southern Ohio
- 15 full-service branches throughout Florida
- First mortgage and home equity products in 28 states and the District of Columbia through online and customer care center
Efficiency metrics: High average deposits per branch of $280 million and assets per associate of $18.2 million generate operational efficiencies.
Sources: TFS Financial 8-K filed January 29, 2026 ; TFS Financial Q1 FY2026 Investor Presentation ; S&P Global consensus estimates*
*Values marked with asterisk retrieved from S&P Global.