Earnings summaries and quarterly performance for THERMO FISHER SCIENTIFIC.
Executive leadership at THERMO FISHER SCIENTIFIC.
Marc N. Casper
Chief Executive Officer
Frederick Lowery
Executive Vice President
Gianluca Pettiti
Executive Vice President
James R. Meyer
Senior Vice President and Chief Financial Officer
Michel Lagarde
Executive Vice President and Chief Operating Officer
Stephen Williamson
Senior Vice President and Chief Financial Officer
Board of directors at THERMO FISHER SCIENTIFIC.
C. Martin Harris
Director
Debora L. Spar
Director
Dion J. Weisler
Director
James C. Mullen
Director
Jennifer M. Johnson
Director
Karen S. Lynch
Director
Nelson J. Chai
Director
R. Alexandra Keith
Director
Ruby R. Chandy
Director
Scott M. Sperling
Lead Independent Director
Tyler Jacks
Director
Research analysts who have asked questions during THERMO FISHER SCIENTIFIC earnings calls.
Jack Meehan
Nephron Research LLC
8 questions for TMO
Michael Ryskin
Bank of America Merrill Lynch
7 questions for TMO
Tycho Peterson
Jefferies
6 questions for TMO
Dan Arias
Stifel Financial Corp.
4 questions for TMO
Dan Brennan
UBS
3 questions for TMO
Daniel Brennan
TD Cowen
3 questions for TMO
Douglas Schenkel
Wolfe Research, LLC
3 questions for TMO
Rachel Vatnsdal Olson
JPMorgan
3 questions for TMO
Andrew Cooper
Raymond James
2 questions for TMO
Casey Woodring
JPMorgan Chase & Co.
2 questions for TMO
Matthew Sykes
Goldman Sachs Group Inc.
2 questions for TMO
Matt Larew
William Blair & Co.
2 questions for TMO
Patrick Donnelly
Citi
2 questions for TMO
Daniel Anthony Arias
Stifel
1 question for TMO
Michael Leonidovich Ryskin
Bank of America
1 question for TMO
Puneet Souda
Leerink Partners
1 question for TMO
Rachel Vatnsdal
JPMorgan Chase & Co.
1 question for TMO
Recent press releases and 8-K filings for TMO.
- Thermo Fisher Scientific issued $1 billion of 4.215% notes due 2031, $750 million of 4.550% notes due 2033, $1.3 billion of 4.902% notes due 2036 and $750 million of 5.546% notes due 2046 in a public offering under its November 20, 2009 indenture, as supplemented February 12, 2026.
- The notes priced at 100.000% of par for the 2031, 2036 and 2046 tranches (yielding 4.215%, 4.902% and 5.546%, respectively) and 99.783% for the 2033 tranche (yielding 4.586%).
- Net proceeds are expected to be approximately $3.76 billion, intended to fund the pending Clario Holdings acquisition and for general corporate purposes until closing.
- Thermo Fisher Scientific priced a $3.8 billion offering of USD-denominated senior notes in four tranches: $1.0 billion 4.215% due 2031; $750 million 4.550% due 2033; $1.3 billion 4.902% due 2036; and $750 million 5.546% due 2046
- The offering is expected to close on or about February 12, 2026, and the notes will pay interest on a semi-annual basis
- Net proceeds will fund the pending acquisition of Clario Holdings, Inc., with any remaining amounts used for general corporate purposes
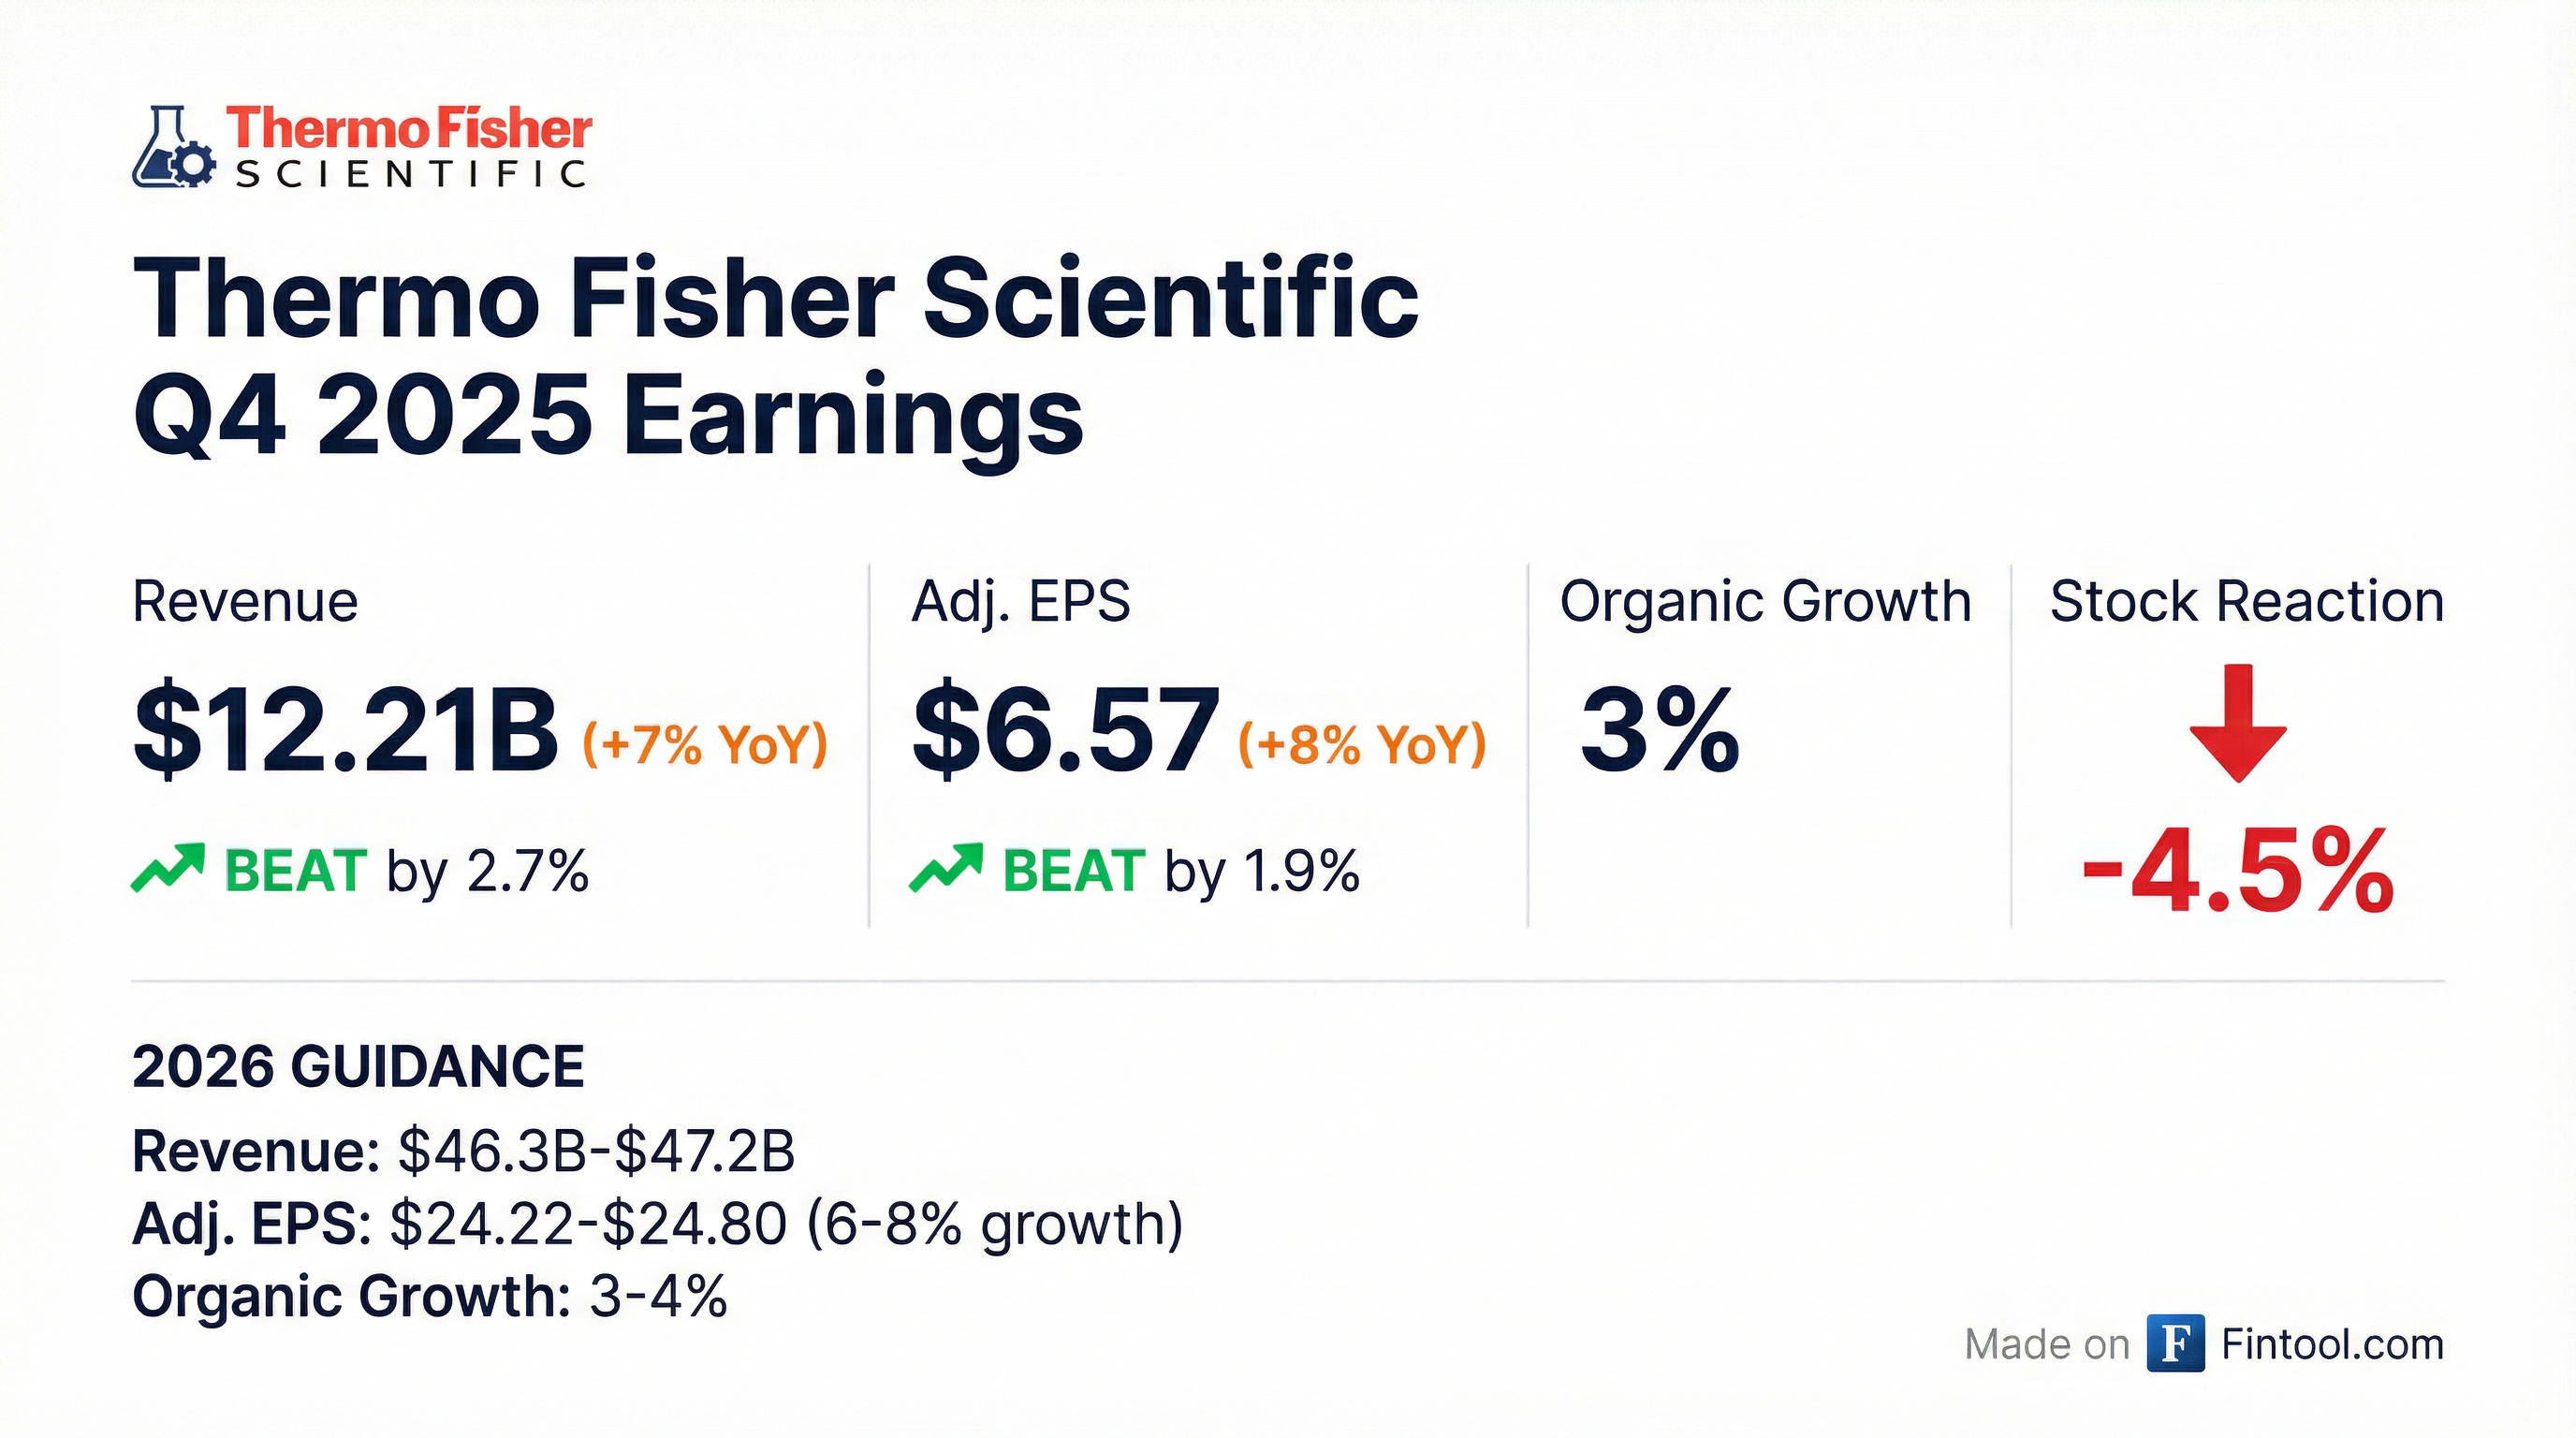
- Thermo Fisher reported Q4 2025 revenue of $12.21 billion (up 7%) and adjusted EPS of $6.57 (up 8%), with full-year revenue of $44.56 billion and adjusted EPS of $22.87.
- 2026 guidance calls for $46.3–$47.2 billion in revenue and adjusted EPS implying about 6%–8% growth, but the profit outlook missed Street expectations and shares fell as much as roughly 4% intraday.
- Management noted robust pharmaceutical demand but flagged softer near-term growth due to cuts and timing in U.S. academic and government research funding; analysts labeled the 1%–2% Q1 organic growth forecast as “soft”.
- CFO Stephen Williamson will retire in March, succeeded by Jim Meyer, and investors are watching the timing of the $9 billion Clario acquisition closing.
- Thermo Fisher delivered Q4 revenue of $12.21 B (+7% Y/Y) and adjusted EPS of $6.57 (+8%), and FY 2025 revenue of $44.56 B (+4%) with adjusted EPS of $22.87 (+5%)
- 2026 guidance: revenue $46.3 B–$47.2 B (+4–6% Y/Y; 3–4% organic) and adjusted EPS of $24.22–$24.80 (+6–8%)
- Announced agreement to acquire Clario (2025 revenue ~$1.25 B), expected to close mid-2026 and be accretive $0.45 to EPS in the first 12 months
- 2025 capital deployment: $16.5 B deployed, including $13 B on M&A and $3.6 B returned to shareholders via buybacks and dividends
- Launched high-impact products in 2025, including Orbitrap Astral Zoom mass spectrometer, Krios 5 Cryo-TEM, EXENT System, and new Oncomine Dx companion diagnostic approvals
- Q4 2025 revenue grew 7% year-over-year to $12.21 billion, with adjusted operating income up 6% to $2.88 billion and adjusted EPS rising 8% to $6.57.
- Full-year 2025 revenue increased 4% to $44.56 billion, adjusted operating income rose 4% to $10.11 billion, and adjusted EPS grew 5% to $22.87.
- 2026 guidance calls for $46.3–47.2 billion in revenue and $24.22–24.80 in adjusted EPS (6–8% growth), based on 3–4% organic revenue growth and 50 bps of margin expansion.
- Capital deployment in 2025 totaled $16.5 billion, including $13 billion for M&A (Solventum filtration, Sanofi sterile fill, Clario) and $3.6 billion returned to shareholders via buybacks and dividends.
- Segment performance in Q4: Life Science Solutions organic +4% (margin 35.5%), Analytical Instruments flat (margin 26.3%), Specialty Diagnostics organic +3% (margin 26.6%), and Lab Products & Biopharma Services organic +5% (margin 14.5%).
- Q4 revenue grew 7% to $12.21 B, with adjusted operating income up 6% to $2.88 B, adjusted operating margin of 23.6%, and adjusted EPS rising 8% to $6.57.
- FY2025 revenue increased 4% to $44.56 B, adjusted operating income grew 4% to $10.11 B, adjusted operating margin was 22.7%, and adjusted EPS was $22.87 (up 5%).
- 2026 guidance: revenue of $46.3 B–$47.2 B (4–6% growth; ~3–4% organic) and adjusted EPS of $24.22–$24.80 (6–8% growth).
- Capital deployment in 2025 included $16.5 B deployed (approx. $13 B M&A; $3.6 B buybacks/dividends), and a definitive agreement to acquire Clario for ~$9 B expected to close mid-2026.
- Thermo Fisher recorded Q4 revenue of $12.21 B, up 7%, with GAAP diluted EPS of $5.21 (+9%) and adjusted EPS of $6.57 (+8%).
- For full-year 2025, revenue was $44.56 B (+4%), with GAAP EPS of $17.74 (+7%) and adjusted EPS of $22.87 (+5%).
- Deployed $16.5 B in capital (including $13 B on M&A) and returned $3.6 B to shareholders via share buybacks and dividends; closed key acquisitions and agreed to acquire Clario in Q4.
- Launched several high-impact products (e.g., Orbitrap Astral Zoom, Krios 5 Cryo-TEM), obtained FDA and 510(k) clearances for diagnostic platforms, and entered a strategic AI collaboration with OpenAI.
- Q4 revenue rose 7% to $12.21 B; GAAP EPS increased 9% to $5.21, and adjusted EPS grew 8% to $6.57.
- Full-year revenue climbed 4% to $44.56 B; GAAP EPS up 7% to $17.74, and adjusted EPS up 5% to $22.87.
- Deployed $16.5 B of capital in 2025, including $13 B on M&A and $3.6 B returned to shareholders via buybacks and dividends.
- Acquired Solventum’s Filtration & Separation business and Sanofi’s Ridgefield site, and agreed to buy Clario to bolster clinical trial data solutions.
- Thermo Fisher delivered $44 billion in revenue in 2025, supported by >120,000 colleagues and $1.4 billion in R&D investment.
- Operational excellence driven by the PPI Business System, including $300 million of cost actions and tariff adjustments to bolster resilience.
- Executed strategic capital deployment: closed the $4 billion Solventum Purification & Filtration acquisition and Sanofi Steriles site, announced the $9 billion Clario deal, and returned capital with $3 billion in share repurchases and $600 million in dividends.
- Outlook for 2026 includes improving demand trends with organic revenue growth progression and strong adjusted EPS growth.
- Delivered $44 billion in revenue, employs 120,000 staff and invests $1 billion annually in R&D in 2025.
- Achieved mid-single-digit organic growth in pharma & biotech (first nine months of 2025) and surpassed an incremental $300 million cost-reduction target.
- Deployed capital through the acquisition of Solventum’s purification & filtration business (approx. $750 million revenue run rate) and a Sanofi fill-finish site, and announced the $9 billion Clario acquisition.
- Forecasts 3 %–6 % organic top-line growth for 2026, with a long-term target of returning to 7 %+ growth and 50–70 bps of annual margin expansion.
- Serves four end markets—56 % of 2025 revenue from pharma & biotech—within a $270 billion addressable market and holds ~20 % market share.
Quarterly earnings call transcripts for THERMO FISHER SCIENTIFIC.
Ask Fintool AI Agent
Get instant answers from SEC filings, earnings calls & more