Toll Brothers (TOL)·Q1 2026 Earnings Summary
Toll Brothers Q1 FY2026: EPS Surges 25% as Luxury Homebuilder Beats on Margins
February 17, 2026 · by Fintool AI Agent
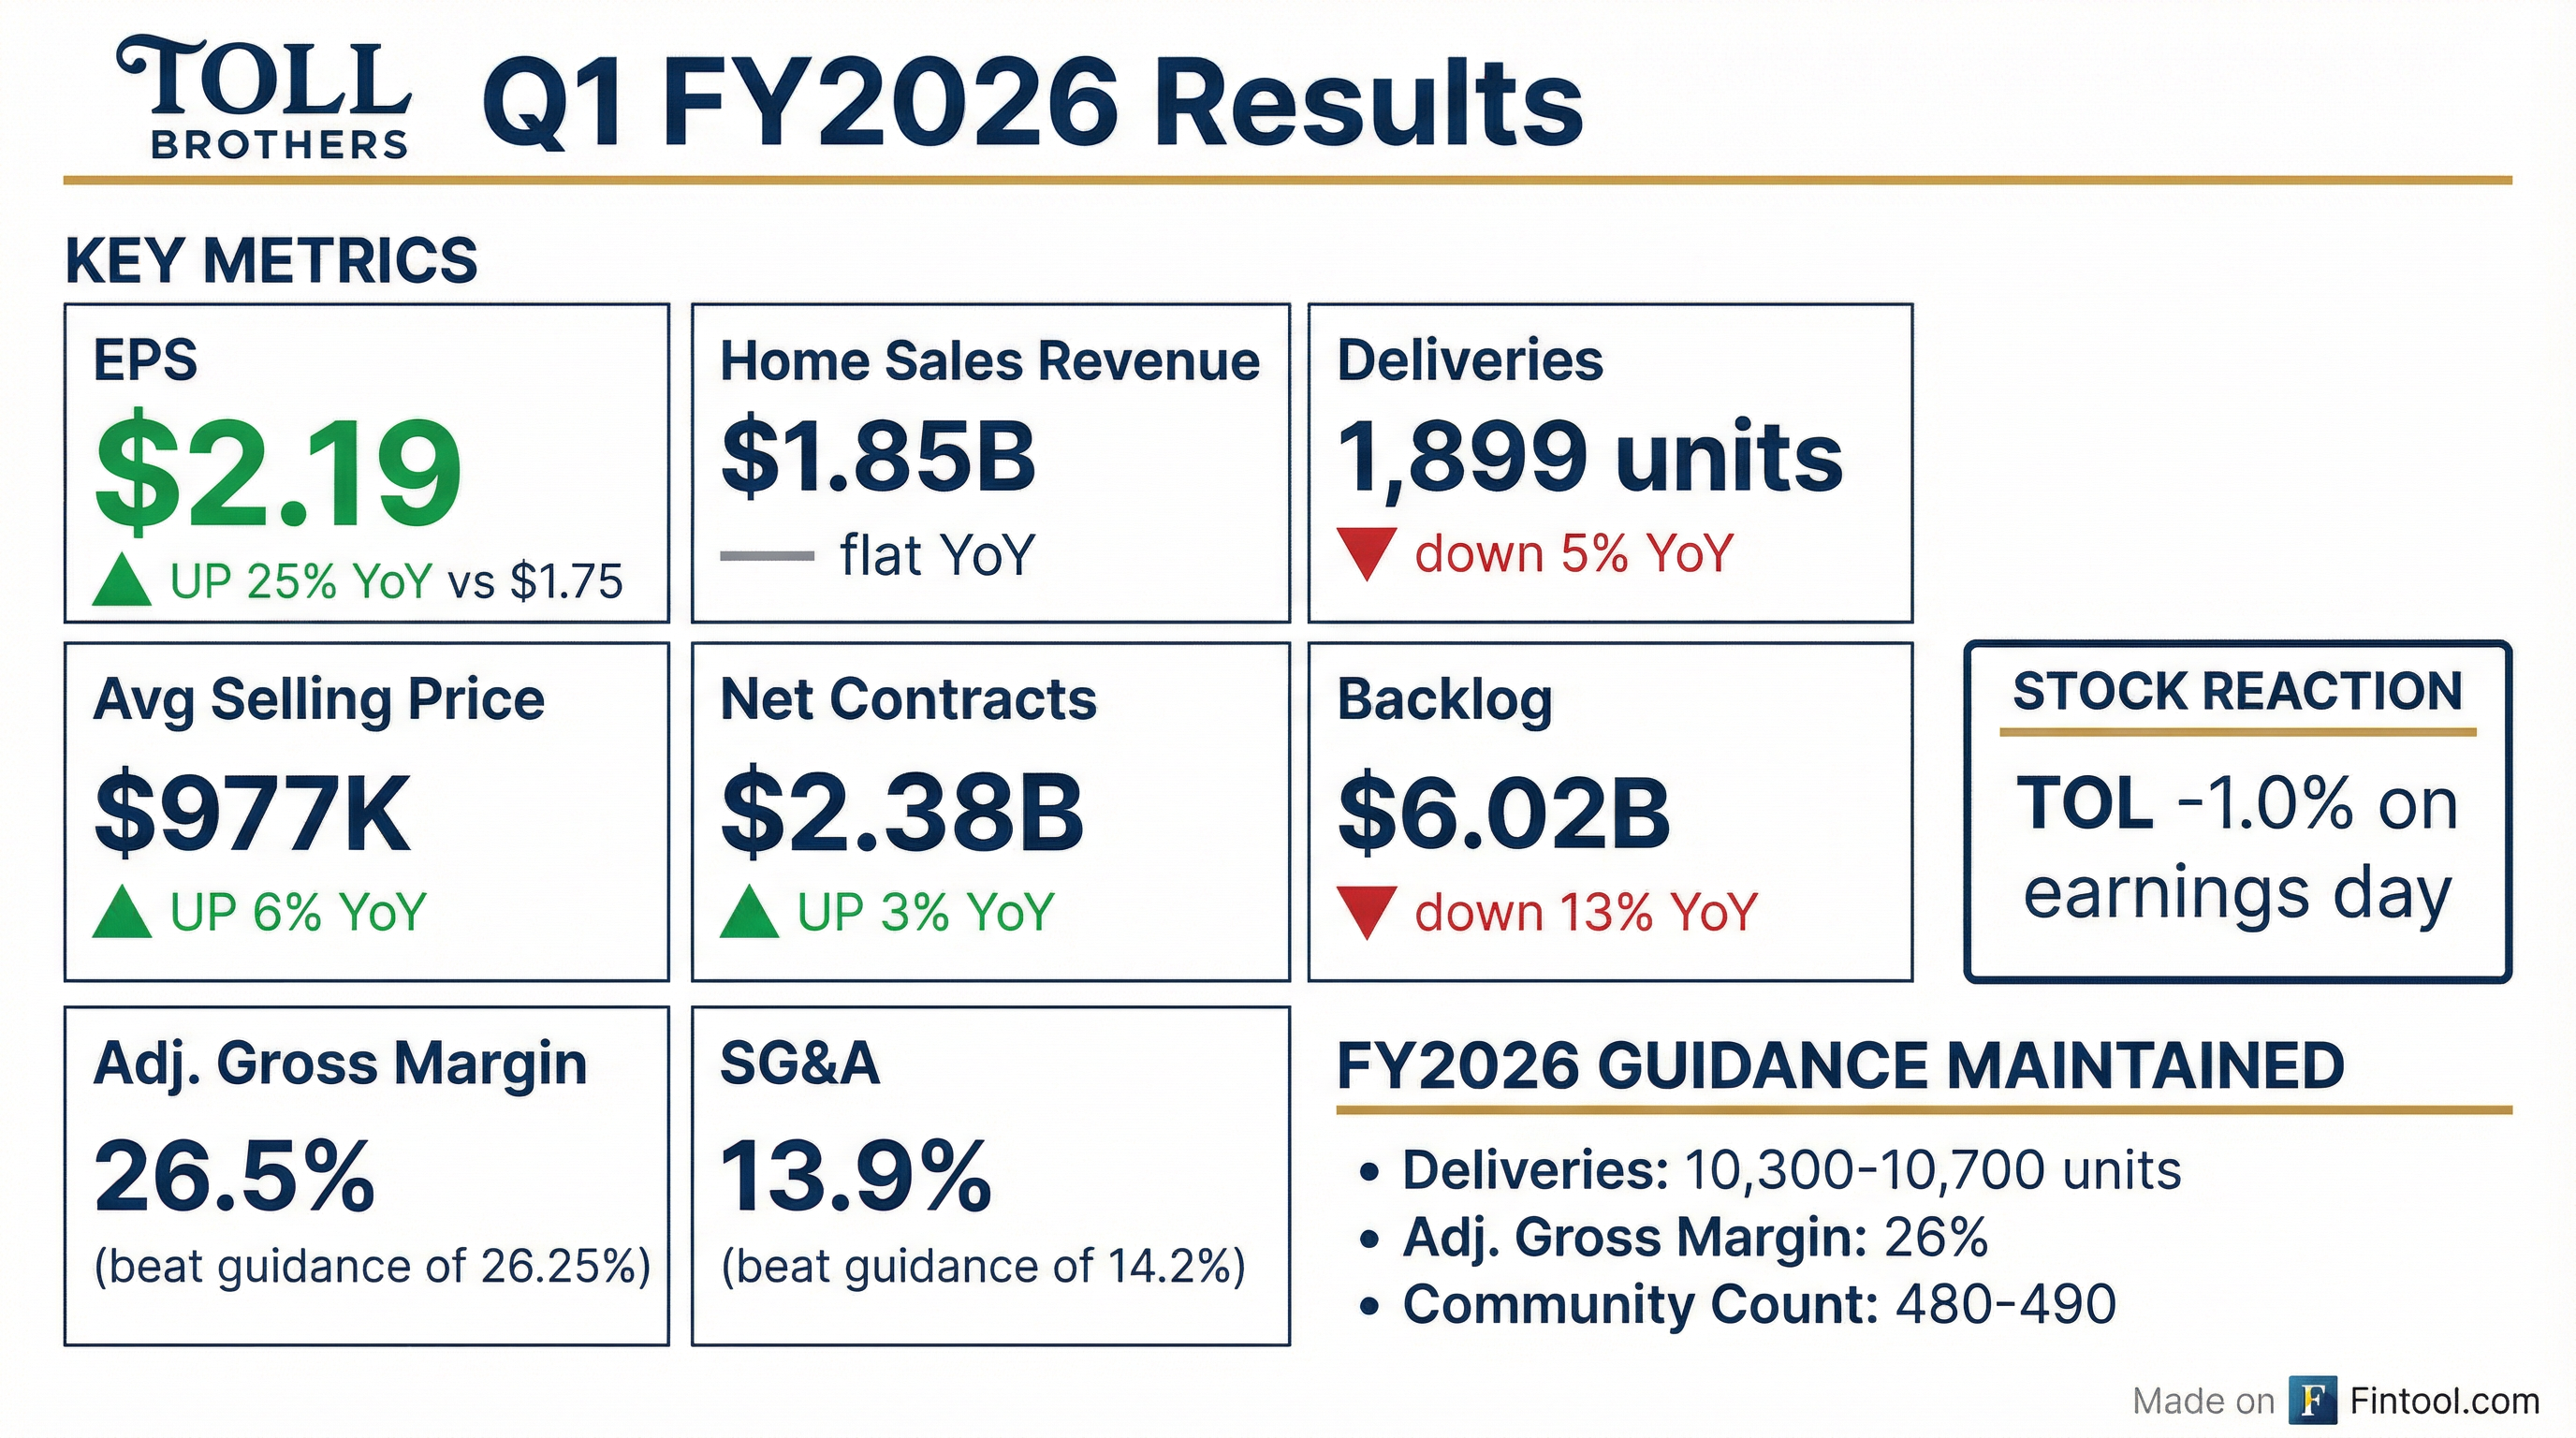
Toll Brothers delivered a strong Q1 FY2026, with EPS jumping 25% year-over-year to $2.19 as the luxury homebuilder beat guidance on both margins and expenses. Home sales revenue was essentially flat at $1.85 billion despite 5% fewer deliveries, as average selling prices rose 6% to $977,000. The company maintained its full-year guidance, citing confidence in its affluent customer base and broad geographic footprint.
Did Toll Brothers Beat Earnings?
Yes — handily on profitability metrics.
The beat drivers:
- Margin outperformance: Adjusted gross margin of 26.5% beat guidance of 26.25% by 25 bps
- Expense discipline: SG&A of 13.9% beat guidance of 14.2% by 30 bps
- Price over volume: 6% higher ASP offset 5% lower unit deliveries
- Other income boost: $72M in other income vs $2.5M YoY, driven by apartment portfolio sale
How Did the Stock React?
Muted reaction despite the beat. TOL opened at $166.55 and closed at $163.83, down approximately 1% on earnings day. The stock had rallied significantly heading into results — up 14% over the prior 50 days and 26% over the past 200 days — suggesting expectations were already elevated.
What's already priced in: The stock trades at roughly 12.8x FY2026E EPS ($12.84 consensus*), a premium to historical averages for homebuilders, reflecting Toll's luxury positioning and consistent execution.
*Values retrieved from S&P Global
What Did Management Guide?
Full-year guidance maintained, signaling confidence despite a softer backlog.
CEO Doug Yearley emphasized: "Our business model and strategy have allowed us to perform well in the current environment, giving us the confidence to maintain our full year guidance."
Consensus estimates for FY2026: Revenue of ~$10.4B and EPS of ~$12.84*
*Values retrieved from S&P Global
What Changed From Last Quarter?
Key shifts to watch:
-
Backlog compression: Backlog fell to $6.02B (5,051 homes) from $6.94B (6,312 homes) YoY — a 13% decline in value and 20% decline in units. However, backlog ASP rose to $1.19M from $1.10M, reflecting the move upmarket.
-
Geographic mix shift: Pacific region surged 37% YoY to $393M on higher ASPs ($1.55M), while South and Mountain regions declined.
-
Apartment Living exit: The company substantially completed sale of ~half its multi-family portfolio to Kennedy Wilson for ~$330M net proceeds, with plans to fully exit apartment development over coming years.
-
Cancellation rates: Stable at 5.4% of contracts signed (vs 5.8% YoY) and 2.8% of beginning backlog (vs 2.4% YoY).
Geographic Segment Breakdown
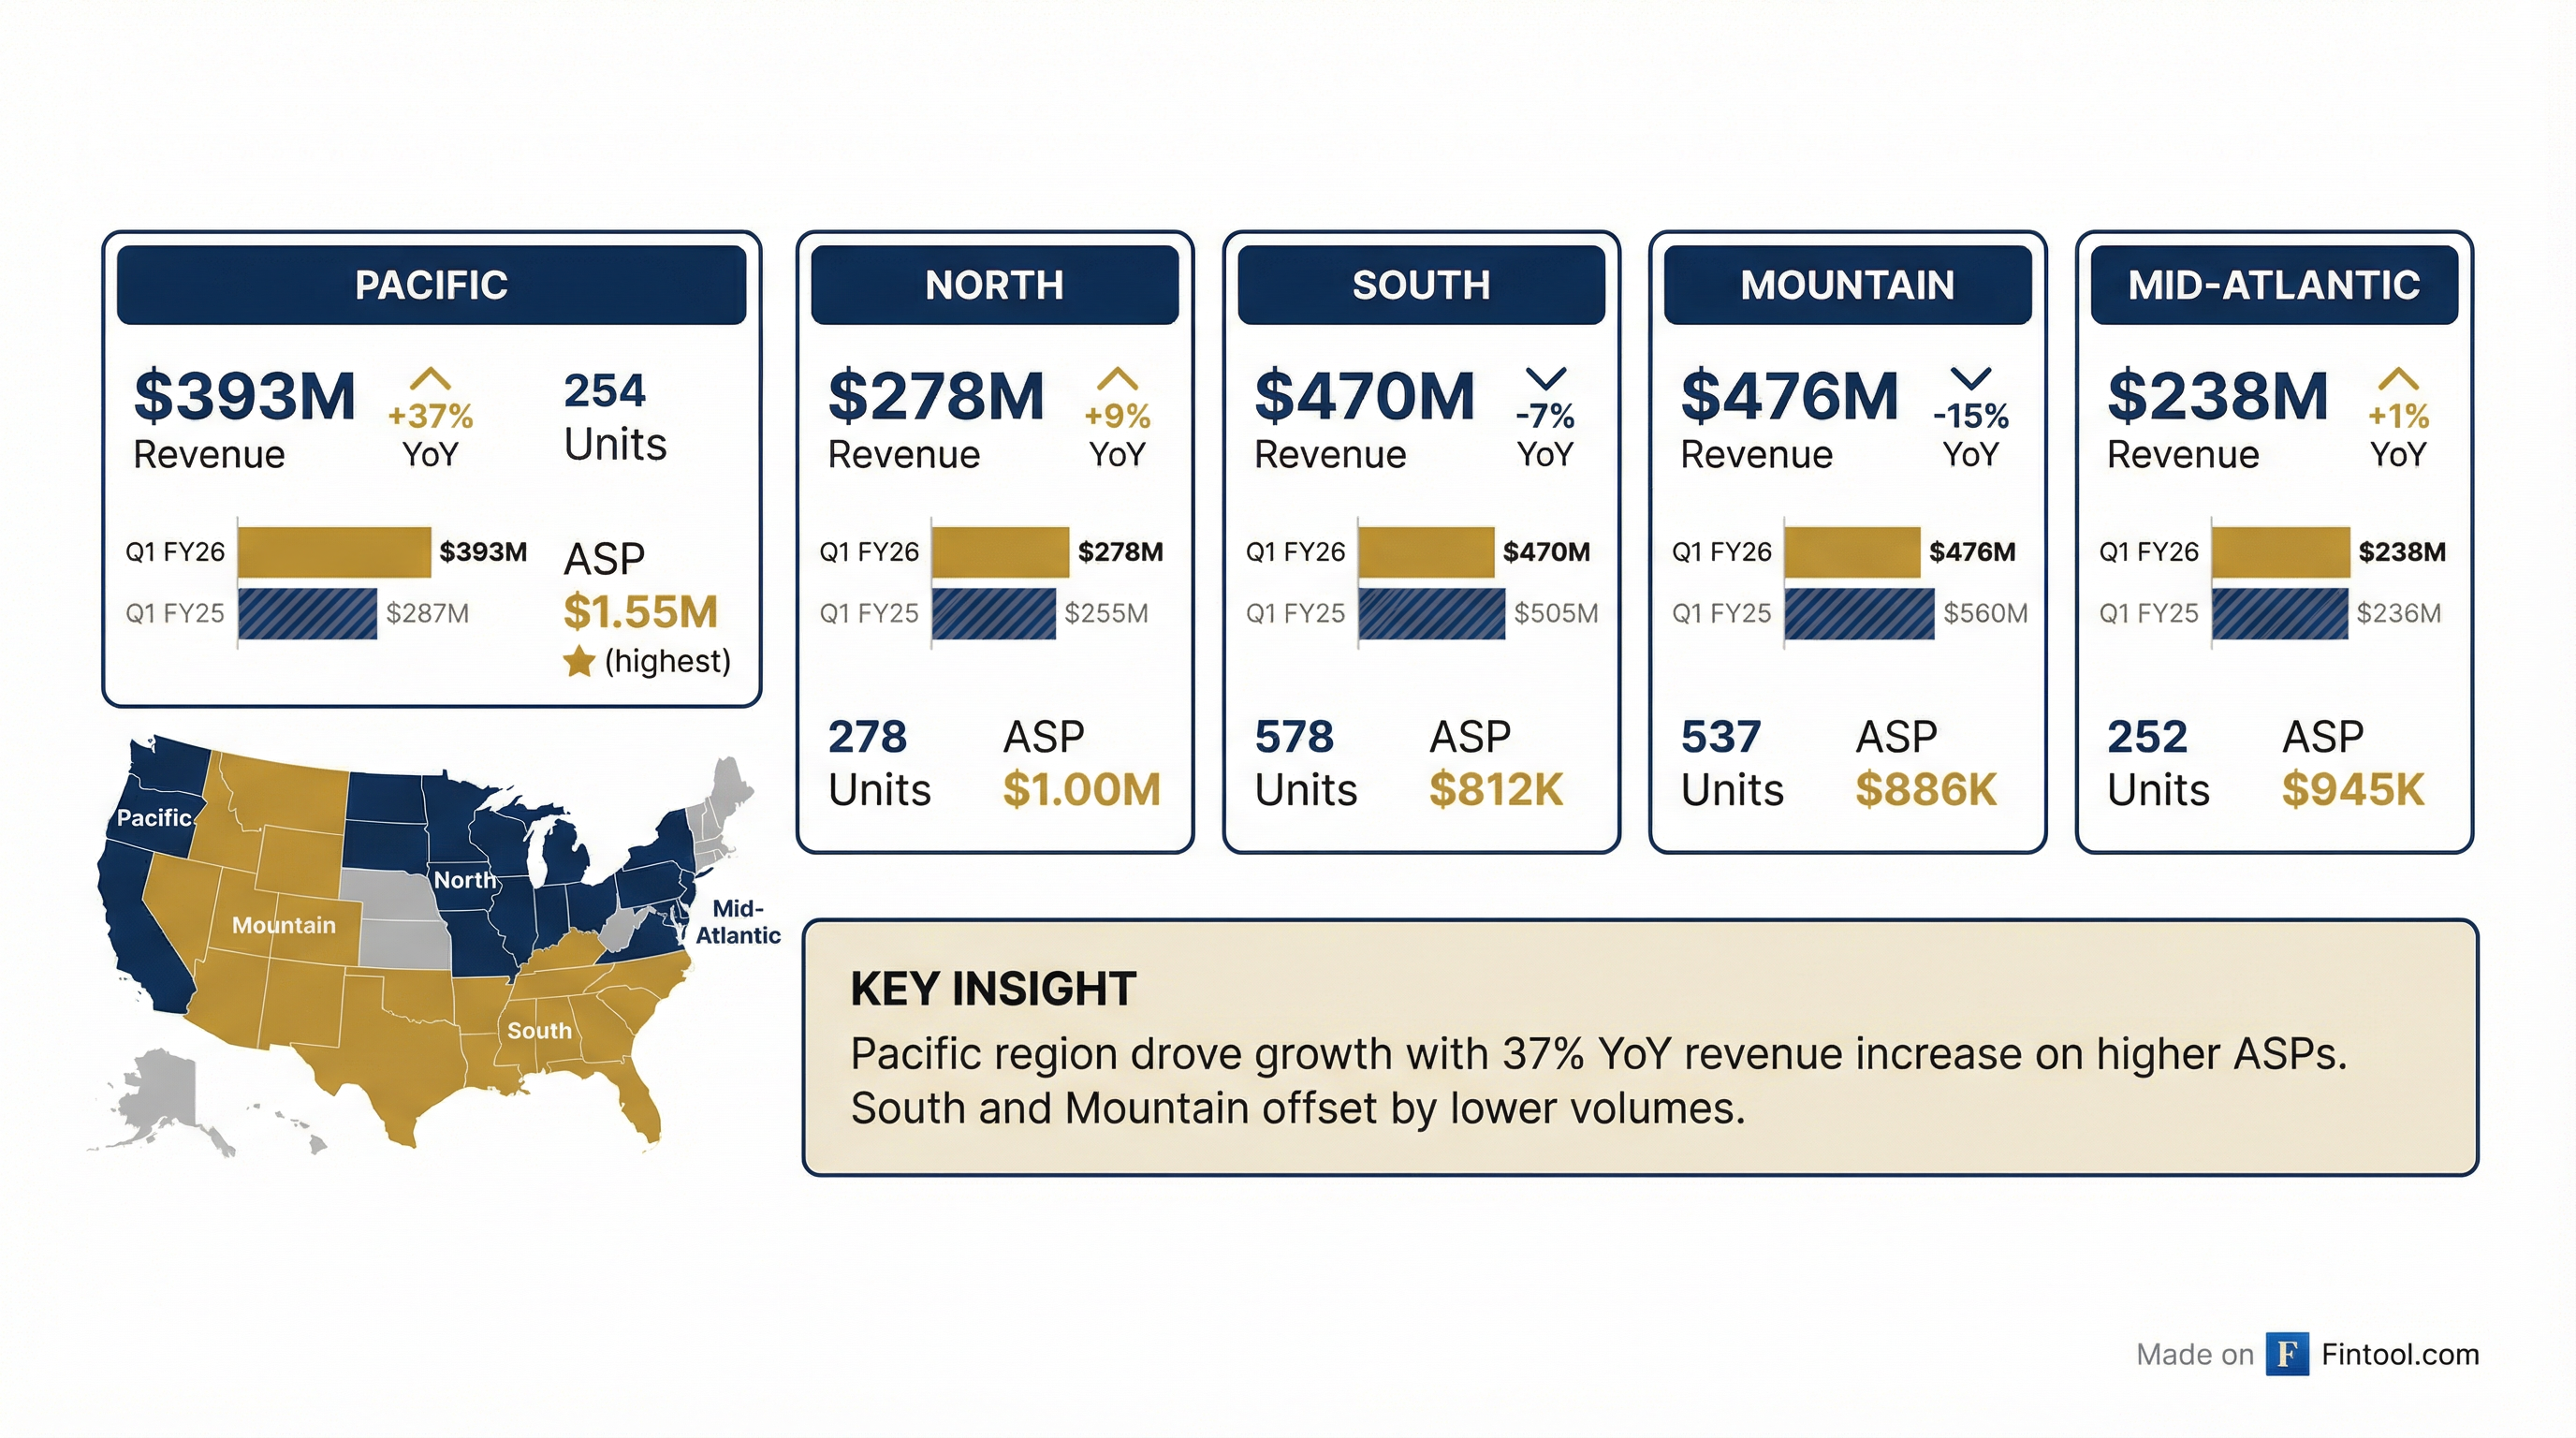
The Pacific story: California, Oregon, and Washington markets delivered standout results with ASPs averaging $1.55M — 60% above the company average. This offset weakness in the Mountain region (Arizona, Colorado, Nevada, Utah, Idaho), where volumes fell 19%.
Balance Sheet & Capital Allocation
Toll Brothers ended Q1 with a strong financial position:
Capital deployment in Q1:
- Share repurchases: 0.3M shares at $146.75 avg price for $50.5M total
- Dividend: $0.25 per share quarterly dividend paid Jan 23, 2026
- Land investment: $424M spent on ~2,189 lots
- Credit facility: Extended to 2031 and increased to $2.38B
Land Position & Community Count
The company controls approximately 75,000 lots — sufficient for 8-10% annual community count growth through FY2026 and beyond.
Community count grew 10% YoY (445 vs 406), supporting the company's growth trajectory.
Key Quotes From Management
CEO Doug Yearley highlighted the company's positioning:
"We are pleased with our first quarter results, as we met or exceeded guidance across nearly all metrics."
"We continue to be very pleased with our focus on the luxury market and its more affluent customer base. We also continue to benefit from our broad geographic footprint, the widest variety of home offerings and price points in the industry, and our balanced mix of build-to-order and spec homes."
"Last month, Toll Brothers was named the #1 Most Admired Home Builder in Fortune magazine's 2026 list of the World's Most Admired Companies, the ninth year the Company has achieved this honor."
Risks & Concerns
-
Backlog deterioration: The 13% YoY decline in backlog value and 20% decline in units could pressure future quarters if contract activity doesn't rebound.
-
Mortgage rate sensitivity: While the luxury buyer is less rate-sensitive, persistently elevated rates could weigh on demand, particularly in the $800K-$1M segment.
-
Geographic concentration risk: The Pacific region's outperformance masks weakness in Mountain and South regions, which together represent 60% of units.
-
SG&A leverage compression: SG&A rose 80 bps YoY to 13.9% despite flat revenue, suggesting fixed cost pressures. Management guides 10.25% for full year as deliveries ramp.
What's Next for TOL?
Near-term catalysts:
- Q2 FY2026 earnings (expected May 2026)
- Spring selling season contract trends
- Mortgage rate trajectory
Earnings call: February 18, 2026 at 8:30 AM ET — management will provide color on demand trends and regional performance.
Analysis based on Toll Brothers 8-K filed February 17, 2026. Earnings call scheduled for February 18, 2026.