TYSON FOODS (TSN)·Q1 2026 Earnings Summary
Tyson Foods Beats on EPS as Chicken and Prepared Foods Power Results, Stock Jumps 4.5%
February 2, 2026 · by Fintool AI Agent
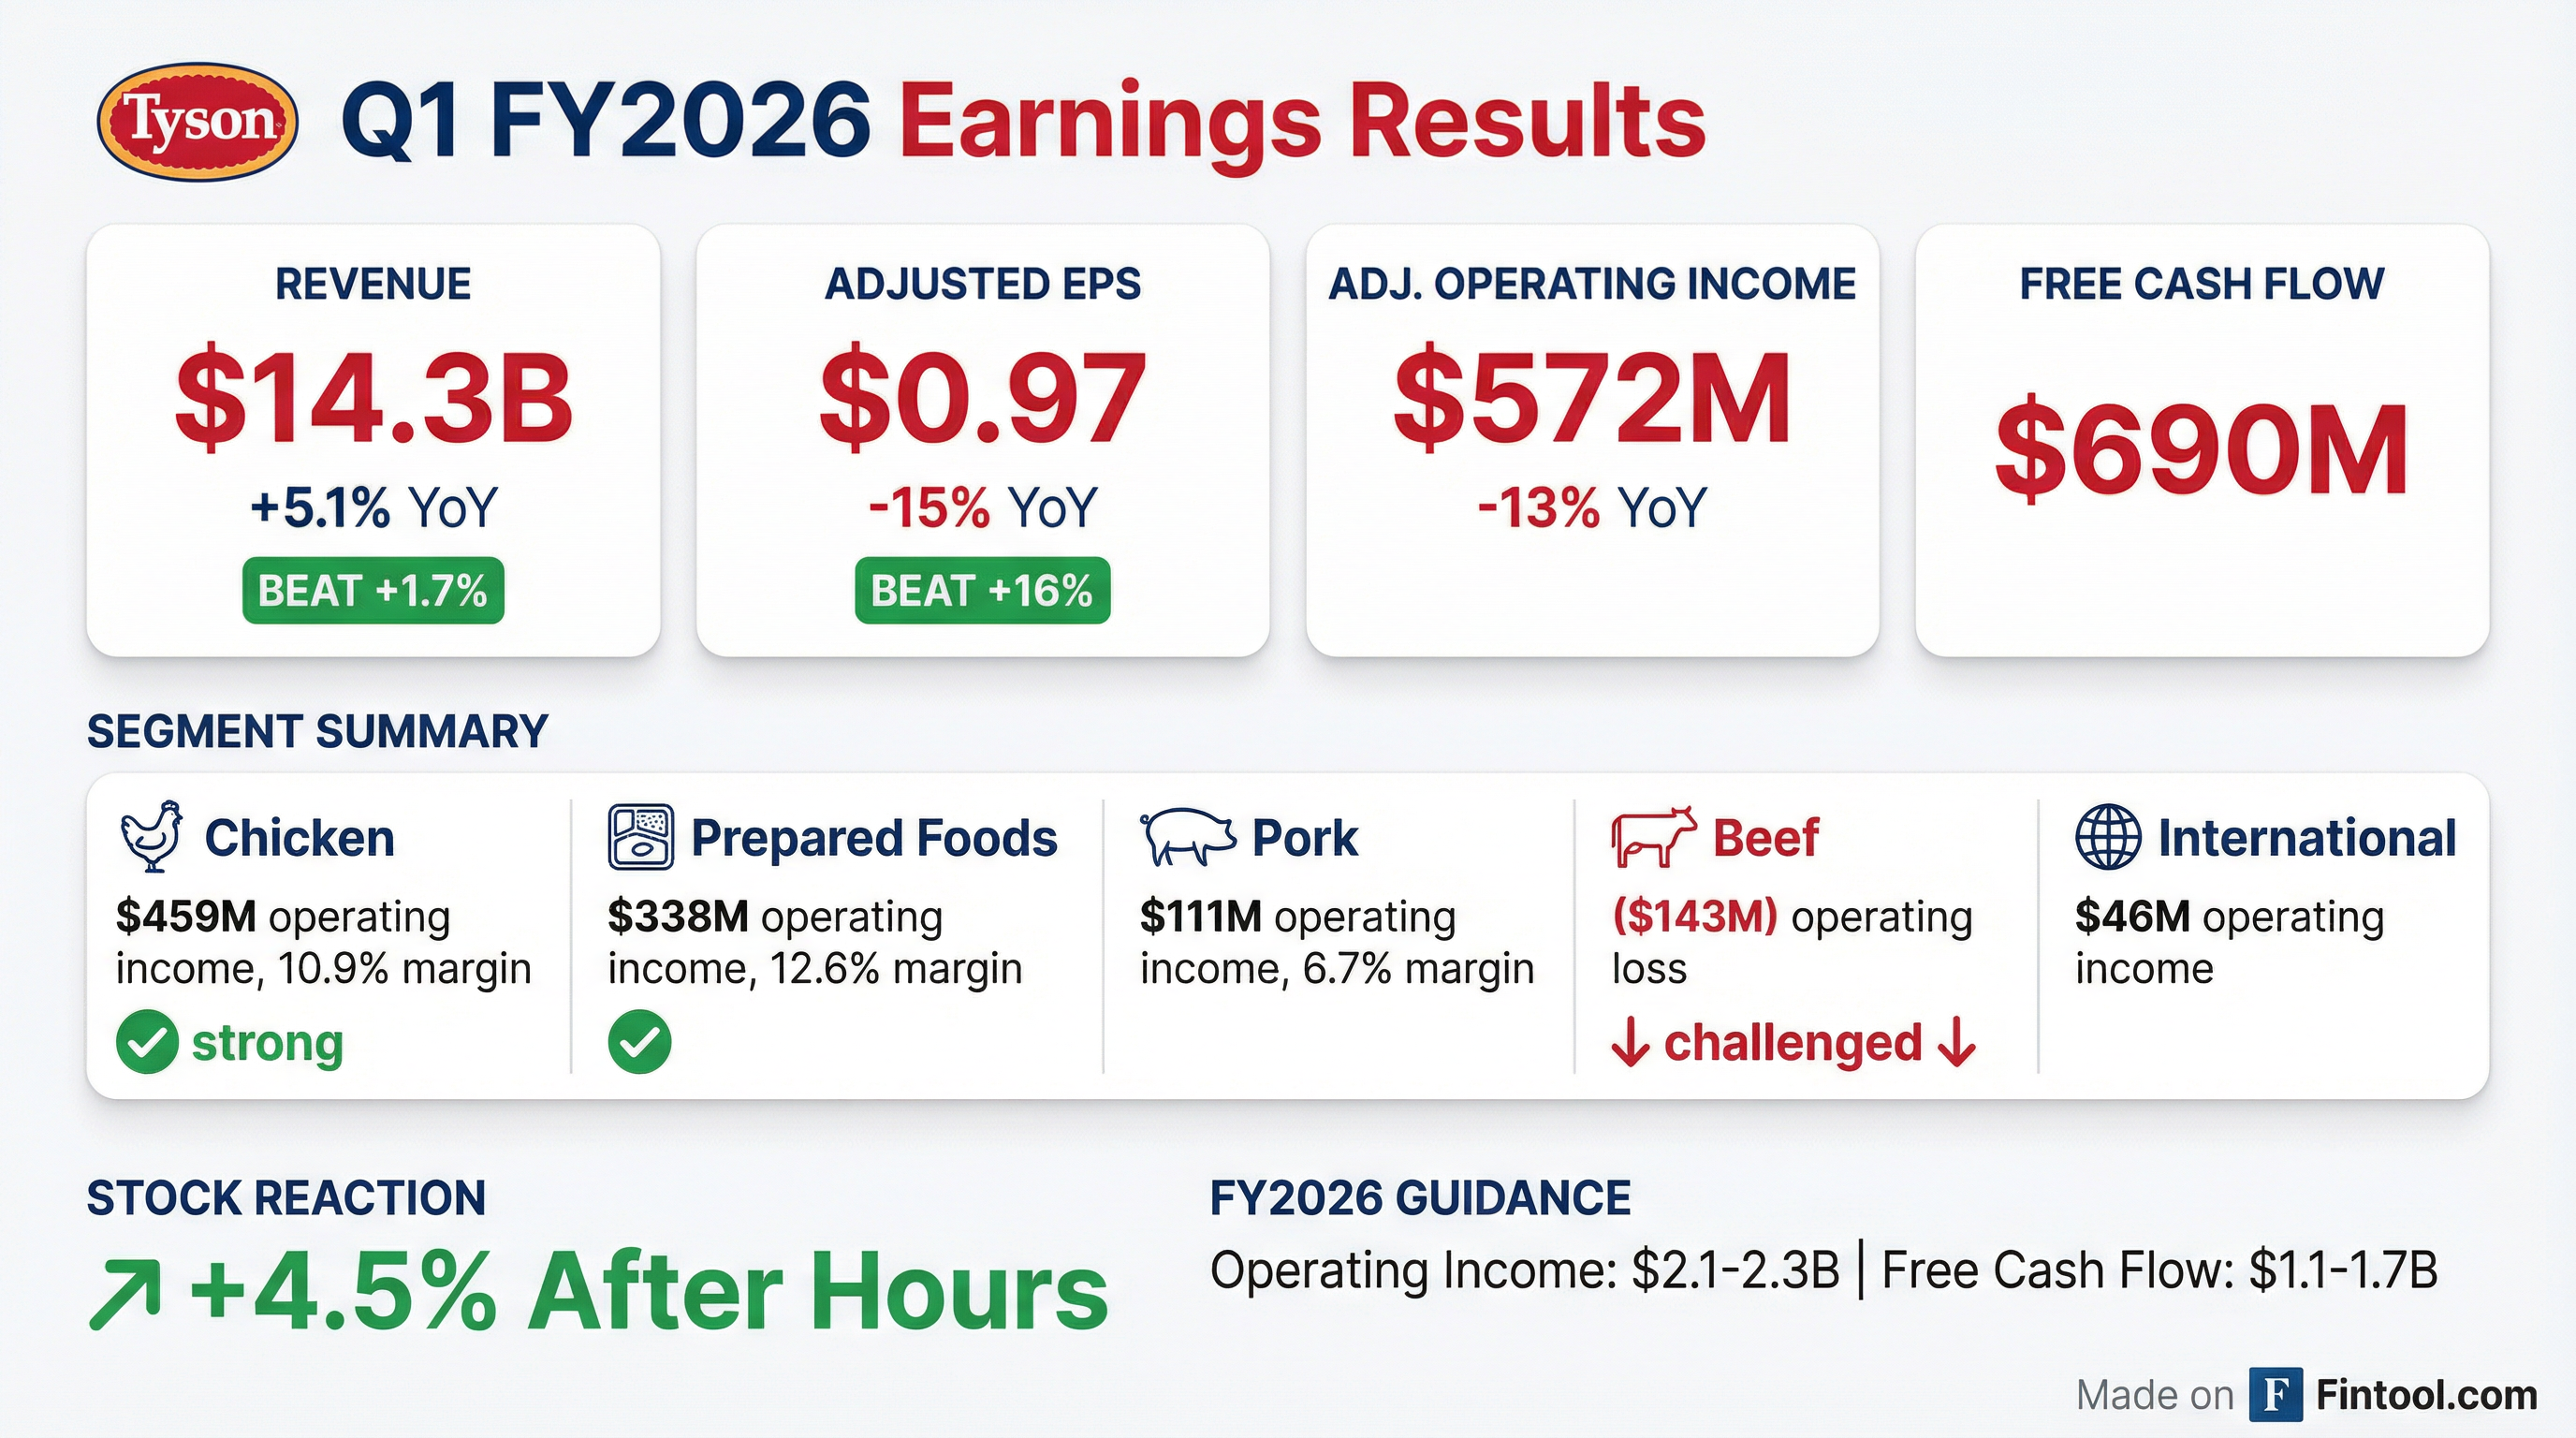
Tyson Foods delivered a strong Q1 FY2026, beating both EPS and revenue estimates as Chicken and Prepared Foods segments continued to outperform . The protein giant reported adjusted EPS of $0.97, beating consensus of $0.83 by 16.2%, while revenue of $14.3B exceeded expectations by 1.7%. The stock jumped 4.5% in after-hours trading to $68.27.
Did Tyson Foods Beat Earnings?
Yes — and it wasn't close. Tyson delivered its 8th consecutive quarter of EPS beats.
The adjusted EPS of $0.97 was down 15% year-over-year from $1.14, but significantly above Street expectations . Revenue growth of 5.1% YoY (or 6.2% excluding $150M in legal contingency accruals) demonstrated continued market share gains across the protein portfolio .
Key beat drivers:
- Chicken segment volume up 3.7% with consistent market share gains
- Prepared Foods delivered top and bottom-line growth with 12.6% margins
- Pork margins expanded 220bps to 6.7% on network optimization and raw material utilization
- Retail branded volume up 2.1% vs. total Food & Beverage down 1.8%, demonstrating share capture
Retail Branded Category Performance (Latest 13-week volume per Nielsen):
Note: Total category Food & Beverage retail volume declined 1.8% over the same period, while Tyson's retail branded products grew 2.5% in volume and 3.6% in dollars — significantly outperforming the broader sector .
How Did the Stock React?
TSN jumped 4.5% in after-hours trading to $68.27, up from the regular session close of $65.33.
The stock is now trading near its 52-week high of $65.96, having rallied from lows around $50.56. The positive reaction reflects relief that the Chicken segment continues to outperform and that beef losses, while significant, were in line with expectations.
What Changed From Last Quarter?
Improving trends:
- Chicken momentum continues: 5th consecutive quarter of YoY volume gains, demonstrating consistent market share capture
- Prepared Foods strength: Delivered both revenue growth (+8.1% on price) and margin expansion
- Debt reduction accelerating: Reduced total debt by $468M in the quarter
- U.S. Dietary Guidelines validation: New guidelines advocating increased animal protein consumption represent "historic validation" of Tyson's core mission. The company has proactively removed petroleum-based synthetic dyes and other ingredients (including high-fructose corn syrup) across its U.S. branded portfolio ahead of the updated recommendations
Persistent challenges:
- Beef losses widening: Adjusted operating loss of $(143)M vs. $6M profit in Q1 FY25
- Legal headwinds: $150M in legal contingency accruals reduced reported sales and impacted GAAP earnings
- Cattle cycle pressures: USDA projects domestic beef production down ~2% in FY26
Segment Performance Deep Dive
Chicken: The Growth Engine
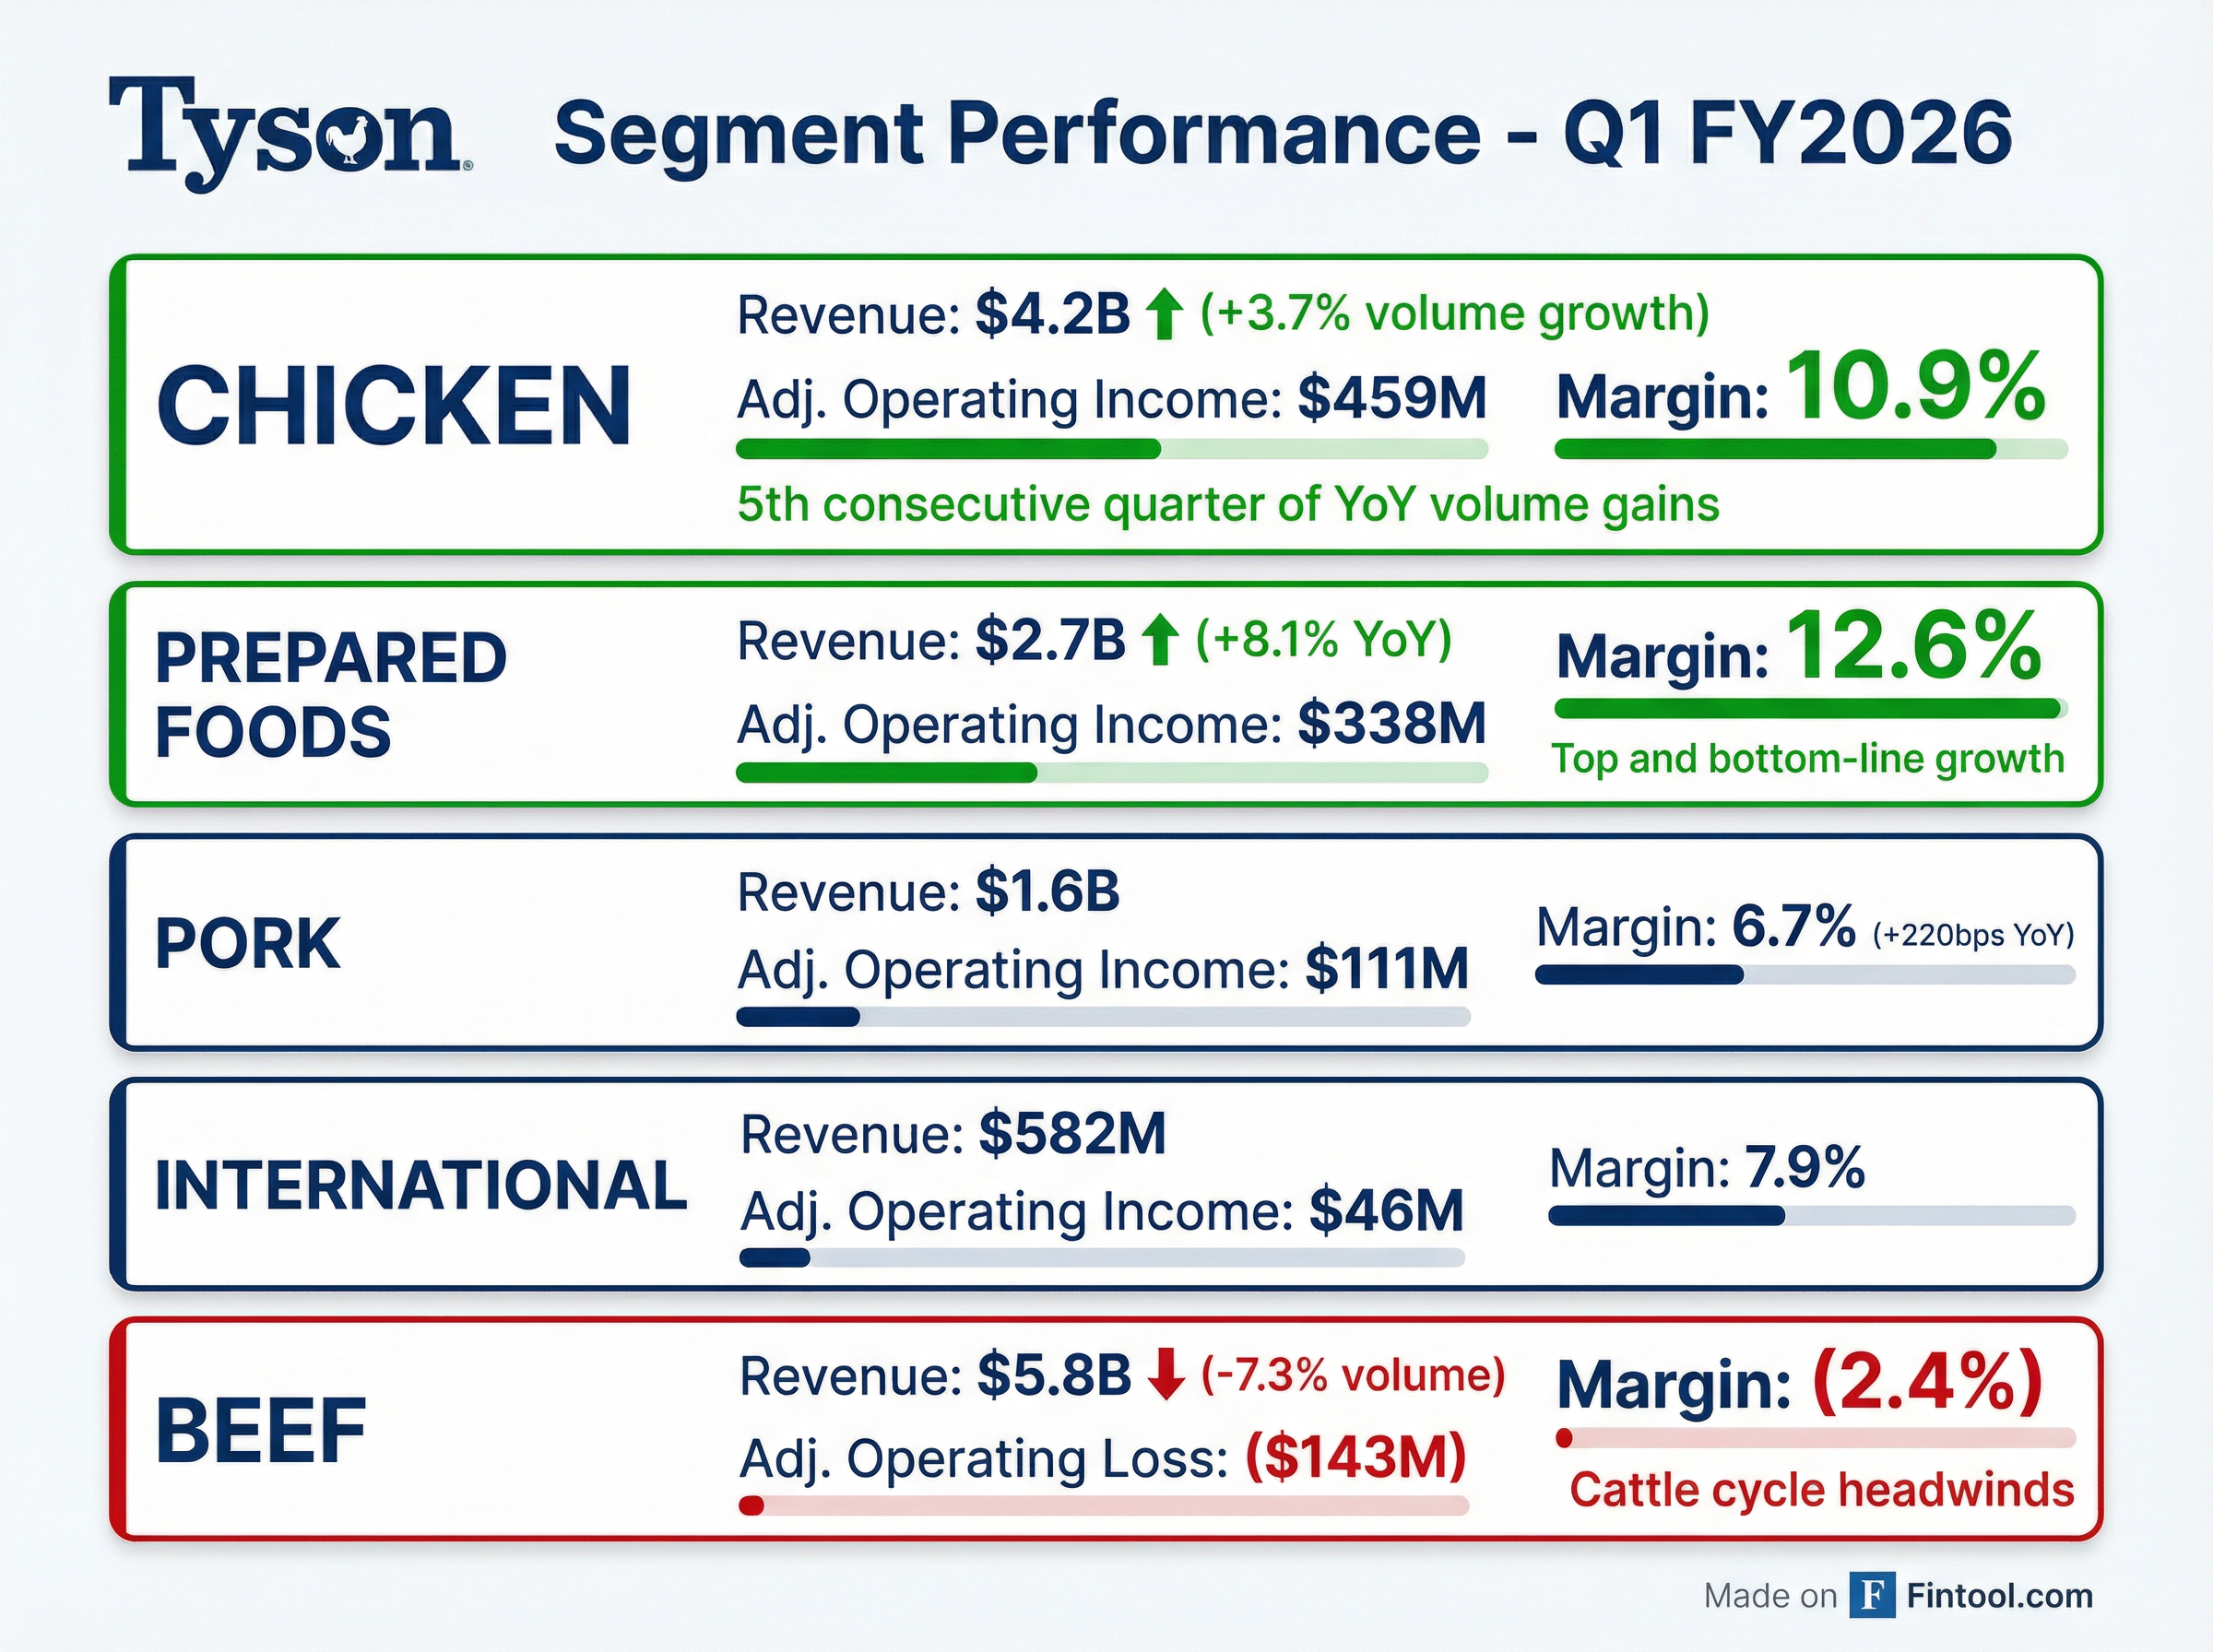
Chicken remains Tyson's strongest performer, delivering $459M in adjusted operating income on $4.2B in sales . The 10.9% adjusted margin reflects continued operational excellence and favorable demand dynamics.
Prepared Foods: Consistent Premium Returns
Prepared Foods continues to deliver premium margins with brands like Jimmy Dean, Hillshire Farm, and Ball Park driving consumer loyalty . Management clarified that the 8.1% sales increase was not pure price — it reflected a combination of channel mix and formula-based pass-through pricing (food service contracts adjust automatically as raw materials rise, with a lag). Commodity costs were up $100M in the quarter, but pricing is "catching up" .
Pork: Margin Expansion Story
Pork delivered the best margin improvement of any segment, with segment operating margin expanding 220bps to 6.7% . The end-to-end pork strategy is working — utilizing raw materials like pork bellies for branded bacon, hams for lunchmeat, and trimmings for sausage. This improves access, quality, and landing costs for Prepared Foods . Hog supplies were adequate during the quarter with favorable projections for the upcoming year.
Beef: Navigating the Cattle Cycle
Beef remains the challenge, posting a $(143)M adjusted operating loss as cattle supply constraints pressure margins . Volume declined 7.3% even as pricing increased 17.2% (ex-legal accruals) .
What Did Management Guide?
Important: Tyson changed its segment reporting this quarter from Adjusted Operating Income to Segment Operating Income, which excludes corporate expenses and amortization at the segment level. Historical results have been recast for comparability. The company now also provides separate guidance for corporate expenses ($950M-$975M) .
Tyson maintained its FY2026 consolidated guidance, signaling confidence in the operational plan despite beef headwinds :
Segment guidance:
- Chicken: $1.65B - $1.90B operating income
- Prepared Foods: $1.25B - $1.35B operating income
- Pork: $250M - $300M operating income
- Beef: $(500)M - $(250)M operating loss
- International: $150M - $200M operating income
What Did Management Say?
CEO Donnie King emphasized operational execution and market share gains:
"Our first quarter results reflect solid execution across our portfolio. Prepared Foods delivered top and bottom-line growth while Chicken reported its fifth consecutive quarter of year-over-year volume gains. As protein demand continues to increase, our consistent share gains demonstrate we are well-positioned to capture this momentum."
"I'm encouraged by the progress we've made and confident we will drive continued improvement across the controllable aspects of our business in fiscal 2026."
On the segment reporting change rationale:
"Before we make the first sale every week, before we turn on the first machine at Tyson Foods every week, we're sitting with something on the order of $1 billion of amortization and corporate expenses... I wanted to move that barrier to our organization in terms of trying to sell and grow our business."
On market share gains:
"Tyson was the only food company in consumer staples growing volume and dollar share in the most recent report. The only other one was P&G, which is not in the food space."
On chicken outlook:
"USDA recently reported an economic research service reported a document that says by 2030, 50% of animal protein consumption will come from chicken... There's never been a better time to be in protein."
Cash Flow and Balance Sheet
Free cash flow of $690M was down $70M YoY but remains robust :
Leverage improving: Net debt to Adjusted EBITDA improved to 2.0x, a tenth of a turn improvement since year-end. The company has reduced gross debt by $1.4 billion over the last 12 months .
Shareholder returns: Tyson returned $224M to shareholders in Q1 through $177M in dividends and $47M in share repurchases — signaling confidence in capital allocation. Liquidity ended the quarter at $4.5 billion .
Q&A Highlights
Segment Reporting Change Rationale: CEO Donnie King explained the shift from Adjusted Operating Income to Segment Operating Income was "very intentional" to empower business leaders to pursue volume growth without the burden of allocated corporate costs. The company starts each week with approximately $1 billion in corporate expenses and amortization (80% corporate, 20% amortization), which previously created perceived barriers to growth .
Beef Plant Closures: Tyson announced strategic changes including closing the Lexington, Nebraska facility and scaling back Amarillo, Texas operations to a single shift. These changes were implemented in January (Q2), so Q1 results do not reflect the impact. Management emphasized this right-sizes beef operations for the long-term cattle herd outlook .
Cattle Cycle Outlook: The USDA annual report showed the smallest cattle herd since 1951, down 9% from 2019. However, early signs of rebuild are emerging — replacement heifers increased 1%, beef cow slaughter was down 17.7% in 2025, and heifers on feed declined 3.1% YoY . Management cautioned cattle will remain "extremely tight for the foreseeable future" and that the rebuilt herd will likely be smaller than historical post-cycle levels.
Screwworm Risk: Management noted ongoing monitoring of screwworm incidents in Mexico close to the U.S. border. Unseasonably cold temperatures in Texas have helped prevent movement, but this remains a watch item through spring .
Free Cash Flow Improvement: The $200M improvement in FCF guidance ($1.1-1.7B vs prior range) was driven primarily by better working capital performance. Interest expense guidance also improved to $370M from capital structure efficiencies .
Corporate Cost Reduction: Corporate expenses and amortization declined $20M YoY in Q1, with team member costs down $13M. Full-year guidance of $950M-$975M implies continued discipline on overhead .
Risks and Concerns
-
Beef segment losses: Adjusted operating loss of $(143)M with guidance for $(500)M to $(250)M full-year loss — cattle cycle recovery timeline remains uncertain
-
Legal contingencies: $150M accrual in Q1 related to Mexico operations and other matters, with potential for additional charges
-
Margin compression: Despite volume gains, Chicken and Prepared Foods margins both contracted YoY
-
Commodity exposure: Company remains exposed to feed grain costs, live cattle and hog prices, and trade policy risks
Forward Catalysts
- Q2 FY2026 earnings (expected May 2026)
- Cattle cycle inflection — USDA projects production stabilizing in FY27
- Debt reduction progress — targeting investment grade metrics
- Network optimization — restructuring program aimed at improving operational efficiency