Earnings summaries and quarterly performance for Trane Technologies.
Executive leadership at Trane Technologies.
David Regnery
Chief Executive Officer
Christopher Kuehn
Executive Vice President and Chief Financial Officer
Donald Simmons
Group President, Americas
Elizabeth Elwell
Vice President and Chief Accounting Officer
Mairéad Magner
Senior Vice President, Chief Human Resources Officer
Mauro Atalla
Senior Vice President, Chief Technology and Sustainability Officer
Raymond Pittard
Executive Vice President, Chief Integrated Supply Chain Officer
Board of directors at Trane Technologies.
Ana Assis
Director
Ann Berzin
Director
April Miller Boise
Director
John Hayes
Director
John Surma
Lead Independent Director
Kirk Arnold
Director
Linda Hudson
Director
Mark George
Director
Matthew Pine
Director
Melissa Schaeffer
Director
Myles Lee
Director
Research analysts who have asked questions during Trane Technologies earnings calls.
Christopher Snyder
Morgan Stanley
6 questions for TT
Julian Mitchell
Barclays Investment Bank
6 questions for TT
Nigel Coe
Wolfe Research, LLC
6 questions for TT
Scott Davis
Melius Research
6 questions for TT
Amit Mehrotra
UBS
5 questions for TT
Noah Kaye
Oppenheimer & Co. Inc.
5 questions for TT
Andrew Kaplowitz
Citigroup
4 questions for TT
Andrew Obin
Bank of America
4 questions for TT
Deane Dray
RBC Capital Markets
3 questions for TT
Jeffrey Sprague
Vertical Research Partners
3 questions for TT
Joe Ritchie
Goldman Sachs
3 questions for TT
Joseph Ritchie
Goldman Sachs
3 questions for TT
Steve Tusa
JPMorgan Chase & Co.
3 questions for TT
Thomas Moll
Stephens Inc.
3 questions for TT
Andy Kaplowitz
Citigroup Inc.
2 questions for TT
C. Stephen Tusa
JPMorgan Chase & Co.
2 questions for TT
Jeffrey Hammond
KeyBanc Capital Markets
2 questions for TT
Jeff Sprague
Vertical Research
2 questions for TT
Tommy Moll
Stephens Inc.
2 questions for TT
Sahil Manocha
RBC Capital Markets
1 question for TT
Recent press releases and 8-K filings for TT.
- Trane Technologies (NYSE: TT) has completed its acquisition of LiquidStack, a global leader in data center liquid cooling technology, originally announced on February 10, 2026.
- The deal strengthens Trane Technologies’ position as a full-service provider of sustainable thermal management solutions for mission-critical operations.
- The combined offerings will deliver an integrated suite of data center cooling solutions—from central plant to chip-level—to address rising AI-driven workload power densities.
- Completed acquisition of Stellar Energy Americas, Inc., a turnkey data center cooling solutions provider, strengthening Trane’s portfolio in this sector
- Acquisition expands Trane’s leadership and global scale in data center thermal management solutions
- Stellar Energy’s modular design expertise is expected to accelerate innovation, scale and supply chain efficiencies for rapid deployment of critical equipment
- Flattish Q1 guidance with 7–8% growth in Commercial HVAC Americas, a ~20% decline in residential, mid-single-digit growth in EMEA, and flattish Asia expected.
- Data center demand remains robust: Commercial HVAC Americas orders surged 120% in Q4, European backlog is up 40%, and management cites an unprecedented multi-vertical pipeline.
- Emphasis on innovation and direct sales to drive margin accretion—Asia margins rose from lowest to highest globally after establishing a direct sales force ~10 years ago.
- M&A strategy includes 25 acquisitions over five years, highlighted by the digital building platform BrainBox and the pending Q1 acquisition of modular-chiller specialist Stellar to simplify job-site execution.
- Reiterated commitment to 25% leverage for sustained R&D and innovation, including AI‐driven Level 5 building applications and the Aria virtual engineer, plus technician training facilities and apprenticeship programs.
- Q1 2026 guidance sees flattish growth, with 7–8% commercial HVAC Americas, -20% residential, mid‐single‐digit EMEA, and flat Asia performance.
- Robust order pipeline: 120% data center order growth in Q4 and 40% commercial HVAC backlog increase in Europe, driven by activity across 12–14 verticals.
- Expected 1.5% price increase for 2026 (with up to 5% residential price hike in April) targeting 20–30 bps of price-cost spread amid stable input costs.
- Advancing refrigerated transport with the AxlePower system harnessing kinetic energy for onboard power, alongside global margin improvements, notably in Asia.
- For Q1 2026, expects flattish revenue growth, with commercial HVAC Americas up 7–8%, residential down 20%, EMEA mid-single-digit growth, and Asia flattish.
- Reports 120% order growth in commercial HVAC Americas driven by data center and broad vertical demand; Europe commercial HVAC backlog up 40%.
- 2026 pricing guidance of 1.5%, plus residential price increase of up to 5% effective April 1, targeting 20–30 bps of price-cost spread.
- Completed 25 acquisitions over five years, highlighted by BrainBox digital building platform and pending Stellar modular chiller deal to streamline applied systems.
- Maintaining 25% leverage to invest in NPD, apprenticeships, and innovation, supported by strong cash generation.
- Reported 22% increase in commercial HVAC orders in Q4 2025, with a robust pipeline driving a revenue ramp throughout 2026 based on a nine-month order-to-ship cycle.
- Set 2026 residential segment guidance at flat to down 5%, while implementing a 5% price increase effective April 1 to offset inflationary pressures.
- Maintained a 25%+ organic incremental margin target for 2026, underpinned by ongoing innovation investments across all regions.
- Bolstered its data-center portfolio through the acquisitions of LiquidStack (CDUs and liquid-cooling pipeline) and Stellar (modular chillers), enhancing system-level offerings.
- Opened an advanced service-technician training center in Davidson, North Carolina, to improve commissioning capabilities and support an expanding service tail.
- Trane secured 22% year-end order growth in Q4, driven by broad-based strength across commercial HVAC verticals and a historically robust pipeline in North America and Europe.
- In 2026, revenue growth from commercial applied systems is expected to ramp with orders typically translating to shipments over a nine-month cycle.
- The company’s data center thermal management strategy emphasizes a systems approach, bolstered by the acquisition of LiquidStack and new service capabilities, positioning Trane as a strategic partner for hyperscalers and colos.
- Residential HVAC saw production cuts in Q4 to optimize channel inventory; 2026 guidance anticipates flat to 5% lower dollar sales with a 5% price increase effective April 1 to offset inflation.
- European results were weighed by investments in direct sales and acquisitions in 2025, but management expects margin expansion and >25% organic incremental margins in 2026 across all regions.
- Trane reported Q4 2025 commercial HVAC orders up 22%, driven by broad-based strength across verticals and a “very, very robust” pipeline supporting revenue growth into 2026.
- The company emphasizes a system-level approach in data center thermal management, leveraging its broad portfolio and recent LiquidStack acquisition to optimize chillers, CDUs and liquid-cooling solutions.
- In residential, Trane intentionally cut production days in Q4 2025 to align channel inventories, guiding flat to –5% sales on a dollar basis in Q1 2026 versus tough high-teens comps, and announced a 5% price increase effective April 1, 2026.
- EMEIA performance reflected strategic channel investments and direct-sales hires, with acquisition-driven capacity expansion; management expects margin expansion and >25% organic incremental margin in 2026.
- Trane remains disciplined on M&A, highlighting the integration of LiquidStack and modular-chiller specialist Stellar to bolster its service tail and factory-built solutions amid labor constraints.
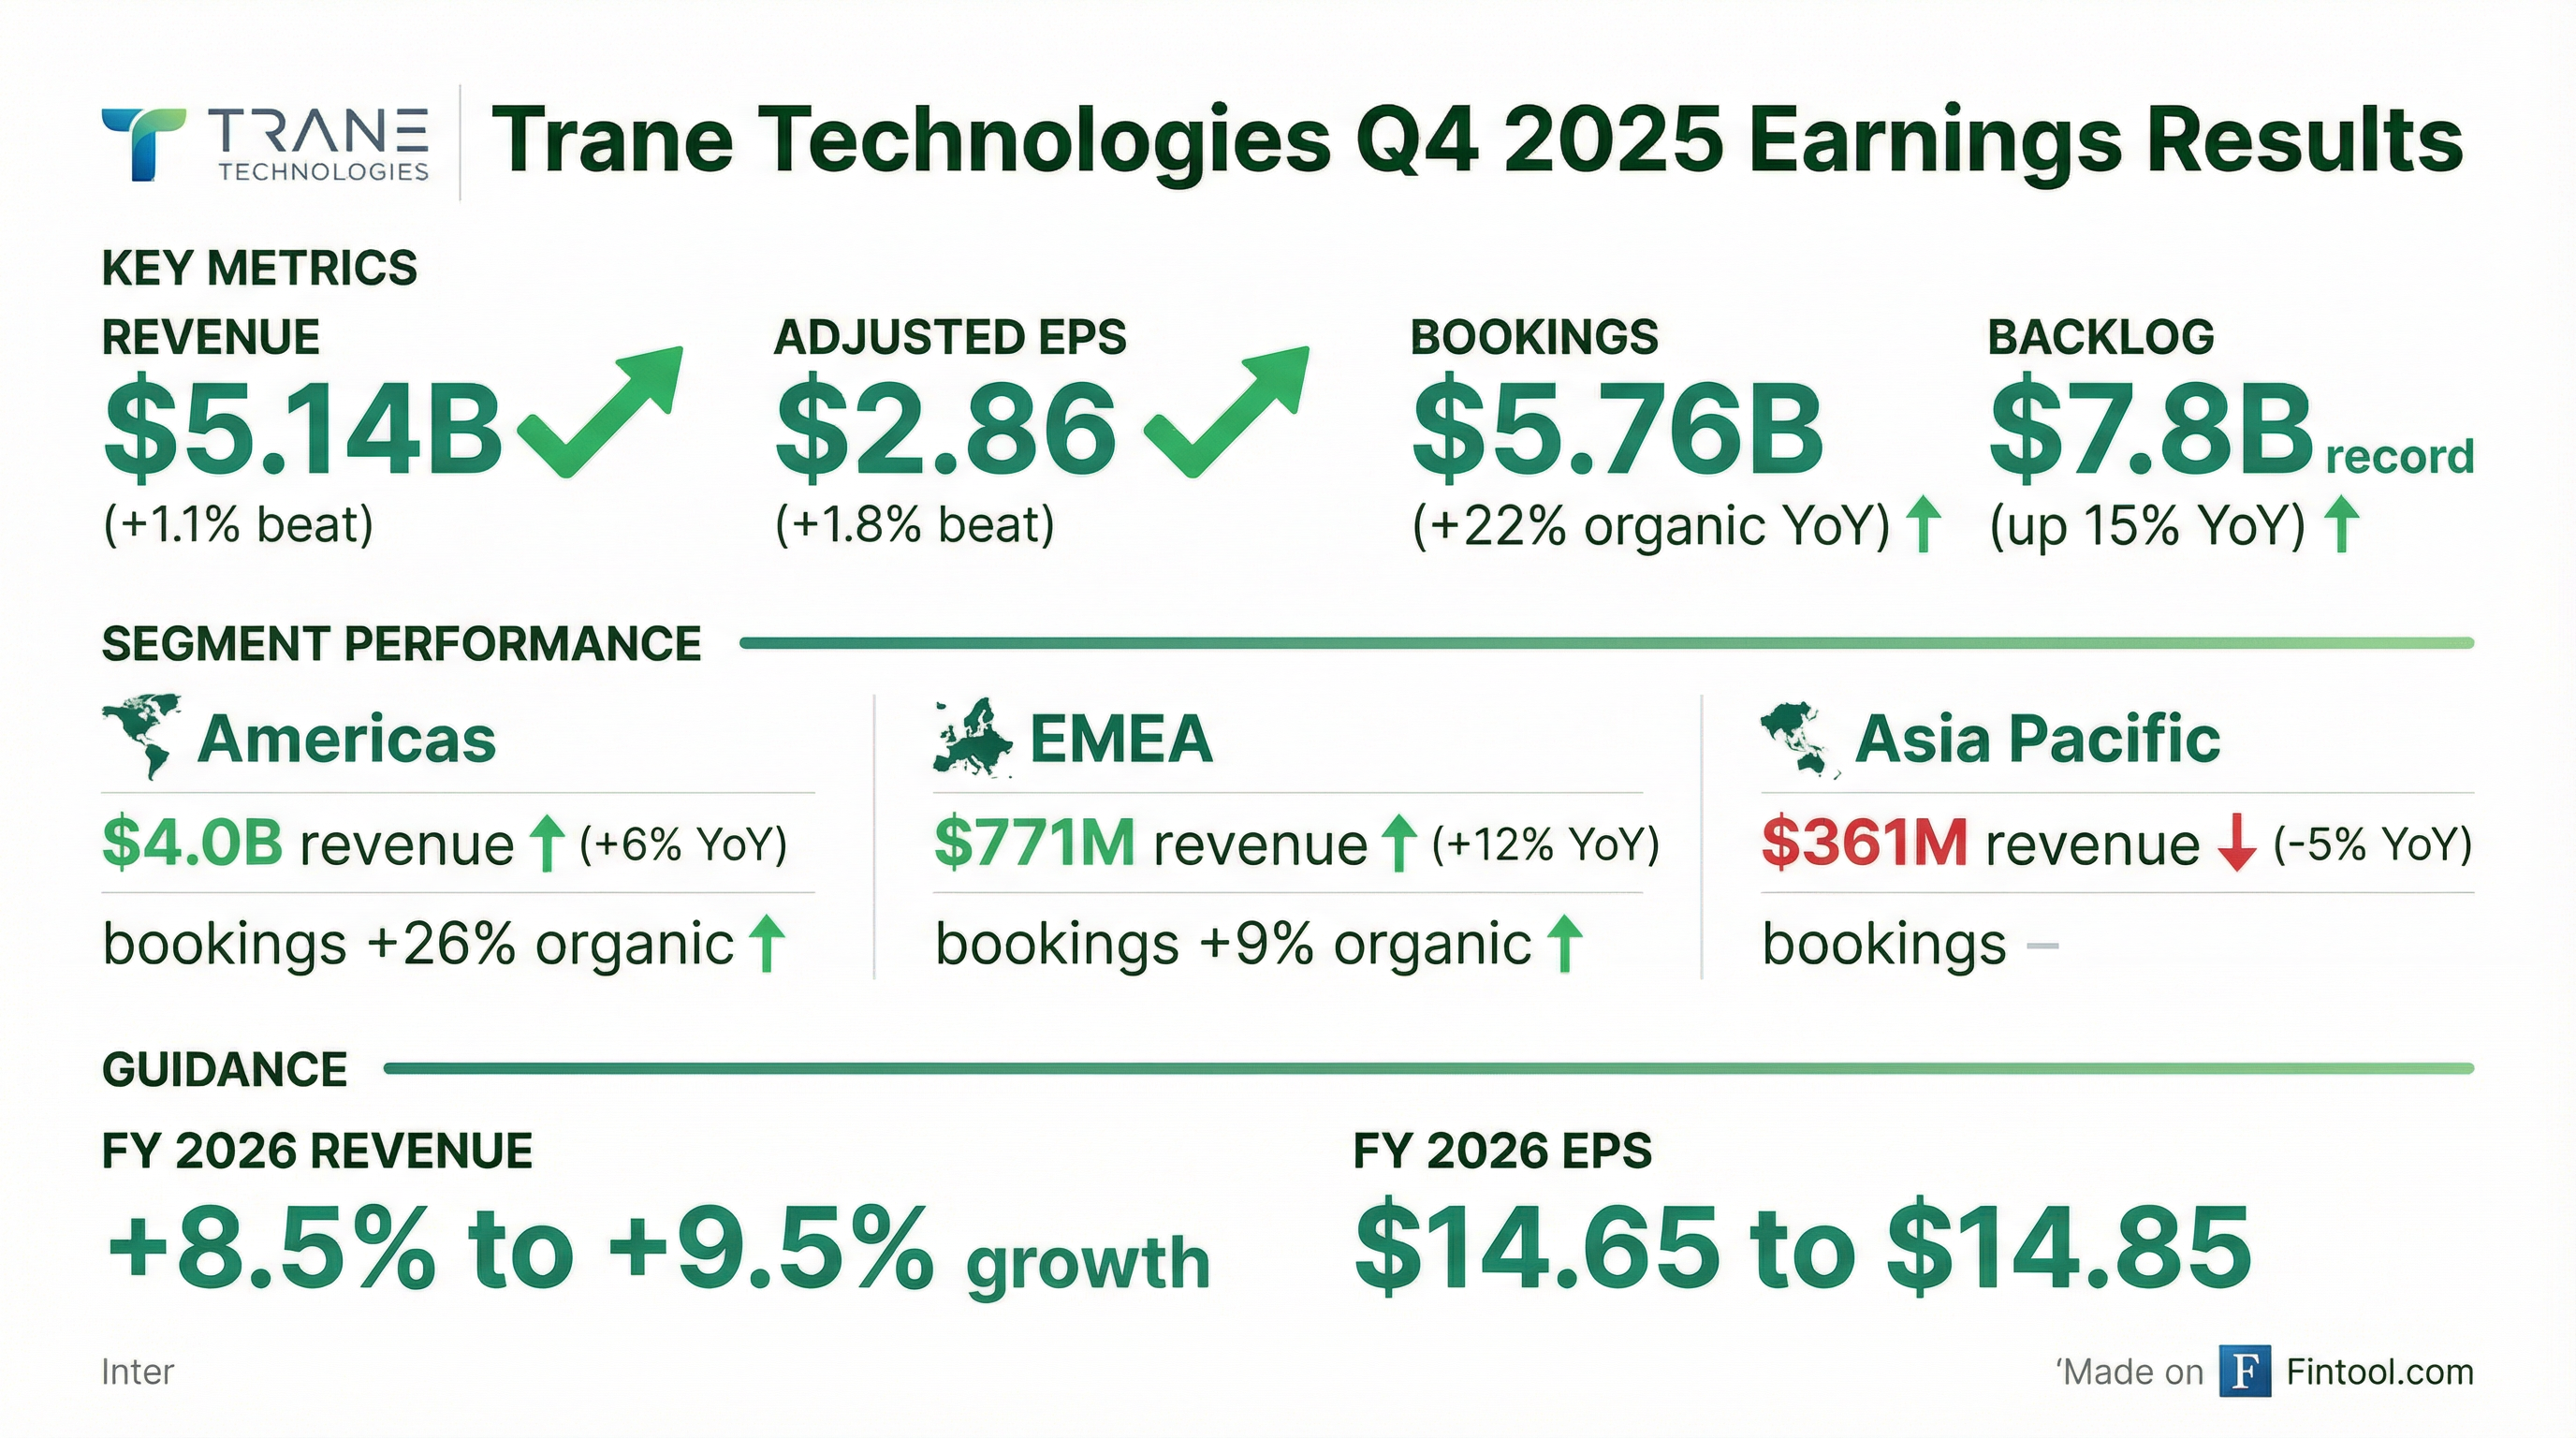
- Record bookings: Enterprise organic bookings up 22%, driving a record backlog of $7.8 billion at year-end, with Americas Commercial HVAC bookings +35% and Applied Solutions bookings +120% (200% book-to-bill).
- Solid Q4 financials: Organic revenue +4%, adjusted EPS +10%, and robust free cash flow funding strategic M&A, dividend growth, and share repurchases.
- 2026 guidance: Organic revenue growth of 6–7%, adjusted EPS of $14.65–$14.85 (up 12–14%), and reported revenue growth of 8.5–9.5%; Q1 adjusted EPS ~$2.50.
- Capital allocation: Deployed ~$3.2 billion in 2025 (dividends $840 million, M&A $720 million, repurchases $1.5 billion); plans to deploy $2.8–$3.3 billion in 2026, with $4.7 billion remaining under repurchase authorization and closing the Stellar Energy acquisition in Q1.
- Strong bookings: Q4 enterprise organic bookings up 22%, record backlog of $7.8 billion; Applied Solutions bookings +120%, book-to-bill 200%.
- Q4 organic revenue +4% (Americas +5%), with margins pressured by residential inventory normalization and growth investments.
- 2026 guidance: 6–7% organic revenue growth, Adjusted EPS $14.65–$14.85 (+12–14%); Q1 EPS ~$2.50.
- Capital allocation: 2025 deployed ~$3.2 billion (dividends, M&A, buybacks); 2026 plan $2.8–3.3 billion spend with $4.7 billion remaining buyback authorization.
Fintool News
In-depth analysis and coverage of Trane Technologies.

Quarterly earnings call transcripts for Trane Technologies.
Ask Fintool AI Agent
Get instant answers from SEC filings, earnings calls & more