TEXAS INSTRUMENTS (TXN)·Q4 2025 Earnings Summary
Texas Instruments Jumps 5% After-Hours on Strong Q1 Guidance
January 27, 2026 · by Fintool AI Agent
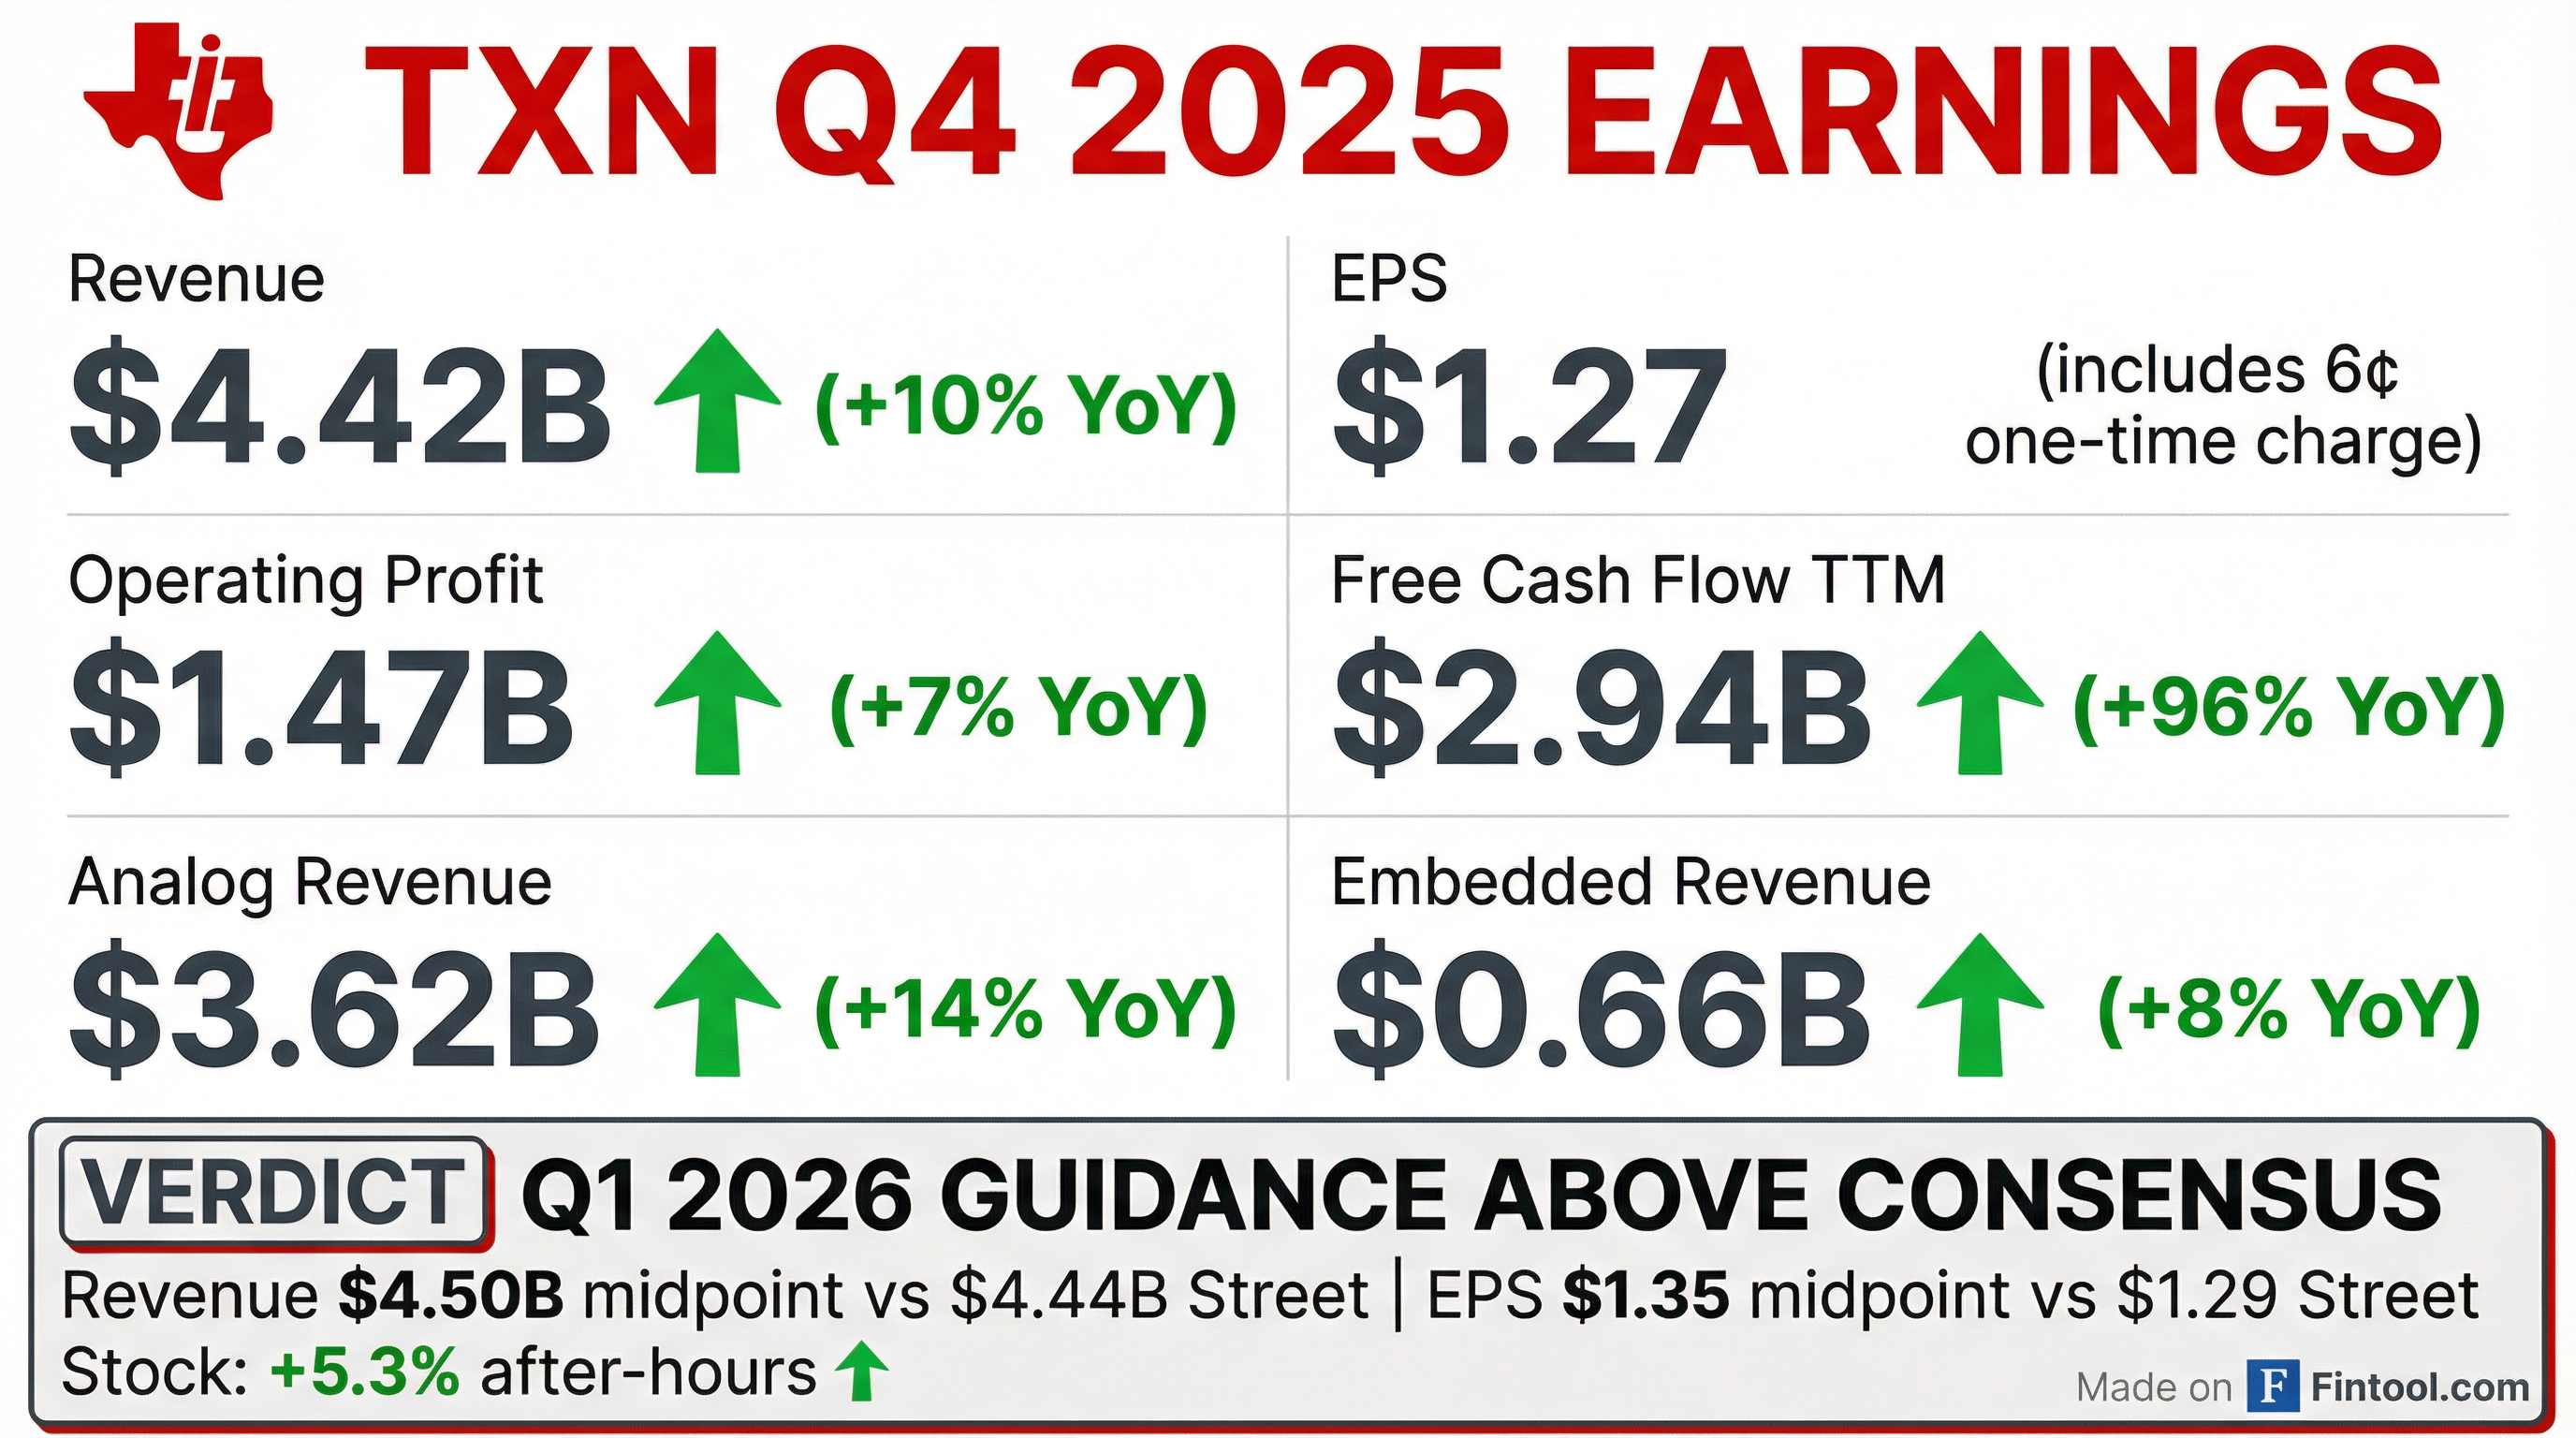
Texas Instruments reported Q4 2025 results that met guidance while delivering a Q1 2026 outlook above Street expectations . Revenue of $4.42 billion increased 10% year-over-year, and EPS of $1.27 included a one-time 6-cent charge. The stock surged over 5% after-hours on the stronger-than-expected forward guidance.
Did Texas Instruments Beat Earnings?
Q4 2025 results came in at the midpoint of guidance provided in October :
Context: The EPS of $1.27 included a 6-cent reduction that was not in the company's original guidance . Excluding this charge, adjusted EPS would have been approximately $1.33, representing a meaningful beat versus guidance.
What Did Management Guide?
Q1 2026 guidance exceeded Street consensus, driving the after-hours rally :
*Values retrieved from S&P Global
The guidance range implies sequential revenue up 2% at the midpoint (from $4.42B in Q4 to $4.50B), a notable improvement from the typical seasonal pattern of flat-to-down in Q1 .
What Changed From Last Quarter?
Sequential Trends (Q3 → Q4 2025):
Key Dynamics:
- Revenue declined 7% sequentially as expected—consistent with Q4 seasonality
- Gross margin compressed due to continued elevated depreciation from capacity investments
- Free cash flow surged 96% YoY on a trailing 12-month basis to $2.94B
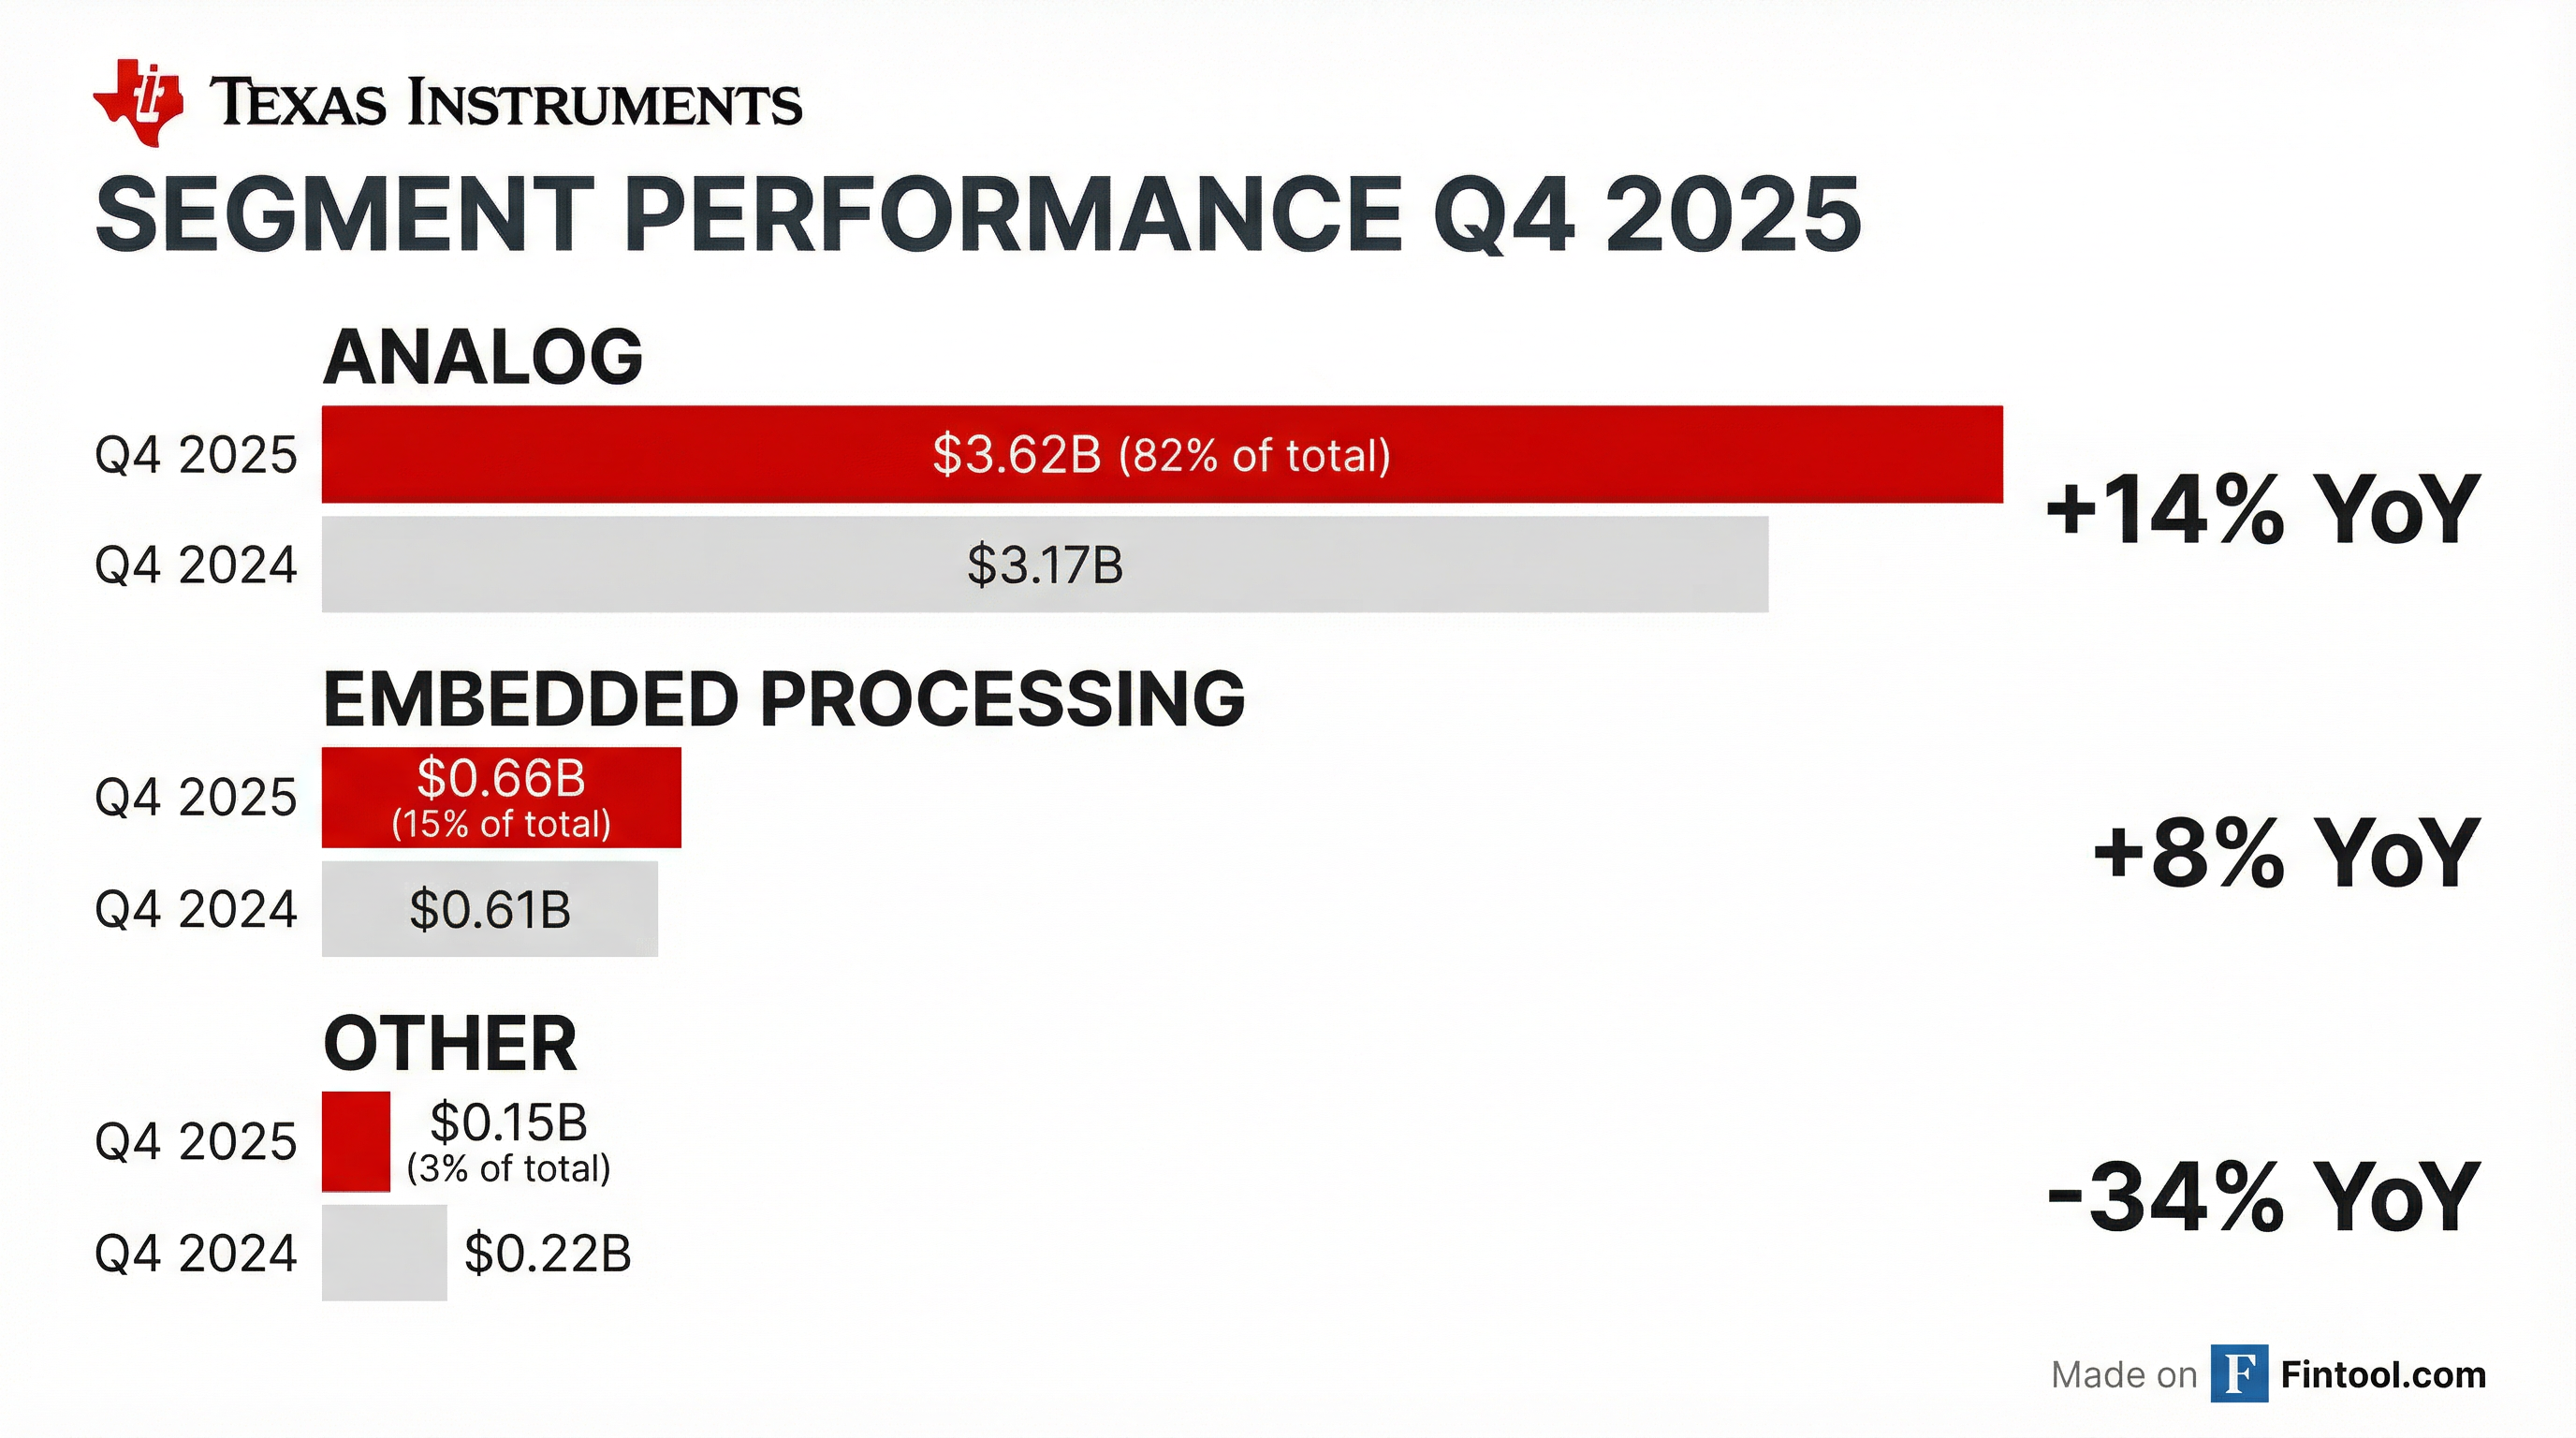
Segment Performance
Analog continues to drive the majority of growth, with all segments up year-over-year :
Full Year 2025 Performance:
- Analog: $14.0B (+15% YoY) with operating profit of $5.4B (+17% YoY)
- Embedded: $2.7B (+6% YoY) with operating profit of $304M (-14% YoY)
End Market Breakdown (New Disclosure)
TI reorganized end market reporting in Q4 2025, adding Data Center as a standalone category to better reflect growth opportunities :
Key Insight: Industrial, automotive, and data center combined now represent 75% of TI revenue, up from 43% in 2013 . These are the company's strategic focus areas where secular content growth is strongest.
Data Center Commentary: Management noted data center has now grown for 7 consecutive quarters, exiting 2025 at approximately $450M/quarter run rate . Most revenue is analog (power and signal chain), with TI's new BCD process in Sherman, Texas supporting higher-power rails for AI accelerators .
Cash Flow and Capital Allocation
Texas Instruments continues to prioritize free cash flow per share growth and shareholder returns :
Shareholder Returns (TTM):
- Dividends: $5.0B (+4% YoY)
- Stock Repurchases: $1.5B (+59% YoY)
- Total Cash Returned: $6.5B (+13% YoY)
Balance Sheet (Dec 31, 2025):
- Cash & Short-term Investments: $4.9B
- Total Debt: $14.0B
- Inventory: $4.8B (218 days)
Q&A Highlights
Why is Q1 guidance above seasonal? This marks the first time in approximately 15 years that TI has guided sequential Q1 revenue up . CEO Haviv Ilan attributed it to:
- Orders improved throughout Q4 and backlog built consistently
- "Turns" business (same-day order requests) running at elevated levels
- Data center continuing to grow and now material to revenue
On pricing: Management confirmed pricing is not driving the above-seasonal guide . TI expects low single-digit price declines (~2-3%) in 2026, consistent with 2025 . No step-function price increases planned—Q1 typically sees slight price pressure from annual contract negotiations .
On industrial recovery: Industrial remains ~25% below 2022 peaks despite recovering . Management sees "a lot of room to go" for secular growth to establish new highs .
On automotive: Automotive revenue has returned to Q3 2023 peak levels . China automotive typically weak in Q1 due to Chinese New Year. Secular content growth continues across ICE and EV platforms .
On memory shortages: Management acknowledged noise around memory shortages could be driving some customer ordering activity, though they couldn't confirm causation .
On inventory: TI is "very pleased" with its $4.8B inventory position, calling it an asset that enables quick customer response . Lead times remain competitive at below 13 weeks on average, with many parts at 6 weeks .
How Did the Stock React?
TXN shares rallied on the guidance surprise:
The positive reaction contrasts sharply with Q3 2025 earnings, when shares fell ~7% after-hours on weaker-than-expected Q4 guidance . The better Q1 2026 outlook appears to signal that the semiconductor recovery is gaining momentum.
Manufacturing & Capacity Update
Sherman Fab (Texas): Ramping ahead of schedule with high yields . New equipment enabling higher throughput than originally planned. Production lines running in Sherman 1 clean room, with Sherman 2 shell available for future expansion .
Lehi Fab (Utah): Insourcing progress from foundry wafers continues . 65-nanometer transition completed in 2025 with yields matching foundry levels. 45-nanometer technology (primarily automotive radar) progressing well .
2026 Capital Guidance:
- CapEx: $2.0B-$3.0B (consistent with prior guidance)
- Depreciation: $2.2B-$2.4B (new disclosure)
- Investment Tax Credit (ITC): Now 35% as of January 1, 2026 for all new CapEx
- Direct CHIPS Act funding: Up to $1.6B remaining to be received as milestones are achieved
Forward Catalysts
Near-Term:
- Capital Management Call: February 24, 2026 at 10:00 AM Central — Management will share approach to capital allocation and progress on manufacturing investments
- Q1 2026 earnings (expected late April 2026)
- Data center now broken out as separate end market—watch for continued growth trajectory
Structural:
- Sherman, Texas fab ramp continues—TI's largest 300mm manufacturing investment
- CHIPS Act incentives providing cash flow tailwind ($670M benefit in 2025)
- Industrial and automotive end market recovery trajectory
- Data center AI infrastructure spending
Key Risks
- Order Sustainability: Management cautioned the recent pickup in orders needs to prove sustainable—the market has been "jittery" over the last 12 months
- China Exposure: China revenue down 7% sequentially in Q4, up 16% YoY . Typically weak Q1 due to Chinese New Year
- Depreciation Headwind: 2026 depreciation expected $2.2B-$2.4B , with upward pressure continuing into 2027 (though at slower rate)
- Competitive Pricing: Low single-digit price declines (~2-3%) expected in 2026
- Personal Electronics Weakness: Q4 PE revenue declined due to China subsidy expiration for TVs/appliances
Updated January 27, 2026 with earnings call transcript details.
Related: TXN Company Profile | Q4 2025 Earnings Transcript | Q3 2025 Earnings