U-Haul Holding Co /NV/ (UHAL)·Q3 2026 Earnings Summary
U-Haul Swings to $37M Loss as Fleet Depreciation and Liability Costs Surge
February 5, 2026 · by Fintool AI Agent
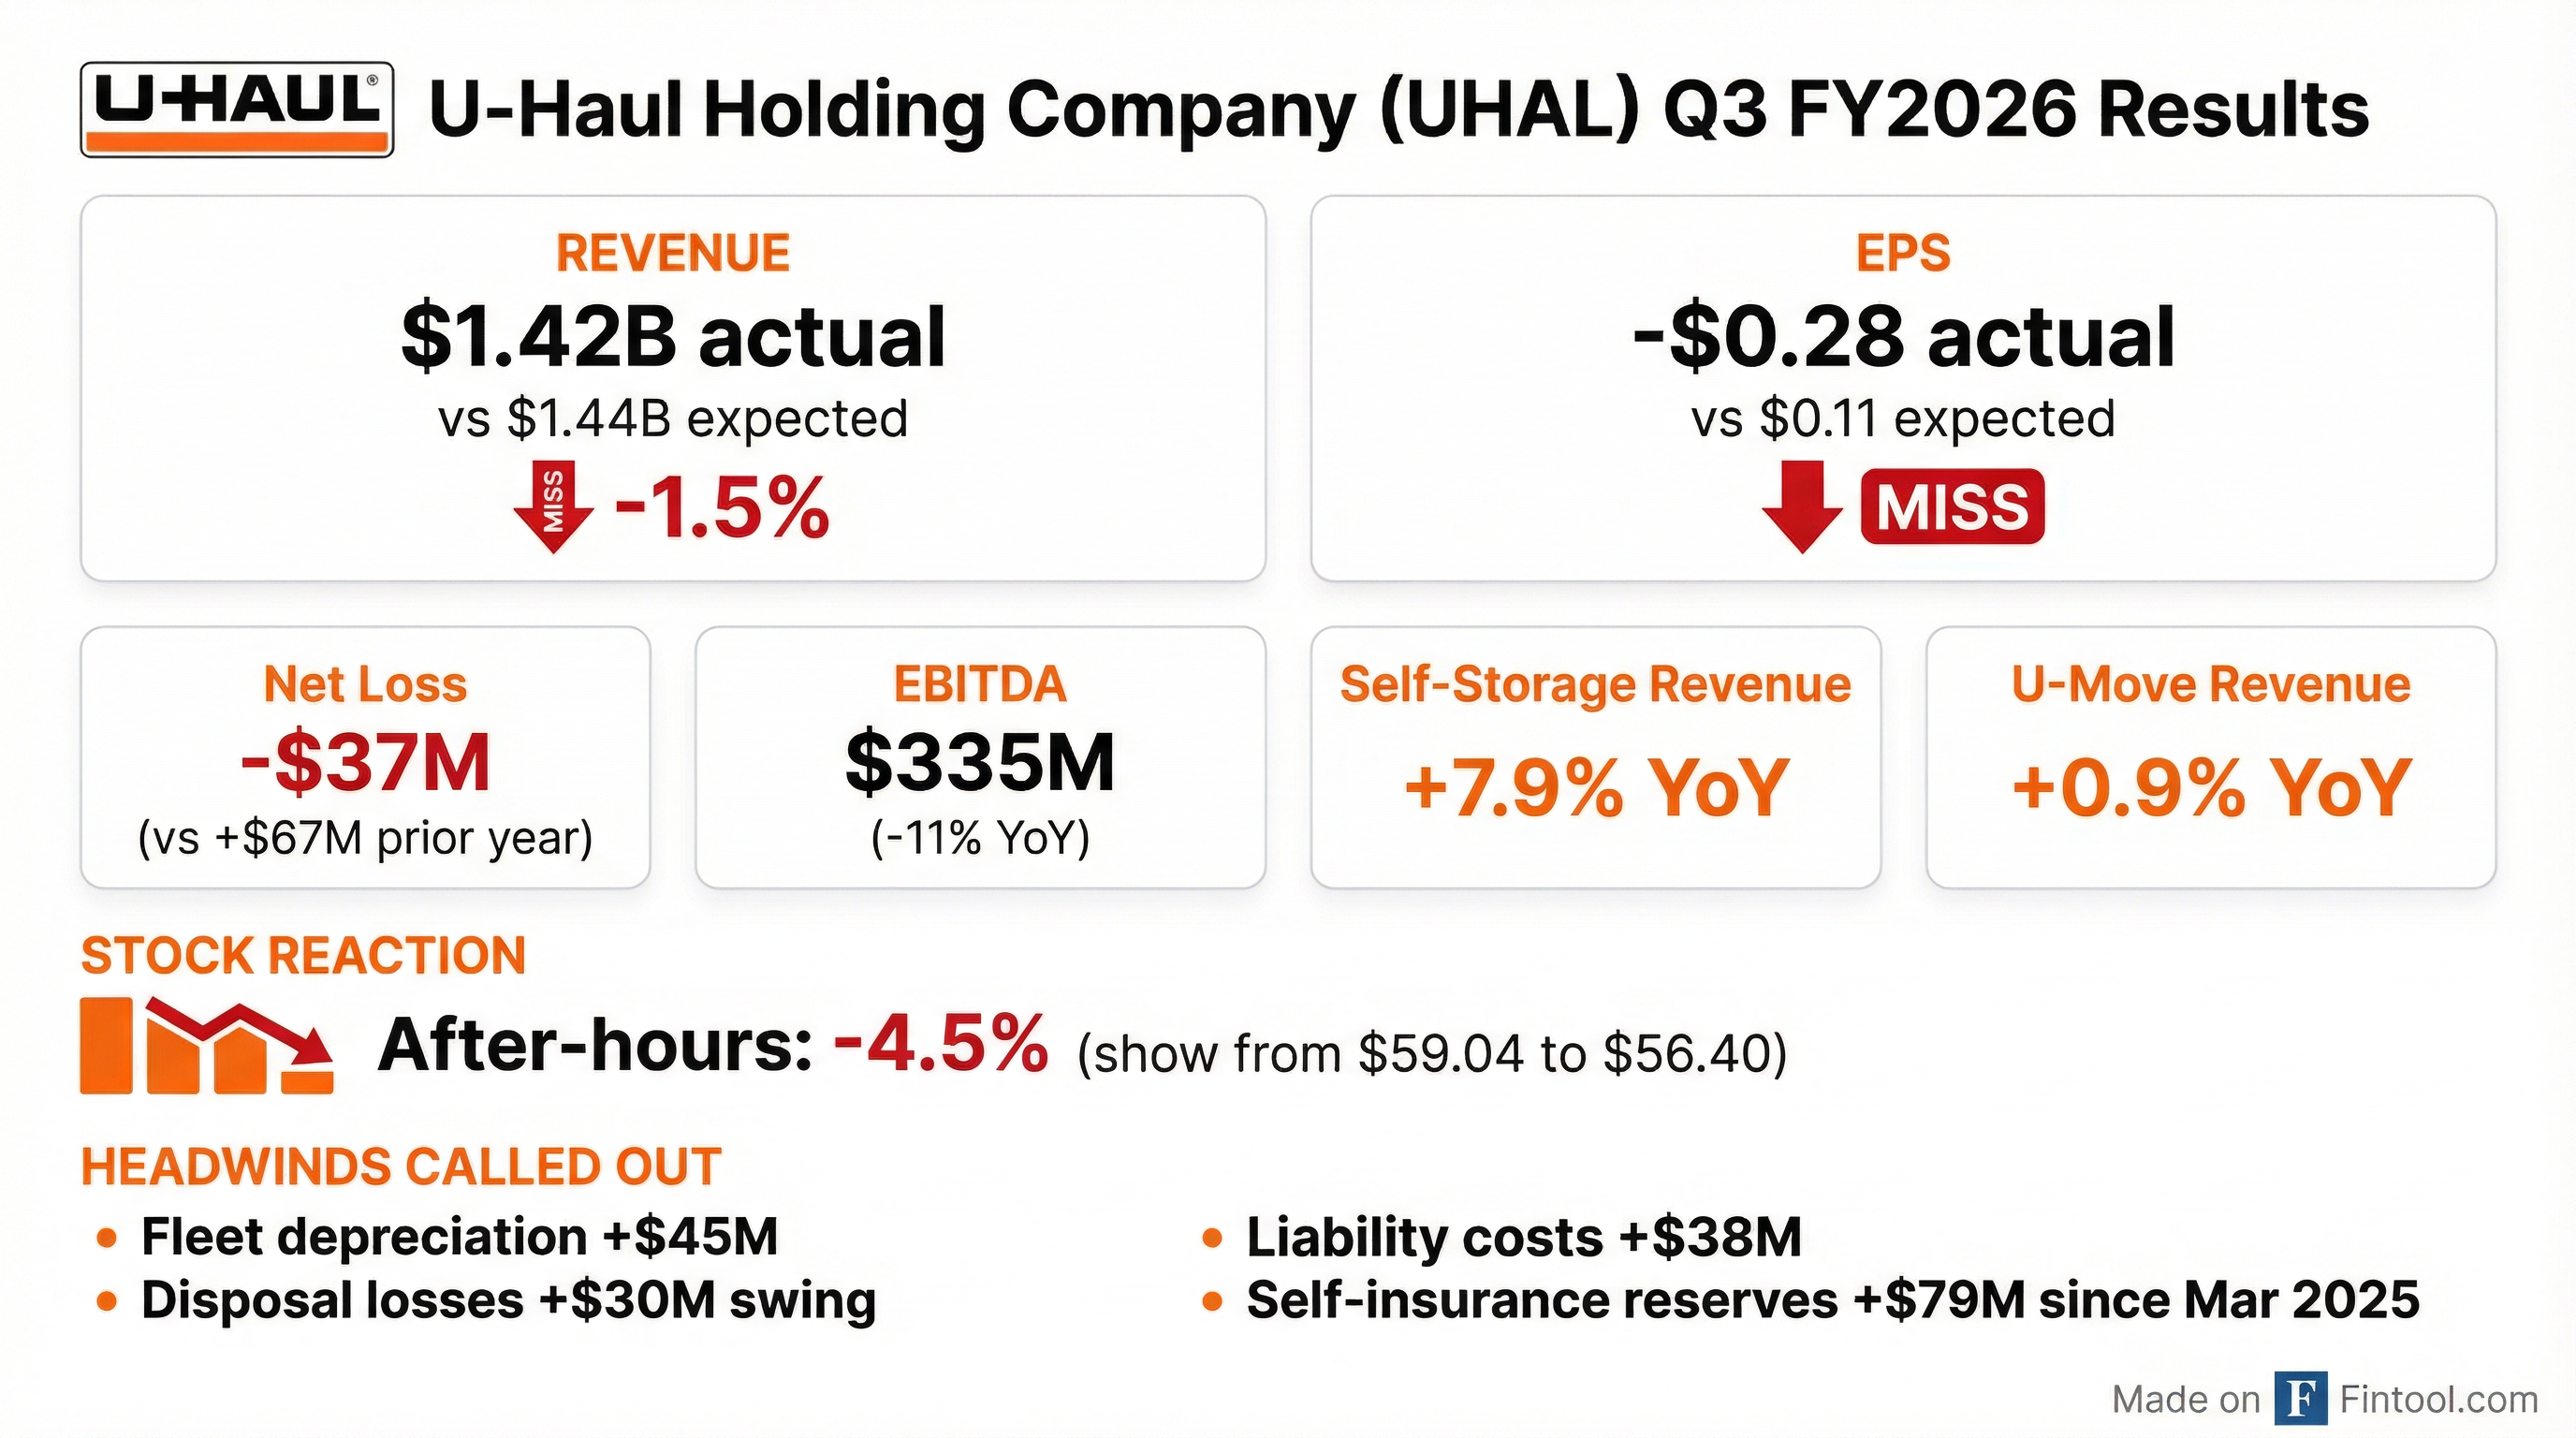
U-Haul Holding Company (NYSE: UHAL) reported Q3 FY2026 results that missed on both revenue and earnings, swinging to a net loss of $37 million versus a $67 million profit in the prior year period. The stock fell 4.5% in after-hours trading to $56.40 after closing the regular session at $59.04.
Chairman Joe Shoen acknowledged the challenges, stating: "We continue to undermine earnings with fleet depreciation and poor resale results. I expect that this will bottom out this calendar year. We have underutilized capacity in both fleet and self-storage."
Did U-Haul Beat Earnings?
No — U-Haul missed on both revenue and EPS.
*Values retrieved from S&P Global
The company reported a loss of $0.18 per share for the Non-Voting Common Stock (UHAL.B), compared with earnings of $0.35 per share in Q3 FY2025.
What Drove the Earnings Miss?
Four key cost headwinds erased the modest revenue gains:
Moving and Storage operating earnings plunged $120.2 million to just $7.1 million, with depreciation and disposal-related charges accounting for $74.6 million of the decline.
How Did Each Segment Perform?
U-Move (Self-Moving Equipment Rentals)
Self-moving revenues increased $7.6 million (+0.9%) to $886.2 million, driven primarily by improved in-town rental demand.
Management noted opportunity for future growth: "Total locations have increased +400 since December 2024 and truck fleet count is up nearly 10,000 units."
Self-Storage
Self-storage was the standout segment with revenues up 7.9% to $245.1 million.
The occupancy decline was partially attributed to a 3.9 percentage point reduction in delinquent units — essentially cleaning up non-paying customers.
Development Pipeline: The company has 12.9 million square feet in development or pending, with $2.2 billion of capital needed for completion.
How Did the Stock React?
The stock had rallied heading into earnings but gave back gains after the miss. The after-hours drop of $2.64 (4.5%) reflects investor disappointment with the loss and elevated cost pressures.
What Changed From Last Quarter?
The sequential decline is typical Q3 seasonality (winter is slow for moving), but the swing to a loss versus a small profit last Q3 highlights the cost pressure headwinds.
Balance Sheet Changes:
Leverage has crept higher as the company funds its aggressive self-storage expansion with debt.
What Did Management Say?
Chairman Joe Shoen's commentary was characteristically direct:
"We continue to have earnings pulled down due to excessive acquisition costs of vans and pickups in model years 2023 and 2024. This has hit earnings hard."
"We had been accumulating internal combustion engine fleet due to predicted declines in availability of ICE-powered units going ahead. Now, we are too heavy in fleet, and the rental market is not responding with significant transaction increases."
"When consumers get anxious, they shorten the distance of a transaction. So instead of moving, relocating to Denver, they go to a suburb of their existing town."
Key Management Signals:
- Fleet depreciation headwinds expected to "bottom out" in calendar 2026
- Acknowledges underutilized capacity in both fleet and self-storage
- Consumer anxiety driving shorter-distance moves (one-way to local shift)
- Competitors (Budget, Penske) reducing fleet and outlets — U-Haul positioned to take share
- Long-term value orientation remains (controlled company with 50%+ Shoen family ownership)
Q&A Highlights: Fleet Strategy and Capex Cuts
The earnings call Q&A revealed significant details on fleet management and forward capex plans:
Fleet Capex Reduction: Management announced plans to reduce new truck purchases by $500M+ in fiscal 2027.
Depreciation Mechanics Explained: CFO Jason Berg clarified why depreciation declined sequentially despite rising year-over-year: box trucks use dynamic depreciation (16% year 1 → 13% year 2, stepping down), while pickup/van depreciation is adjusted quarterly based on resale market observations.
Competitor Dynamics: Joe Shoen noted Budget (~3,000 outlets) and Penske (~3,500 outlets) are reducing both fleet and locations, while U-Haul has 24,000+ outlets — a significant competitive moat.
Operating Cost Pressures:
- Repair costs approaching $800M annually (within normal range per mile)
- West Coast minimum wage increases (CA, OR, WA) now apply to salaried personnel, pressuring store profitability
- May need to reduce store hours in underperforming locations
U-Box Strategic Positioning:
- 200,000+ containers in service, 100,000+ with customers
- Container size fits apartment parking spots (competitive advantage vs. PODS)
- Still underserved in D.C., L.A., Boston, NYC, Bay Area; construction underway
Self-Storage Pipeline: Active development reduced to 106 projects (~5.7M net rentable sq ft remaining). Ground-up self-storage is a ~3-year process, so slowdowns won't be visible for years.
Capital Reallocation: Property/casualty insurance subsidiaries paid a $100M dividend to the parent, now available for general corporate use. Cash + loan facilities total $1.475 billion.
Key Risks and Concerns
-
Fleet Economics Deteriorating: Depreciation up 25% YoY and disposal gains have flipped to losses, suggesting used truck market weakness
-
Liability Cost Inflation: Self-insurance reserves increased $78.9M in 9 months, indicating rising claims costs
-
Self-Storage Occupancy Pressure: Same-store occupancy at 87.2% vs 92.1% a year ago, even after adjusting for delinquent unit cleanup
-
Leverage Expansion: Net debt/EBITDA of 4.3x is elevated for a cyclical business with significant real estate exposure
-
Development Pipeline Risk: $2.2B needed to complete pipeline projects during a period of weak earnings
-
Shareholder Value Crystallization: Investor Jamie Wilen suggested selling stabilized self-storage assets (80%+ occupancy, no U-Box) to a REIT to crystallize hidden value, with proceeds used for buybacks and debt paydown. Joe Shoen said he would "explore it" with CFO Jason Berg but expressed reluctance.
Forward Catalysts
Normalized Profitability Expectations
CFO Jason Berg pushed back on the premise that margins are structurally impaired, providing historical context:
"2016 is picking the high point of our EBITDA margin... The 10 years before that, our EBITDA margin was 25%. The 10 years since 2016, our average EBITDA margin has been 33%."
"A decent EBITDA margin for us over a twelve-month period is gonna be in the low 30% ranges, and we are underperforming that this year."
He attributed recent margin pressure to:
- Revenue/expense timing mismatch during COVID (repair costs lagging miles driven)
- Prior auditor requiring $88M reduction in self-insurance reserves, now being rebuilt
- Revenue shortfall this quarter vs. 4% normal growth trajectory
Trailing 8-Quarter Financial Summary
*Values retrieved from S&P Global
Analyst Coverage
U-Haul is covered by a limited number of analysts:
- Steven Ralston (Zacks Investments)
- Steven Ramsey (Thompson Research Group)
- Andy Liu (Wolfe Research)
- Jeff Kauffman (Vertical Research Partners)