Earnings summaries and quarterly performance for UNITED PARCEL SERVICE.
Executive leadership at UNITED PARCEL SERVICE.
Carol Tomé
Chief Executive Officer
Brian Dykes
Chief Financial Officer
Bala Subramanian
Chief Digital and Technology Officer
Kate Gutmann
President International, Healthcare and Supply Chain Solutions
Nando Cesarone
President U.S. and UPS Airline
Norman Brothers
Chief Legal and Compliance Officer
Board of directors at UNITED PARCEL SERVICE.
Angela Hwang
Director
Christiana Smith Shi
Director
Eva Boratto
Director
Franck Moison
Director
John Morikis
Director
Kate Johnson
Director
Kevin Clark
Director
Kevin Warsh
Director
Rodney Adkins
Director
Russell Stokes
Director
Wayne Hewett
Director
William Johnson
Independent Board Chair
Research analysts who have asked questions during UNITED PARCEL SERVICE earnings calls.
Jordan Alliger
Goldman Sachs
9 questions for UPS
David Vernon
Sanford C. Bernstein & Co., LLC
8 questions for UPS
Ken Hoexter
BofA Securities
8 questions for UPS
Ariel Rosa
Citigroup
6 questions for UPS
Brian Ossenbeck
JPMorgan Chase & Co.
6 questions for UPS
Christian Wetherbee
Wells Fargo
6 questions for UPS
J. Bruce Chan
Stifel
6 questions for UPS
Ravi Shanker
Morgan Stanley
6 questions for UPS
Scott Group
Wolfe Research
6 questions for UPS
Stephanie Moore
Jefferies
5 questions for UPS
Bascome Majors
Susquehanna Financial Group
4 questions for UPS
Brandon Oglenski
Barclays
4 questions for UPS
Jason Seidl
TD Cowen
4 questions for UPS
Thomas Wadewitz
UBS
4 questions for UPS
Tom Wadewitz
UBS Group
4 questions for UPS
Conor Cunningham
Melius Research
3 questions for UPS
Jonathan Chappell
Evercore ISI
3 questions for UPS
Bruce Chan
Stifel Financial Corp.
2 questions for UPS
Chris Wetherbee
Wells Fargo & Company
2 questions for UPS
Joseph Lawrence Hafling
Jefferies
2 questions for UPS
Richa Harnain
Deutsche Bank
2 questions for UPS
Ari Rosa
Citigroup Inc.
1 question for UPS
Ben Mohr
Citigroup Inc.
1 question for UPS
Daniel Imbro
Stephens Inc.
1 question for UPS
Jake Lacks
Wolfe Research, LLC
1 question for UPS
Justine Weiss
Bernstein
1 question for UPS
Ken Hoekster
Bank of America
1 question for UPS
Ravi Shankar
Morgan Stanley
1 question for UPS
Rob Salmon
Wells Fargo & Company
1 question for UPS
Recent press releases and 8-K filings for UPS.
- Reiterated 2026 guidance for slightly higher revenue and flat EPS, with first-half headwinds from Amazon volume reductions, USPS outsourcing and MD-11 write-offs, and anticipated margin recovery in the second half to fuel long-term growth and margin expansion.
- Accelerating network reconfiguration by right-sizing U.S. capacity—closing 93 buildings in 2025 and 24 more in H1 2026—removing 2 million Amazon pieces/day over two years, and investing in automation to build a leaner, more productive ground network.
- Launched a Driver Choice Program, offering lump-sum payouts to over 100,000 union drivers to accelerate voluntary attrition; related charges expected in Q2 2026 with labor cost savings thereafter.
- Prioritizing capital allocation with $6.5 billion in free cash flow guidance, $3 billion in CapEx (3–3.5% of revenue), maintaining ~2.5× debt/EBITDA leverage, and a flat dividend to stabilize payout ratios.
- 2026 guidance sees slightly up revenue and flat EPS, with H1 headwinds from the Amazon drawdown, MD-11 fleet write-off, and USPS volume transition, and H2 recovery with low-single-digit revenue growth and margin expansion
- Three strategic pillars: Amazon volume reduction of 2 M pieces/day (~$5 B revenue) to boost network efficiency; the largest network reconfiguration in UPS’s 118-year history with automation and capacity right-sizing; and partial outsourcing of Ground Saver (SurePost) back to USPS
- 2026 cost-reduction targets include removing 25 M operational hours, cutting 30 k positions, and closing 24 buildings in H1, supported by the Driver Choice Program for early retirements
- CapEx guided at $3 B (~3% of revenue) focused on automation and new air hubs, with $6.5 B free cash flow, dividend held flat at ~50% payout, and debt/EBITDA ~2.5x
- UPS reiterated its 2026 guidance for slightly higher revenue and flat EPS, with first‐half margin pressure from the Amazon volume reduction, network reconfiguration and tariff headwinds, followed by low-single-digit revenue growth and margin recovery in the second half.
- The company will shed ~$5 billion of Amazon revenue (about 2 million pieces/day) over two years, cutting 25 million operational hours, closing 73 buildings and eliminating 30,000 positions in 2025, with another 1 million pieces/day reduction, 24 facility closures and a Driver Choice Program for ~100,000 drivers in 1H26.
- UPS is executing the largest network reconfiguration in its 118-year history, right-sizing ground and air capacity and investing in automation to build a leaner, more productive network optimized for B2B, SMB and healthcare logistics.
- The Ground Saver (SurePost) economy product will be partially outsourced back to USPS after service-driven insourcing in 2024, with rate adjustments and the shedding of low-value Chinese e-commerce volume now largely wrapped.
- Capital allocation priorities include generating $6.5 billion of free cash flow in 2026, maintaining ~2.5× debt/EBITDA, investing $3 billion in CapEx (a 10-year low), holding the dividend flat to rebuild to a 50–60% payout ratio, and pursuing tuck-in M&A in healthcare.
- UPS will eliminate 30,000 operational roles in 2026 via attrition and a voluntary separation program for full-time drivers, alongside closure of roughly two dozen facilities and network consolidation.
- These cuts follow approximately 48,000 job eliminations in 2025 as UPS continues to unwind about 1 million Amazon packages per day, shifting toward higher-margin shipments.
- The restructuring delivered $3.5 billion in savings in 2025 and is expected to yield an additional $3 billion in cost reductions in 2026.
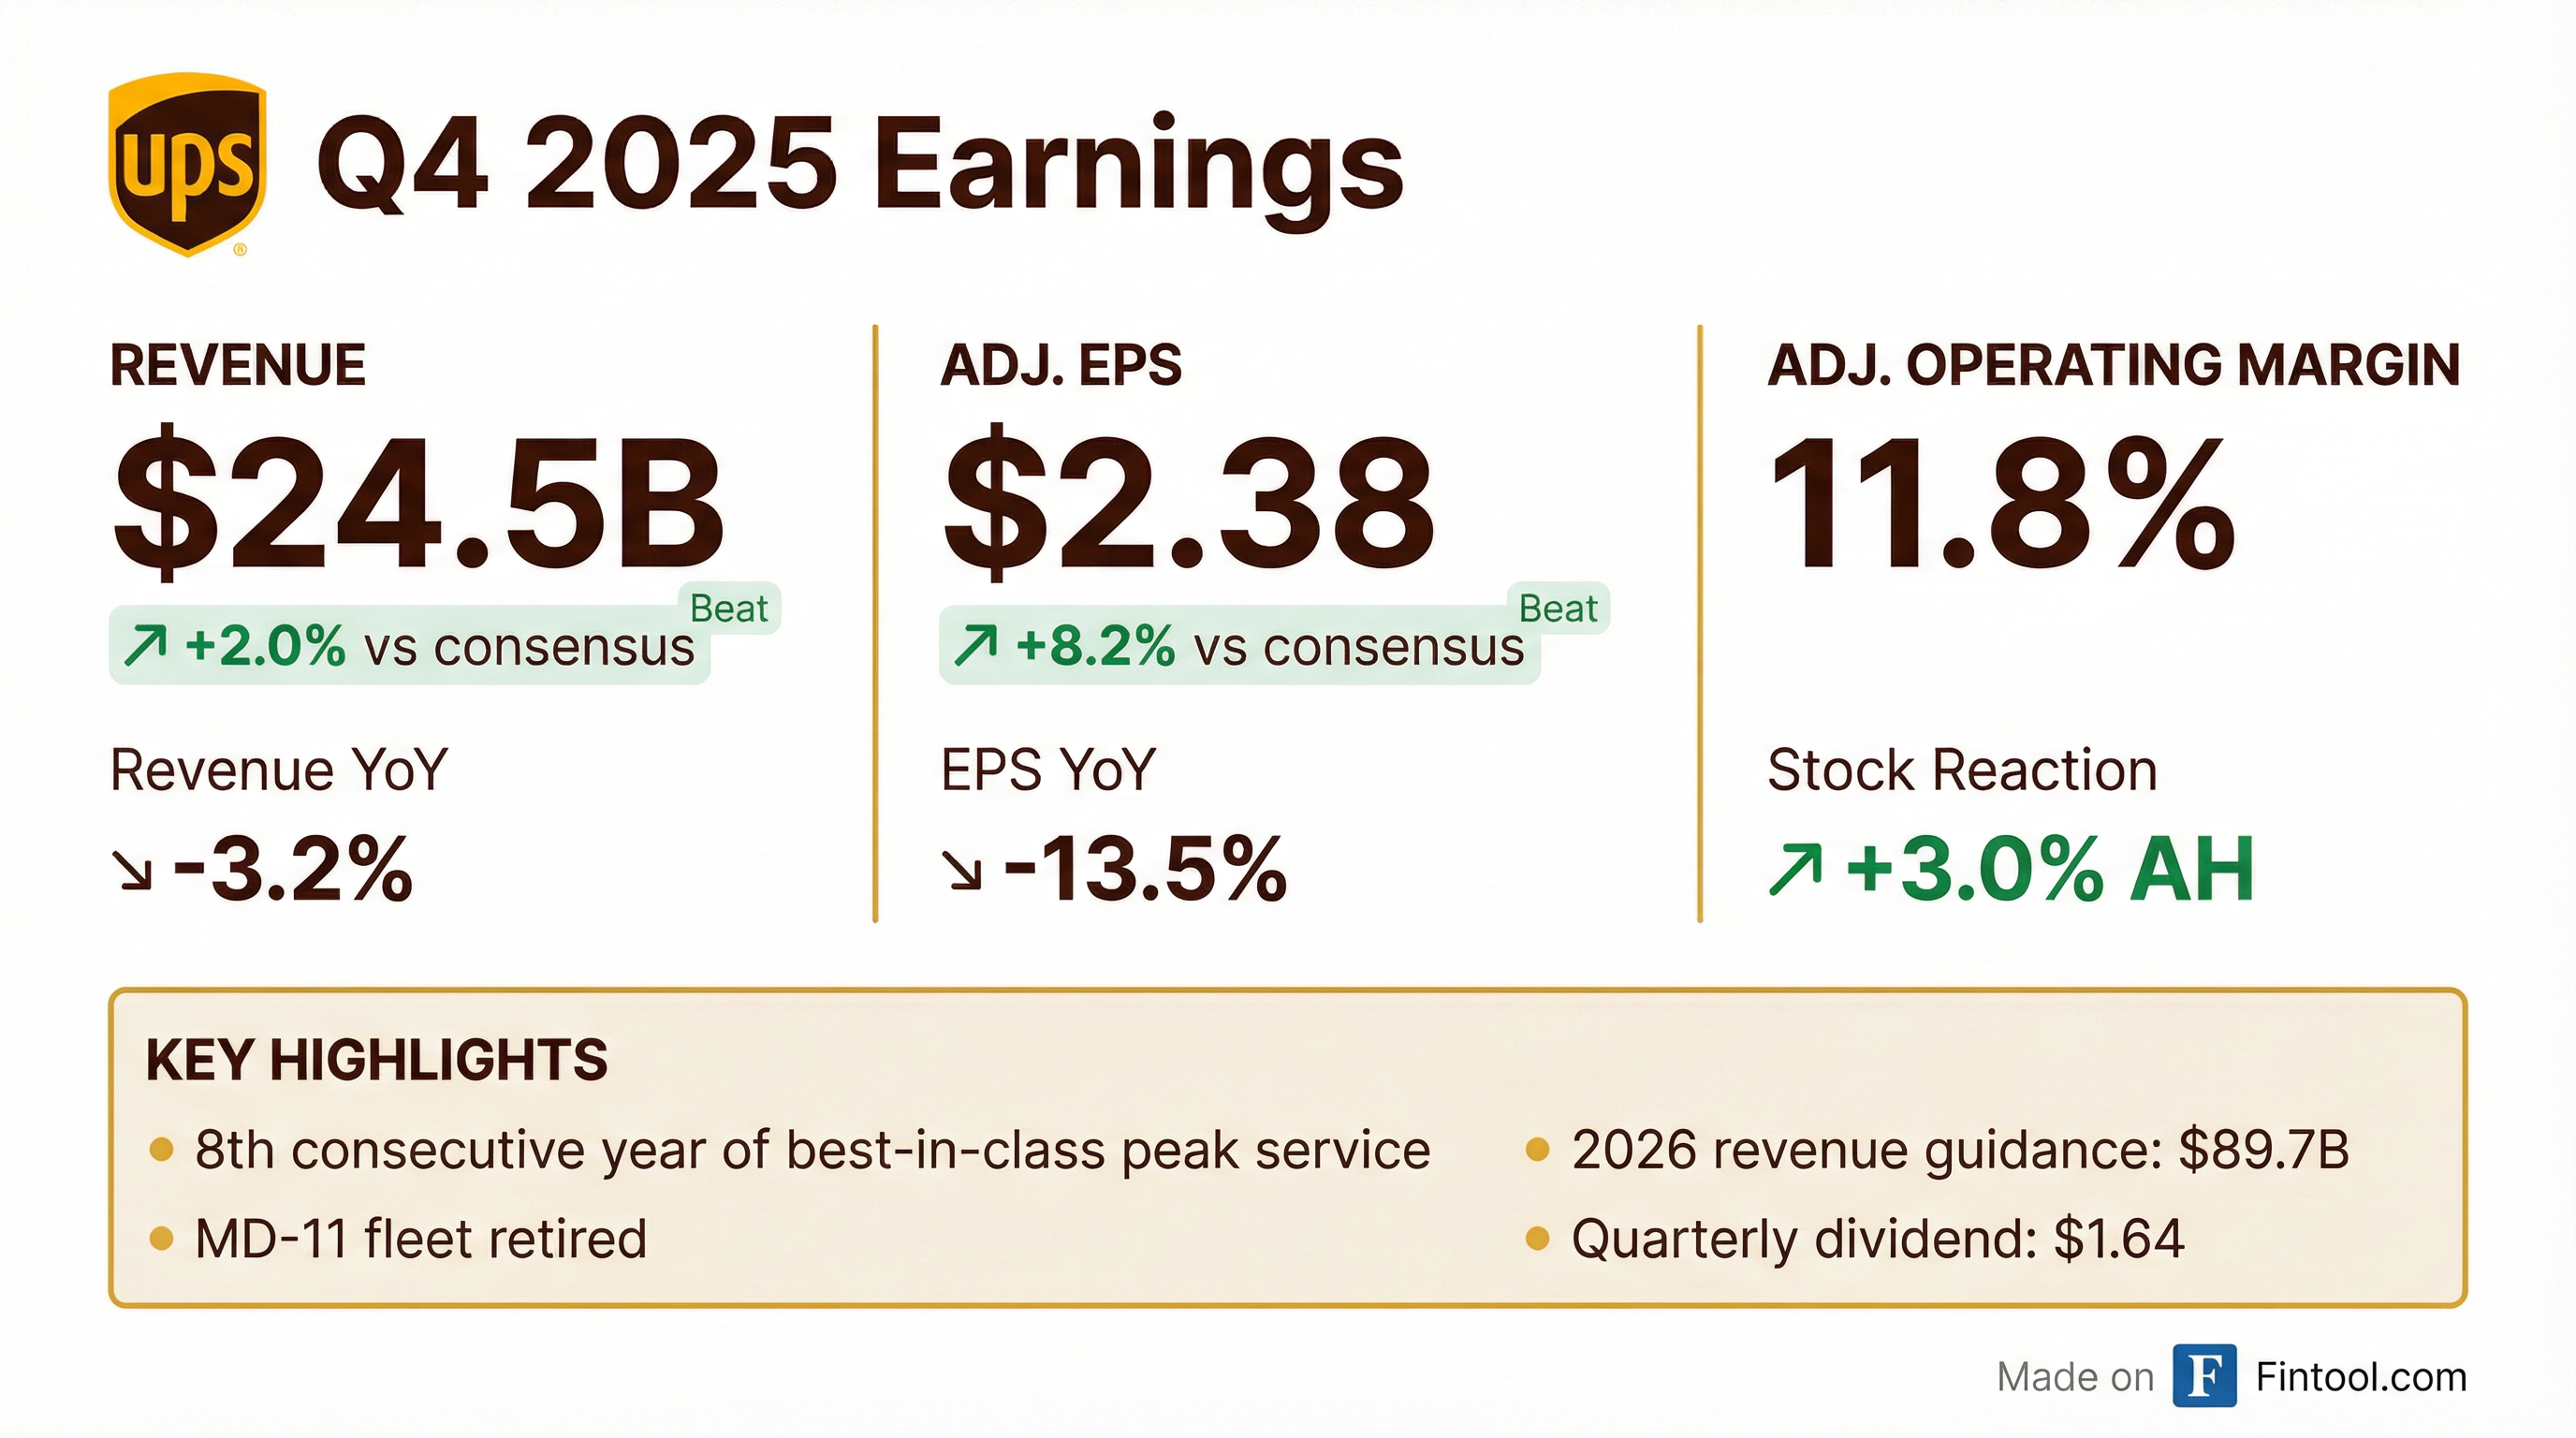
- UPS recorded a $137 million non-cash after-tax charge to retire its MD-11 fleet and projected 2026 revenue of about $89.7 billion, sending its shares up roughly 2.8% in early trading.
- UPS reported Q4 2025 consolidated revenue of $24.5 billion, operating profit of $2.9 billion (11.8% margin), and diluted EPS of $2.38; FY 2025 revenue was $88.7 billion with $8.7 billion in operating profit (9.8% margin).
- U.S. Domestic Q4 revenue declined 3.2% YoY to $16.8 billion on a 10.8% ADV drop, offset by an 8.3% increase in revenue per piece; operating margin was 10.2%.
- International segment Q4 revenue rose 2.5% YoY to $5.0 billion (ADV down 4.7%), delivering an 18% operating margin; Supply Chain Solutions revenue was $2.7 billion (–$388 million YoY) with a 10.3% margin.
- For full-year 2026, UPS expects revenue of $89.7 billion, operating margin of 9.6%, and flat EPS vs. 2025.
- UPS reported Q4 2025 consolidated revenue of $24.5 billion, operating profit of $2.9 billion, and an operating margin of 11.8%; full-year 2025 revenue was $88.7 billion with operating profit of $8.7 billion and a 9.8% margin
- U.S. Domestic Q4 revenue was $16.8 billion (–3.2% YoY) on an average daily volume decline of 10.8%, offset by 8.3% growth in revenue per piece; segment operating margin was 10.2%
- International Q4 revenue rose 2.5% to $5.0 billion despite a 4.7% volume decline, delivering an operating margin of 18%; Supply Chain Solutions generated $2.7 billion in revenue with a 10.3% margin
- For 2026, UPS expects consolidated revenue of ~$89.7 billion, operating margin of ~9.6%, and diluted EPS to be flat to 2025; the company will reduce Amazon volume by another 1 million pieces/day and target $3 billion in related savings
- Q4 consolidated revenue of $24.5 billion, operating profit of $2.9 billion, and operating margin of 11.8%; FY 2025 revenue $88.7 billion, operating profit $8.7 billion, margin 9.8%.
- Delivered $3.5 billion in savings from network reconfiguration, reduced Amazon volume by ~1 million pieces/day, and grew U.S. revenue per piece by 7.1%; SMB penetration reached 31.8% of U.S. volume.
- Took a $137 million after-tax charge to retire the MD-11 fleet, planning to take delivery of 18 Boeing 767 aircraft over the next 15 months.
- Issued 2026 guidance: revenue ~$89.7 billion, operating margin ~9.6%, EPS ~flat to 2025; expects U.S. ADV down mid-single digits offset by mid-single-digit revenue-per-piece growth, with first-half margin pressure and second-half profit rebound.
- Completed acquisitions of Frigo-Trans and Andlauer Healthcare, expanding healthcare cold chain capabilities, with global healthcare revenue of $11.2 billion in 2025.
- UPS completed accelerated retirement of its McDonnell Douglas MD-11 freighters during Q4 2025, as part of a broader fleet modernization after the Nov. 4, 2025 crash.
- The retirements led to a $137 million noncash, after-tax charge, contributing to $238 million in total special charges for the quarter.
- UPS will replace much of the retired capacity with newer Boeing 767s and other freighters over the coming year, underscoring a safety-driven fleet pivot.
- UPS delivered adjusted EPS of $2.38 on $24.5 billion in revenue, topping expectations and driving a ~4% stock rise on the upbeat outlook.
- Reported diluted EPS of $2.10 after $0.28 per share in one-off charges from MD-11 fleet write-offs and restructuring costs.
- Domestic U.S. package revenue declined about 3.2% to $16.8 billion, while international package revenue rose 2.5% to $5.1 billion, with revenue per piece up 7.1%.
- Issued 2026 guidance of $89.7 billion in revenue and a non-GAAP adjusted operating margin near 9.6%, alongside planned capital spending and dividends; CEO Tomé labels 2026 an “inflection point” as Amazon business declines.
- Consolidated revenue of $24.5 billion and GAAP operating margin of 10.5%; diluted EPS of $2.10 (non-GAAP $2.38) for Q4 2025.
- Fiscal-year 2025 revenue of $88.7 billion, operating profit of $7.9 billion (non-GAAP $8.7 billion), and diluted EPS of $6.56 (non-GAAP $7.16).
- GAAP Q4 results include $238 million in charges (or $0.28/share) for the write-off of the MD-11 aircraft fleet and transformation costs.
- Board declares first-quarter 2026 dividend of $1.64 per share, payable March 5, 2026.
Fintool News
In-depth analysis and coverage of UNITED PARCEL SERVICE.

UPS and Teamsters Clash Over $150,000 Driver Buyouts as 10,000+ May Accept

January Layoffs Hit 108,000—Highest Since the 2009 Financial Crisis

UPS Cuts 30,000 More Jobs as Amazon Exodus Enters Final Phase

UPS Cutting 30,000 More Jobs as Amazon Breakup Reaches Finale
Quarterly earnings call transcripts for UNITED PARCEL SERVICE.
Ask Fintool AI Agent
Get instant answers from SEC filings, earnings calls & more