UNIVEST FINANCIAL (UVSP)·Q4 2025 Earnings Summary
Univest Financial Posts 21% EPS Growth, Beats on Revenue and Earnings
January 29, 2026 · by Fintool AI Agent
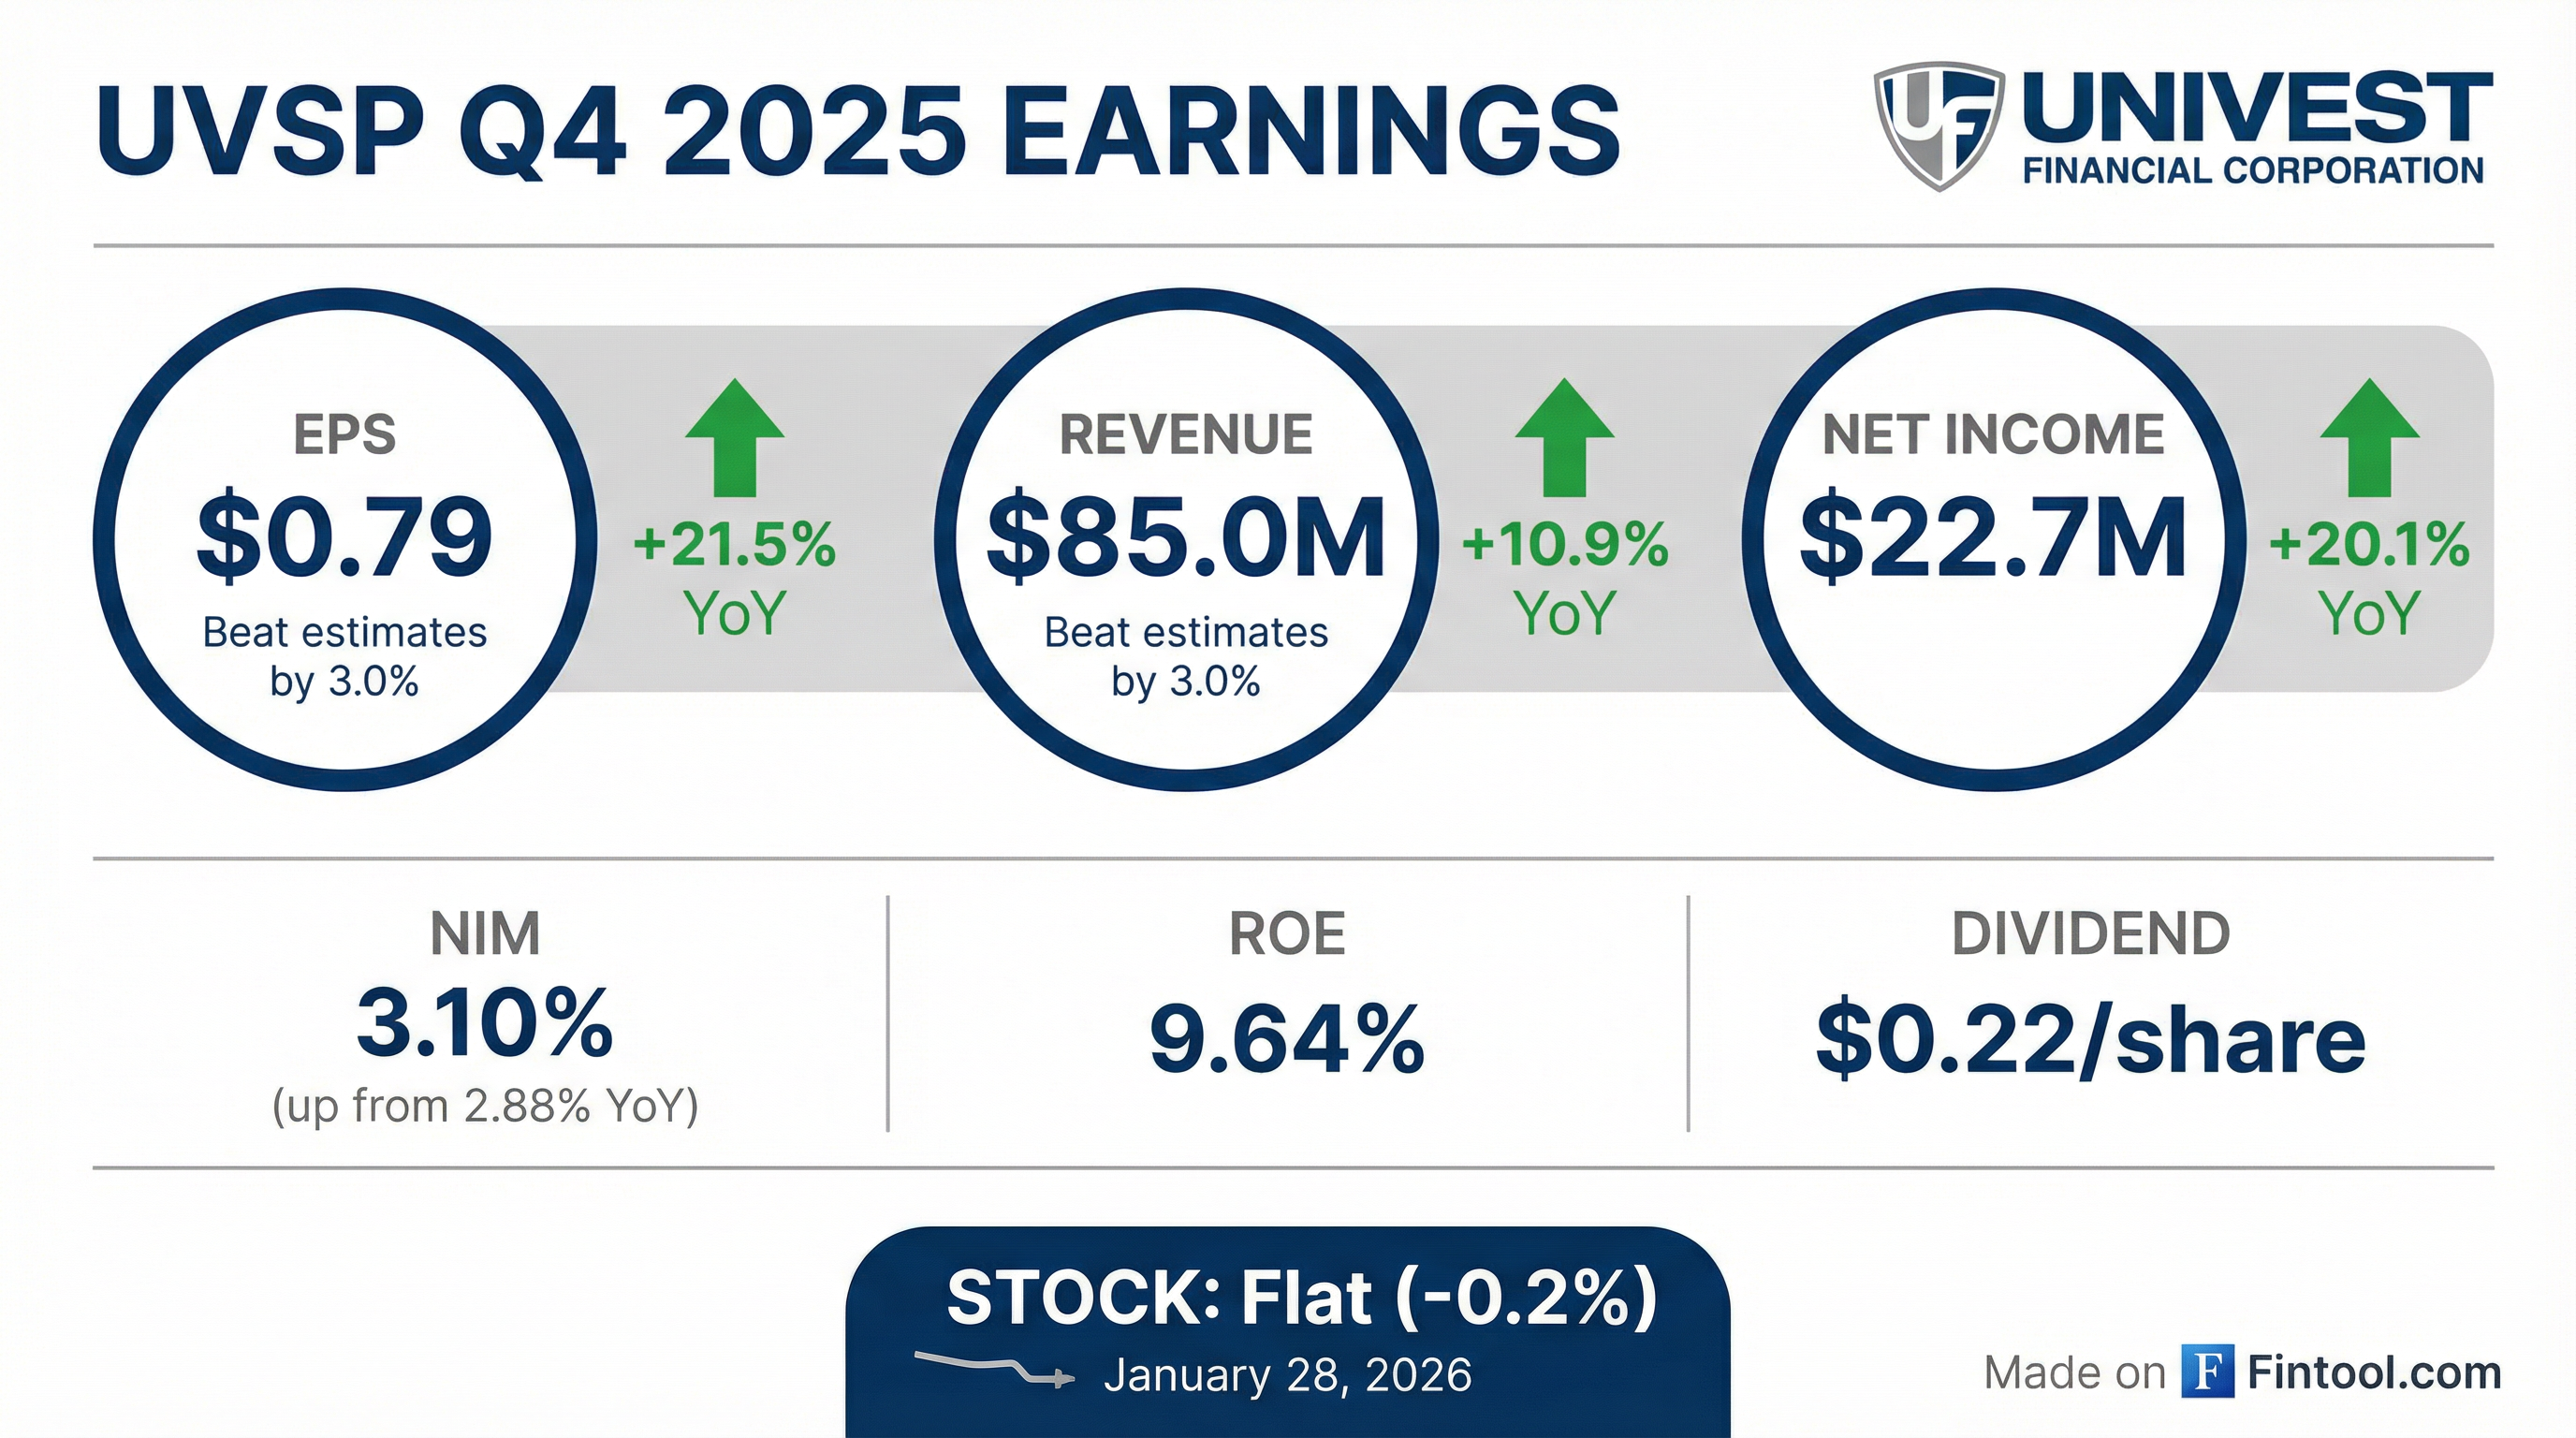
Univest Financial Corporation (NASDAQ: UVSP) delivered a strong fourth quarter with diluted EPS of $0.79, up 21.5% year-over-year and beating consensus estimates by 3.0%. The Pennsylvania-based regional bank posted net income of $22.7 million on revenue of $85.0 million, exceeding analyst expectations on both metrics.
The results cap a strong fiscal 2025, with full-year EPS of $3.13 representing a record earnings per share for the company. CEO Jeff Schweitzer noted the company had "solid loan growth during the fourth quarter" as payoff pressures normalized.
Did Univest Beat Earnings?
Yes — beating on both EPS and revenue, extending the streak to 8 consecutive quarters.
Univest has beaten EPS estimates in each of the past 8 quarters, demonstrating consistent execution in a challenging rate environment.
Historical EPS Performance (Last 8 Quarters):
Values from S&P Global
What Drove the Results?
Net Interest Income Expansion
Net interest income of $62.5 million increased 12.8% year-over-year and 2.0% sequentially, driven by:
- Higher loan yields with commercial loan growth
- Lower cost of funds — down to 2.60% from 2.88% YoY
- Increased average earning assets — $8.1B vs $7.7B YoY
Net Interest Margin expanded to 3.10% from 2.88% a year ago (up 22 bps), though it compressed slightly from 3.17% in Q3 2025 due to excess liquidity carrying costs.
CFO Richardson noted that while reported NIM compressed 7 bps sequentially due to excess liquidity, core NIM (excluding excess liquidity) actually increased 4 bps from Q3 to 3.37%. This demonstrates the underlying improvement in the earning asset portfolio.
Loan and Deposit Trends
Loan Growth: Gross loans and leases increased $129.3 million (7.6% annualized) from Q3 2025. Management noted that prepayment activity normalized in Q4 after elevated levels in the first three quarters. Looking ahead, COO Keim indicated loan growth will be "much more heavily oriented towards the commercial side" with declines in residential mortgage as the bank shifts from on-balance sheet construction-to-perm loans to agency products.
Deposit Dynamics: Total deposits decreased $130.8 million from Q3 2025, primarily due to a $198.8 million decrease in public funds, partially offset by an $84 million increase in consumer balances. For the full year of 2025, total deposits grew by $328.1 million, or 4.9%.
What Changed From Last Quarter?
Key sequential changes from Q3 to Q4 2025:
The sequential decline was primarily driven by:
- Excess liquidity drag — Cash position increased to $554M, reducing NIM by 27 bps vs 16 bps in Q3
- Higher provision for credit losses — $3.1M vs $517K in Q3
- Increased operating expenses — Up $2.0M sequentially on higher salaries and professional fees
However, Q3 2025's $0.89 EPS was an unusually strong quarter. The Q4 result of $0.79 still represents robust 21.5% YoY growth.
How Is Asset Quality?
Asset quality improved significantly in Q4:
Nonperforming assets declined to $37.8 million from $52.1 million in Q3 2025, driven by a $13.9 million payoff of a nonaccrual commercial loan relationship with a $449K recovery.
The allowance for credit losses remains stable at 1.28% of loans, providing adequate coverage with ACL/NPLs at 637%.
What Did Management Guide for 2026?
CFO Brian Richardson provided comprehensive 2026 guidance on the earnings call:
*Excluding $2.1M BOLI death benefits
Key assumptions underlying guidance:
- Two 25 basis point Fed rate cuts in 2026
- Modest NIM expansion expected
- ALM neutrality means Fed actions won't materially impact NII
On NIM trajectory, Richardson noted: "Compared to where we are as of the fourth quarter, I'd expect it to be relatively in line to slightly up, if you look over that full, full year time horizon."
Capital Return and Dividend
Dividend Increase: Univest declared a quarterly dividend of $0.22 per share (up from $0.21 YoY), payable February 25, 2026 to shareholders of record February 11, 2026.
Share Repurchases: The company repurchased approximately 400,000 shares at an average cost of $32.17 (including fees and excise taxes) during Q4. For full year 2025, Univest repurchased 1.1 million shares at $30.75 average cost—representing 3.9% of shares outstanding. On December 10, 2025, the Board approved an additional 2 million shares for repurchase, bringing total authorization to 2.3 million shares.
Capital Ratios remain strong:
- CET1 Ratio: 11.22%
- Total Risk-Based Capital: 13.86%
- Tangible Book Value: $27.20/share (+11.3% YoY)
Q&A Highlights
Deposit Competition — COO Mike Keim addressed pricing dynamics: "Competition remains and has been, and to your point, in some regards, has increased slightly... We're not at the top of the market, but we're close enough that our customers continue to stay with us."
Public Funds Seasonality — CFO Richardson noted: "As it relates to public funds outflow, we expect $100 million-$150 million per quarter in the first and second quarter to flow out." This will help deploy excess liquidity and improve NIM.
Ag Portfolio Risk — With farm sector concerns in the news, Keim clarified: "Our ag book is not an agribusiness book. It is smaller family farms that diversify across... dairy, crops, livestock. Almost all instances were secured by the real estate." Average loan sizes are small with conservative underwriting.
Loan Yield Compression — Richardson noted new commercial loan rates fell 40-50 bps following Fed action, but emphasized: "We haven't seen true spread compression, just overall new offering rate compression based on the interest rate environment."
Deposit Initiatives — Management is pursuing multiple deposit growth strategies:
- Title company initiative gaining momentum
- Labor union initiative (started 2 years ago)
- Law firm initiative launching soon
- Money market campaigns tested in Western PA and Maryland
Buyback Philosophy — Richardson explained the capital return approach: "We're looking to not grow regulatory capital meaningfully from a ratio perspective... earnings and balance sheet growth are the two things that play in."
How Did the Stock React?
Modest positive reaction: Stock up +0.5% following the call.
UVSP is trading at $33.59, up 0.5% from the prior close of $33.42, following the Q4 earnings release and conference call on January 29, 2026.
Current Valuation:
- Market Cap: ~$956M
- P/E (TTM): 10.7x (based on $3.13 FY25 EPS)
- P/TBV: 1.24x
- Dividend Yield: 2.6%
- 52-Week Range: $22.83 - $35.65
The measured positive reaction reflects solid execution with no major surprises, as the guidance was in line with expectations and the beat streak continues.
Full Year 2025 Summary
Key Takeaways
- Beat streak continues — 8 consecutive quarters of EPS beats demonstrates consistent execution
- NIM expansion story intact — Up 28 bps YoY on full-year basis despite excess liquidity drag; management expects "flat to slightly up" in 2026
- Constructive 2026 guidance — NII growth of 4-6%, loan growth accelerating to 2-3%, expense discipline at 3-5%
- Asset quality improving — NPA resolution drove significant Q4 improvement; provision guidance of $11-13M suggests stable credit
- Capital return accelerating — Dividend raised, buyback targeting $10-12M per quarter, 2.3M shares authorized
Watch for in 2026:
- Deployment of excess liquidity ($100-150M outflow per quarter in Q1/Q2)
- Continued commercial loan growth (residential mortgage portfolio declining)
- Success of deposit initiatives (title companies, labor unions, law firms)
- Credit trends in CRE portfolio ($3.6B, 52% of loans)
This article includes information from the Q4 2025 earnings call held January 29, 2026.
Related Links: