Earnings summaries and quarterly performance for Veralto.
Executive leadership at Veralto.
Jennifer L. Honeycutt
President and Chief Executive Officer
Kimberly Y. Chainey
Senior Vice President, Chief Legal Officer
Mattias Byström
Senior Vice President and Chief Segment Officer, Product Quality and Innovation
Melissa Aquino
Senior Vice President and Chief Segment Officer, Water Quality
Sameer Ralhan
Senior Vice President and Chief Financial Officer
Sylvia Stein
Senior Vice President, Chief Legal Officer
Board of directors at Veralto.
Cindy L. Wallis-Lage
Director
Daniel L. Comas
Director
Françoise Colpron
Director
Heath A. Mitts
Director
John T. Schwieters
Director
Linda Filler
Chair of the Board
Shyam P. Kambeyanda
Director
Thomas L. Williams
Director
Vijay P. Sankaran
Director
Walter G. Lohr, Jr.
Director
William H. King
Director
Research analysts who have asked questions during Veralto earnings calls.
Deane Dray
RBC Capital Markets
8 questions for VLTO
John McNulty
BMO Capital Markets
7 questions for VLTO
Andrew Buscaglia
BNP Paribas
6 questions for VLTO
Brian Lee
Goldman Sachs Group, Inc.
6 questions for VLTO
Andrew Krill
Deutsche Bank
5 questions for VLTO
Jacob Levinson
Melius Research
5 questions for VLTO
Andy Kaplowitz
Citigroup Inc.
4 questions for VLTO
Michael Halloran
Baird
4 questions for VLTO
Nathan Jones
Stifel
4 questions for VLTO
Nathan Jones
Stifel, Nicolaus & Company, Incorporated
4 questions for VLTO
Andrew Kaplowitz
Citigroup
3 questions for VLTO
Bobby Zolper
Raymond James
2 questions for VLTO
Brad Hewitt
Wolfe Research, LLC
2 questions for VLTO
Ryan Connors
Northcoast Research Partners
2 questions for VLTO
Will Grippin
Barclays
2 questions for VLTO
William Griffin
Barclays
2 questions for VLTO
Bradley Hewitt
Wolfe Research
1 question for VLTO
Damian Karas
UBS
1 question for VLTO
James
Jefferies
1 question for VLTO
James Schumm
TD Cowen
1 question for VLTO
Jeffrey Sprague
Vertical Research Partners
1 question for VLTO
Joseph Giordano
TD Cowen
1 question for VLTO
Nathalia Rodriguez
Citigroup
1 question for VLTO
Saree Boroditsky
Jefferies
1 question for VLTO
Scott Davis
Melius Research
1 question for VLTO
Recent press releases and 8-K filings for VLTO.
- Veralto delivered $5.5 billion in full-year 2025 sales (up 6% YoY), 4.7% core sales growth, $3.90 adjusted EPS (up 10%), and generated over $1 billion of free cash flow; the board also approved a $750 million share repurchase program and an 18% dividend increase.
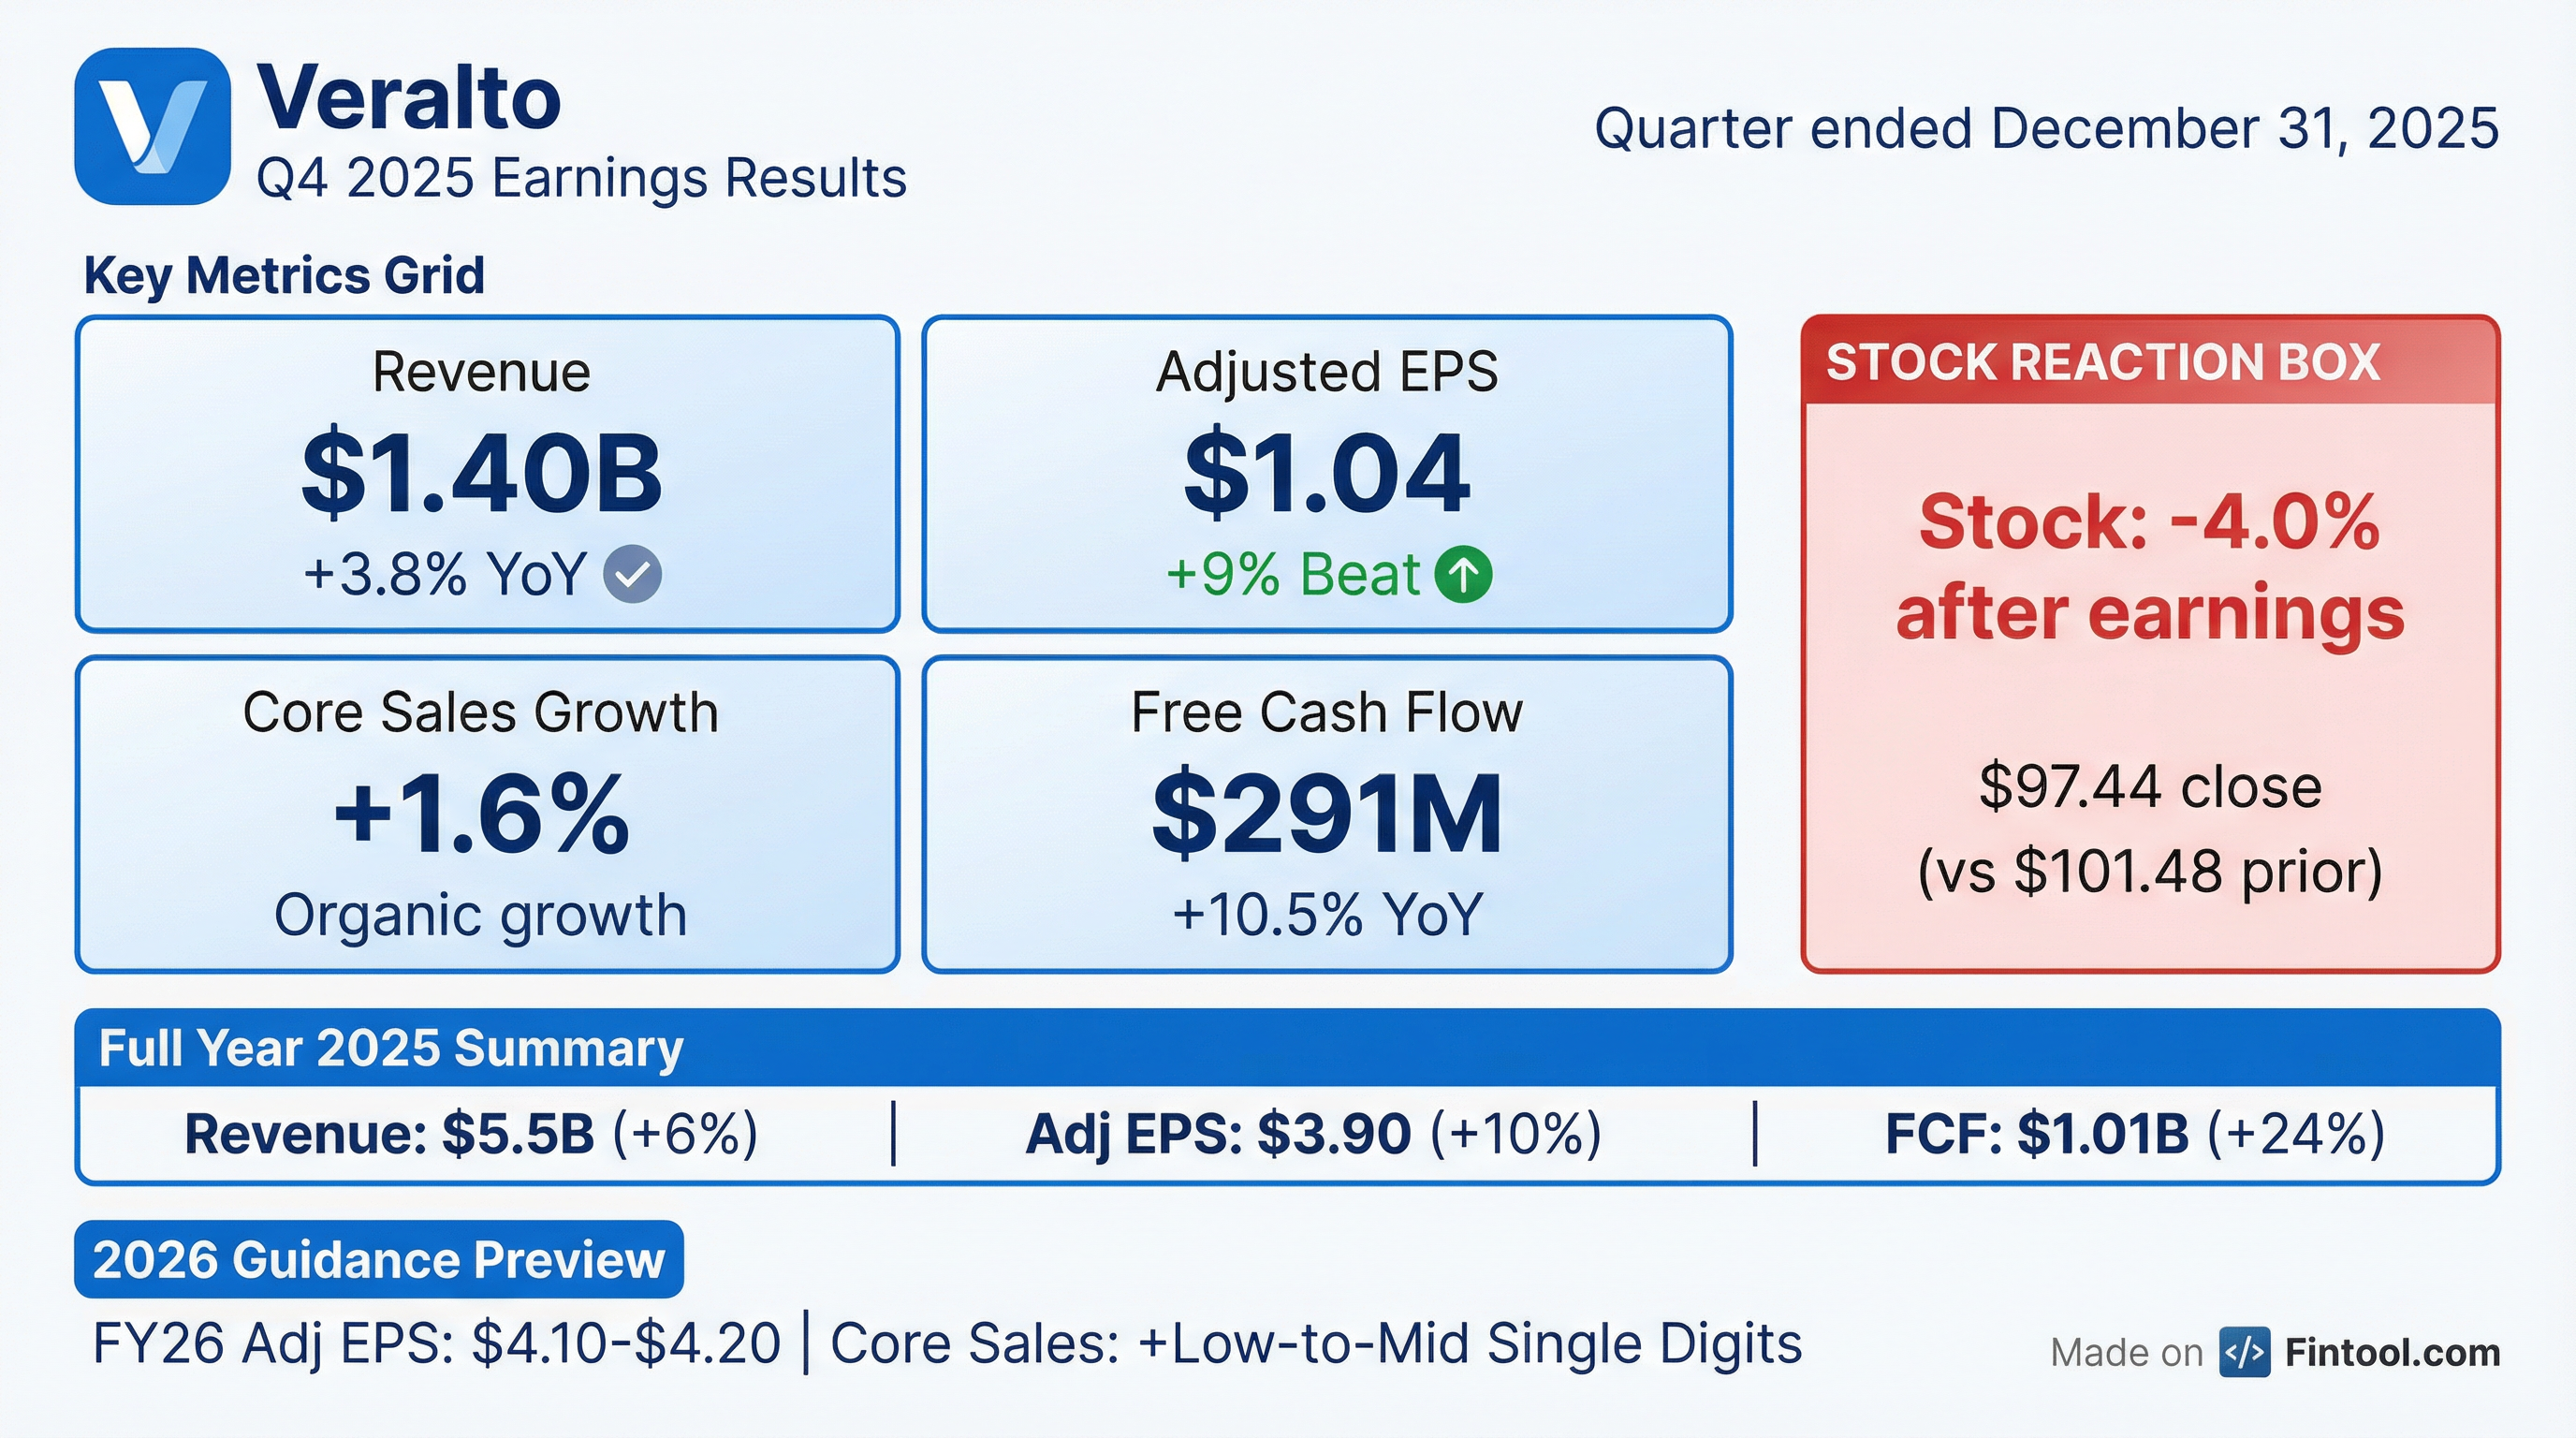
- In Q4 2025, total sales rose 3.8% to $1.4 billion, core sales grew 1.6%, gross profit was $828 million (59.3% margin), adjusted operating margin reached 24.6%, adjusted EPS was $1.04 (up 9%), and free cash flow was $291 million (115% of GAAP net income).
- At quarter end, gross debt stood at $2.7 billion with $2 billion cash on hand, net debt of $642 million (0.5× leverage); early-2026 acquisition of In-Situ was funded with $427 million net cash, and capital allocation remains balanced between M&A and buybacks.
- For 2026, Veralto targets low- to mid-single-digit core sales growth (mid- to high-single-digit total growth including FX and acquisitions), 25 bps of adjusted operating margin expansion, $4.10–$4.20 EPS (mid- to high-single-digit growth), and ~100% free cash flow conversion.
- Strategic progress includes launches of a new ammonia analyzer, expanded single-use Chemkeys, a UV laser marking system, and an AI-enabled packaging print solution, alongside the integration of In-Situ to broaden its water analytics portfolio.
- Veralto’s Q4 sales rose 3.8% year-over-year to $1.4 billion; core sales grew 1.6%, adjusted EPS was $1.04 (+9%), and free cash flow reached $291 million (115% conversion).
- For full-year 2025, total sales were $5.5 billion (+6%), core sales grew 4.7%, adjusted EPS was $3.90 (+10%), and free cash flow exceeded $1 billion.
- Water Quality segment Q4 sales were $846 million (+4.3%) with a 25.9% adjusted operating margin; PQI segment Q4 sales were $550 million (+3.0%) with a 26.5% margin.
- At Q4 end, net debt stood at $642 million (0.5× leverage); early-2026 acquisition of In-Situ cost $427 million; board approved a $750 million share buyback and raised the dividend by 18%.
- 2026 guidance: target low- to mid-single-digit core sales growth; adjusted EPS $4.10–$4.20 (+mid- to high-single digits); ~25 bp margin expansion; ~100% free cash flow conversion.
- Q4 sales reached $1.396 billion, up 3.8% year-over-year with core sales growth of 1.6%.
- Adjusted diluted EPS was $1.04, a 9% increase versus Q4 2024.
- Adjusted operating margin expanded 80 bps to 24.6% year-over-year.
- Free cash flow totaled $291 million, up 10.6% and representing 115% conversion of net earnings to cash.
- Q1 2026E core sales growth is guided at ~flat to low-single digits, with full-year 2026E at low- to mid-single digits.
- Veralto’s total Q4 sales rose 3.8% year-over-year to $1.4 billion, core sales grew 1.6%, adjusted EPS was $1.04, and free cash flow was $291 million (115% conversion).
- For FY 2025, sales reached $5.5 billion (+6%), core sales +4.7%, adjusted EPS $3.90 (+10%), and free cash flow exceeded $1 billion; the board approved an 18% dividend increase and a $750 million share repurchase program.
- 2026 guidance targets low- to mid-single-digit core sales growth, mid- to high-single-digit total sales growth, adjusted EPS of $4.10–4.20, ~25 basis points of margin expansion, and ~100% free cash flow conversion.
- Completed the acquisition of In-Situ early in Q1 2026 for a net cash outflow of $427 million, expected to add ~150 basis points of sales growth and broaden Veralto’s water analytics portfolio.
- Balance sheet remains strong with $2 billion cash, $2.7 billion gross debt, and 0.5x net leverage at quarter-end.
- In Q4 2025, sales rose 3.8% year-over-year to $1,396 million with net earnings of $254 million (or $1.01 per diluted share); non-GAAP core sales growth was 1.6% and operating profit margin was 22.6% (24.6% non-GAAP).
- For full-year 2025, sales increased 6.0% to $5,503 million, net earnings were $940 million (or $3.76 per diluted share), and non-GAAP adjusted net earnings were $977 million (or $3.90 per share).
- The company completed the acquisition of In-Situ, established a $750 million share repurchase program and announced an 18% dividend increase during Q4 2025.
- 2026 guidance anticipates non-GAAP core sales growth of flat to low-single digits in Q1 (adj. EPS $0.97–$1.01) and low-to-mid-single-digit core sales growth for the full year (adj. EPS $4.10–$4.20) with ~100% free cash flow conversion.
- In Q4 2025, sales rose 3.8% to $1,396 million, operating profit margin was 22.6%, net earnings were $254 million ($1.01 diluted EPS), and non-GAAP net earnings were $261 million ($1.04 diluted EPS).
- For full-year 2025, sales increased 6.0% to $5,503 million, operating profit margin was 23.2%, net earnings were $940 million ($3.76 diluted EPS), and non-GAAP net earnings were $977 million ($3.90 diluted EPS).
- Cash flow highlights: Q4 operating cash flow was $311 million with non-GAAP free cash flow of $291 million; full-year operating cash flow was $1,077 million with non-GAAP free cash flow of $1,014 million.
- Capital allocation actions included the acquisition of In-Situ, a $750 million share repurchase program, and an 18% dividend increase.
- 2026 guidance: Q1 non-GAAP core sales growth flat to low-single digits, adjusted operating profit margin ~24.5%, adjusted EPS $0.97–1.01; full-year non-GAAP core sales growth low-to-mid-single digits, margin expansion ~25 bps, adjusted EPS $4.10–4.20, and free cash flow conversion ~100%.
- Veralto agreed to acquire Colorado-based In-Situ for $435 million (approx. $422 million net of tax benefits), closing expected in Q1 2026.
- The purchase price represents about 19× In-Situ’s 2025 estimated EBITDA, inclusive of $11 million in projected pre-tax run-rate cost synergies by end of year three.
- In-Situ is forecast to deliver roughly $80 million in 2025 sales with a 50% gross margin and mid-teens EBITDA margin.
- Veralto’s board authorized a $750 million share repurchase program for its common stock, to be executed over time.
- Q3 total sales were $1.4 billion, up 6.9% year-over-year; core sales grew 5.1% (volume +2.7%, price +2.4%), with currency adding 150 bps to growth.
- Water Quality segment sales of $856 million, up 7% with core growth of 5.3% and adjusted operating margin of 26.3% (+150 bps); PQI segment sales of $548 million, up 6.9% with core growth of 4.6%.
- Adjusted EPS of $0.99, up 11% year-over-year and $0.04 above guidance; free cash flow of $258 million, up 20% year-over-year.
- Raised full-year 2025 Adjusted EPS guidance to $3.82–3.85 and free cash flow conversion target to ~100% of GAAP net income; Q4 EPS guidance set at $0.95–0.98.
- Sales were $1.404 billion in Q3 2025, up 6.9% YoY with 5.1% core growth
- Adjusted operating profit was $336 million (23.9% margin), down 20 bps YoY
- Adjusted EPS rose 11.2% YoY to $0.99
- Free cash flow reached $258 million, representing 108% conversion
- Company guides Q4 2025 EPS of $0.95–0.98 and FY 2025 EPS of $3.82–3.85, with mid-single-digit core sales growth
- Q3 total sales were $1.4 billion, up 6.9% YoY; core sales grew 5.1% (volume +2.7%, price +2.4%), adjusted EPS was $0.99 (+11% YoY) and free cash flow reached $258 million (+20%)
- Segment performance: Water Quality sales of $856 million (+7%; core +5.3%) and PQI sales of $548 million (+6.9%; core +4.6%); recurring revenue comprised 62% of total sales
- Profitability expanded with gross profit of $844 million (+8%) and a 60.1% margin (+50 bps); adjusted operating margin was 23.9%, with Water Quality at 26.3% (+150 bps) and PQI at 25.4%
- Raised full-year guidance: adjusted EPS to $3.82–$3.85 and free cash flow conversion to ~100%; Q4 sales growth expected mid-single digits with a ~3% currency benefit
Quarterly earnings call transcripts for Veralto.
Ask Fintool AI Agent
Get instant answers from SEC filings, earnings calls & more