Western New England Bancorp (WNEB)·Q4 2025 Earnings Summary
Western New England Bancorp Posts Best Quarter in Years as NIM Hits 2.89%
January 27, 2026 · by Fintool AI Agent
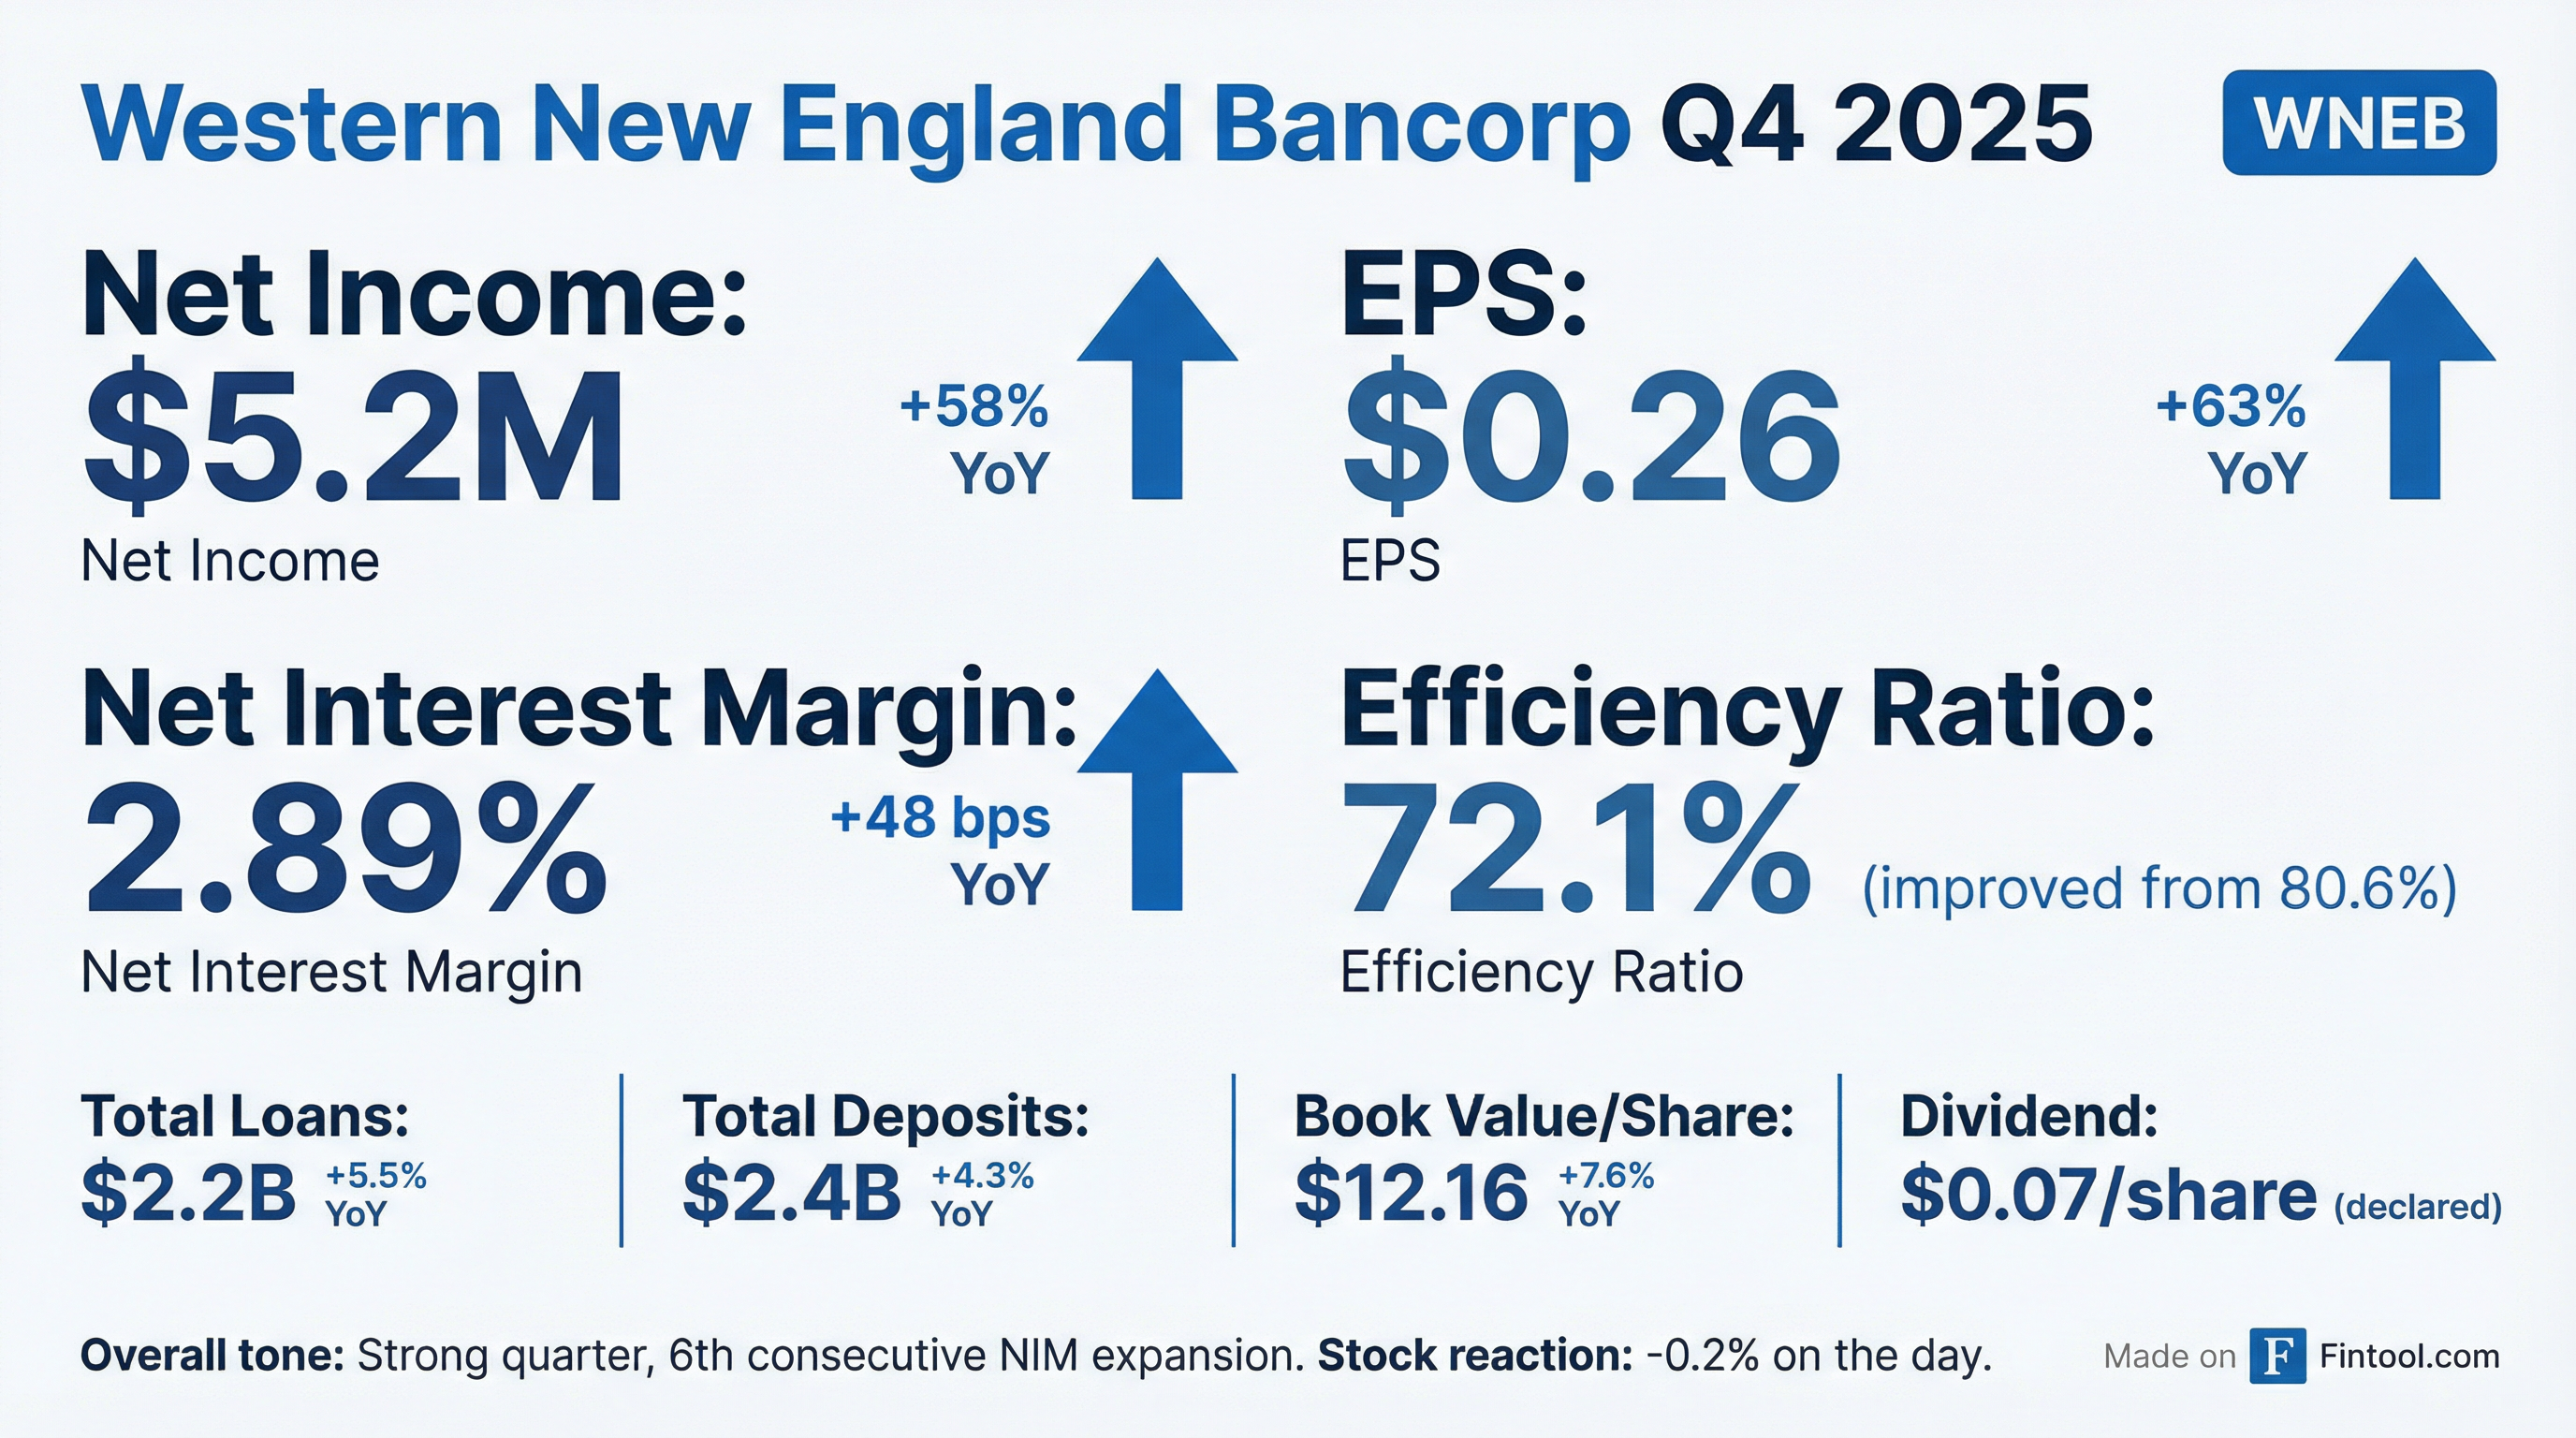
Western New England Bancorp (WNEB) delivered its strongest quarterly performance in recent memory, with EPS surging 63% year-over-year to $0.26 as the community bank continued its net interest margin expansion streak. The Westfield, Massachusetts-based bank reported net income of $5.2 million for Q4 2025, up from $3.3 million a year ago, driven by disciplined deposit pricing and steady loan growth.
Shares traded flat on the day, closing at $12.82—just 8% below their 52-week high of $13.95.
Did WNEB Beat Earnings?
WNEB has limited sell-side coverage, making traditional beat/miss analysis difficult. However, the results speak for themselves:
CEO James Hagan highlighted the significance: "This is the sixth consecutive quarter of growth in both net interest income and net interest margin for the Company."
What's Driving the Margin Expansion?
The 48 basis point NIM improvement YoY was the headline story. Key drivers:
Asset yields rising:
- Average loan yield increased 17 bps to 5.03% (tax-equivalent: 5.06%)
- Average loans grew $104M (+5.0%) YoY
Funding costs declining:
- Average cost of total funds fell 32 bps to 1.88%
- Time deposit costs dropped 85 bps to 3.46% (from 4.31% YoY)
- Zero brokered deposits at quarter-end
Deposit mix favorable:
- Non-interest-bearing deposits: 25.2% of total deposits
- Core deposits: 70.8% of total deposits (+190 bps YoY)
How Did the Stock React?
WNEB shares were essentially flat on the earnings release, down 0.2% to $12.82. The muted reaction likely reflects:
- Results largely anticipated — NIM expansion trend was well-established
- Valuation fair — Stock trades at 1.05x tangible book value ($11.49)
- Limited float — Small-cap (~$263M market cap) with thin trading volume
The stock has rallied 68% from its 52-week low of $7.63, driven by sustained margin improvement and improved profitability metrics.
What Changed From Last Quarter?
Sequential trends remained positive:
The credit reversal was notable—WNEB recorded a $485K reversal of credit losses vs. a $1.3M provision last quarter. Management cited strong portfolio performance and declining unfunded commitments (-10.6% QoQ).
Balance Sheet Highlights
Loan Growth Continues: Total loans reached $2.2 billion, up 5.5% YoY:
- Residential real estate (incl. home equity): +$81M (+10.5%)
- Commercial real estate: +$23M (+2.2%)
- C&I loans: +$10M (+4.8%)
Deposit Franchise Strengthening: Total deposits of $2.4 billion, up 4.3% YoY:
- Core deposits: $1.7B (+7.2% YoY)
- Time deposits: $690M (-1.9% YoY)
- Uninsured deposits: 29.5% of total (covered by 161% available liquidity)
Capital Position Solid:
- Book value per share: $12.16 (+7.6% YoY)
- Tangible book value: $11.49 (+8.1% YoY)
- CET1 ratio: 12.21% (well above 6.5% minimum)
- Tier 1 leverage: 9.13%
Credit Quality Remains Pristine
Asset quality metrics were excellent:
Management noted continued vigilance on commercial real estate: "Management continues to closely monitor the loan portfolio for any signs of deterioration...particularly as the market continues to adjust to higher vacancies and interest rates."
CRE non-owner occupied represented 325% of total risk-based capital, with a weighted average LTV of 54.9%. Office exposure totaled $195M (70.5% of RBC), though 60.5% is in medical office properties.
Capital Return to Shareholders
Dividend:
- $0.07 quarterly dividend maintained
- Payable February 25, 2026 to shareholders of record February 11, 2026
Share Repurchases:
- 599,853 shares repurchased in FY 2025 at $9.73 average
- 872,465 shares remaining under 2025 authorization
- Q4 2025: 100,000 shares at $11.80 average
Hagan emphasized the capital return strategy: "We are committed to delivering long-term value to shareholders through capital management strategies, which include continued loan growth, share repurchases and quarterly cash dividends."
Full Year 2025 Summary
What to Watch Going Forward
Positives:
- NIM expansion momentum continues with favorable deposit repricing
- Credit quality exceptionally strong with coverage ratios increasing
- Efficiency improvements driving operating leverage
- Active buyback at prices below current levels
Risks:
- Office CRE concentration (70.5% of RBC), though mitigated by medical office focus
- Limited growth vectors in mature Massachusetts/Connecticut markets
- Small-cap liquidity limits institutional interest
- Sensitivity to rate cuts if Fed eases more than expected