WSFS FINANCIAL (WSFS)·Q4 2025 Earnings Summary
WSFS Delivers 29% EPS Growth as Wealth & Trust Hits Record
January 27, 2026 · by Fintool AI Agent
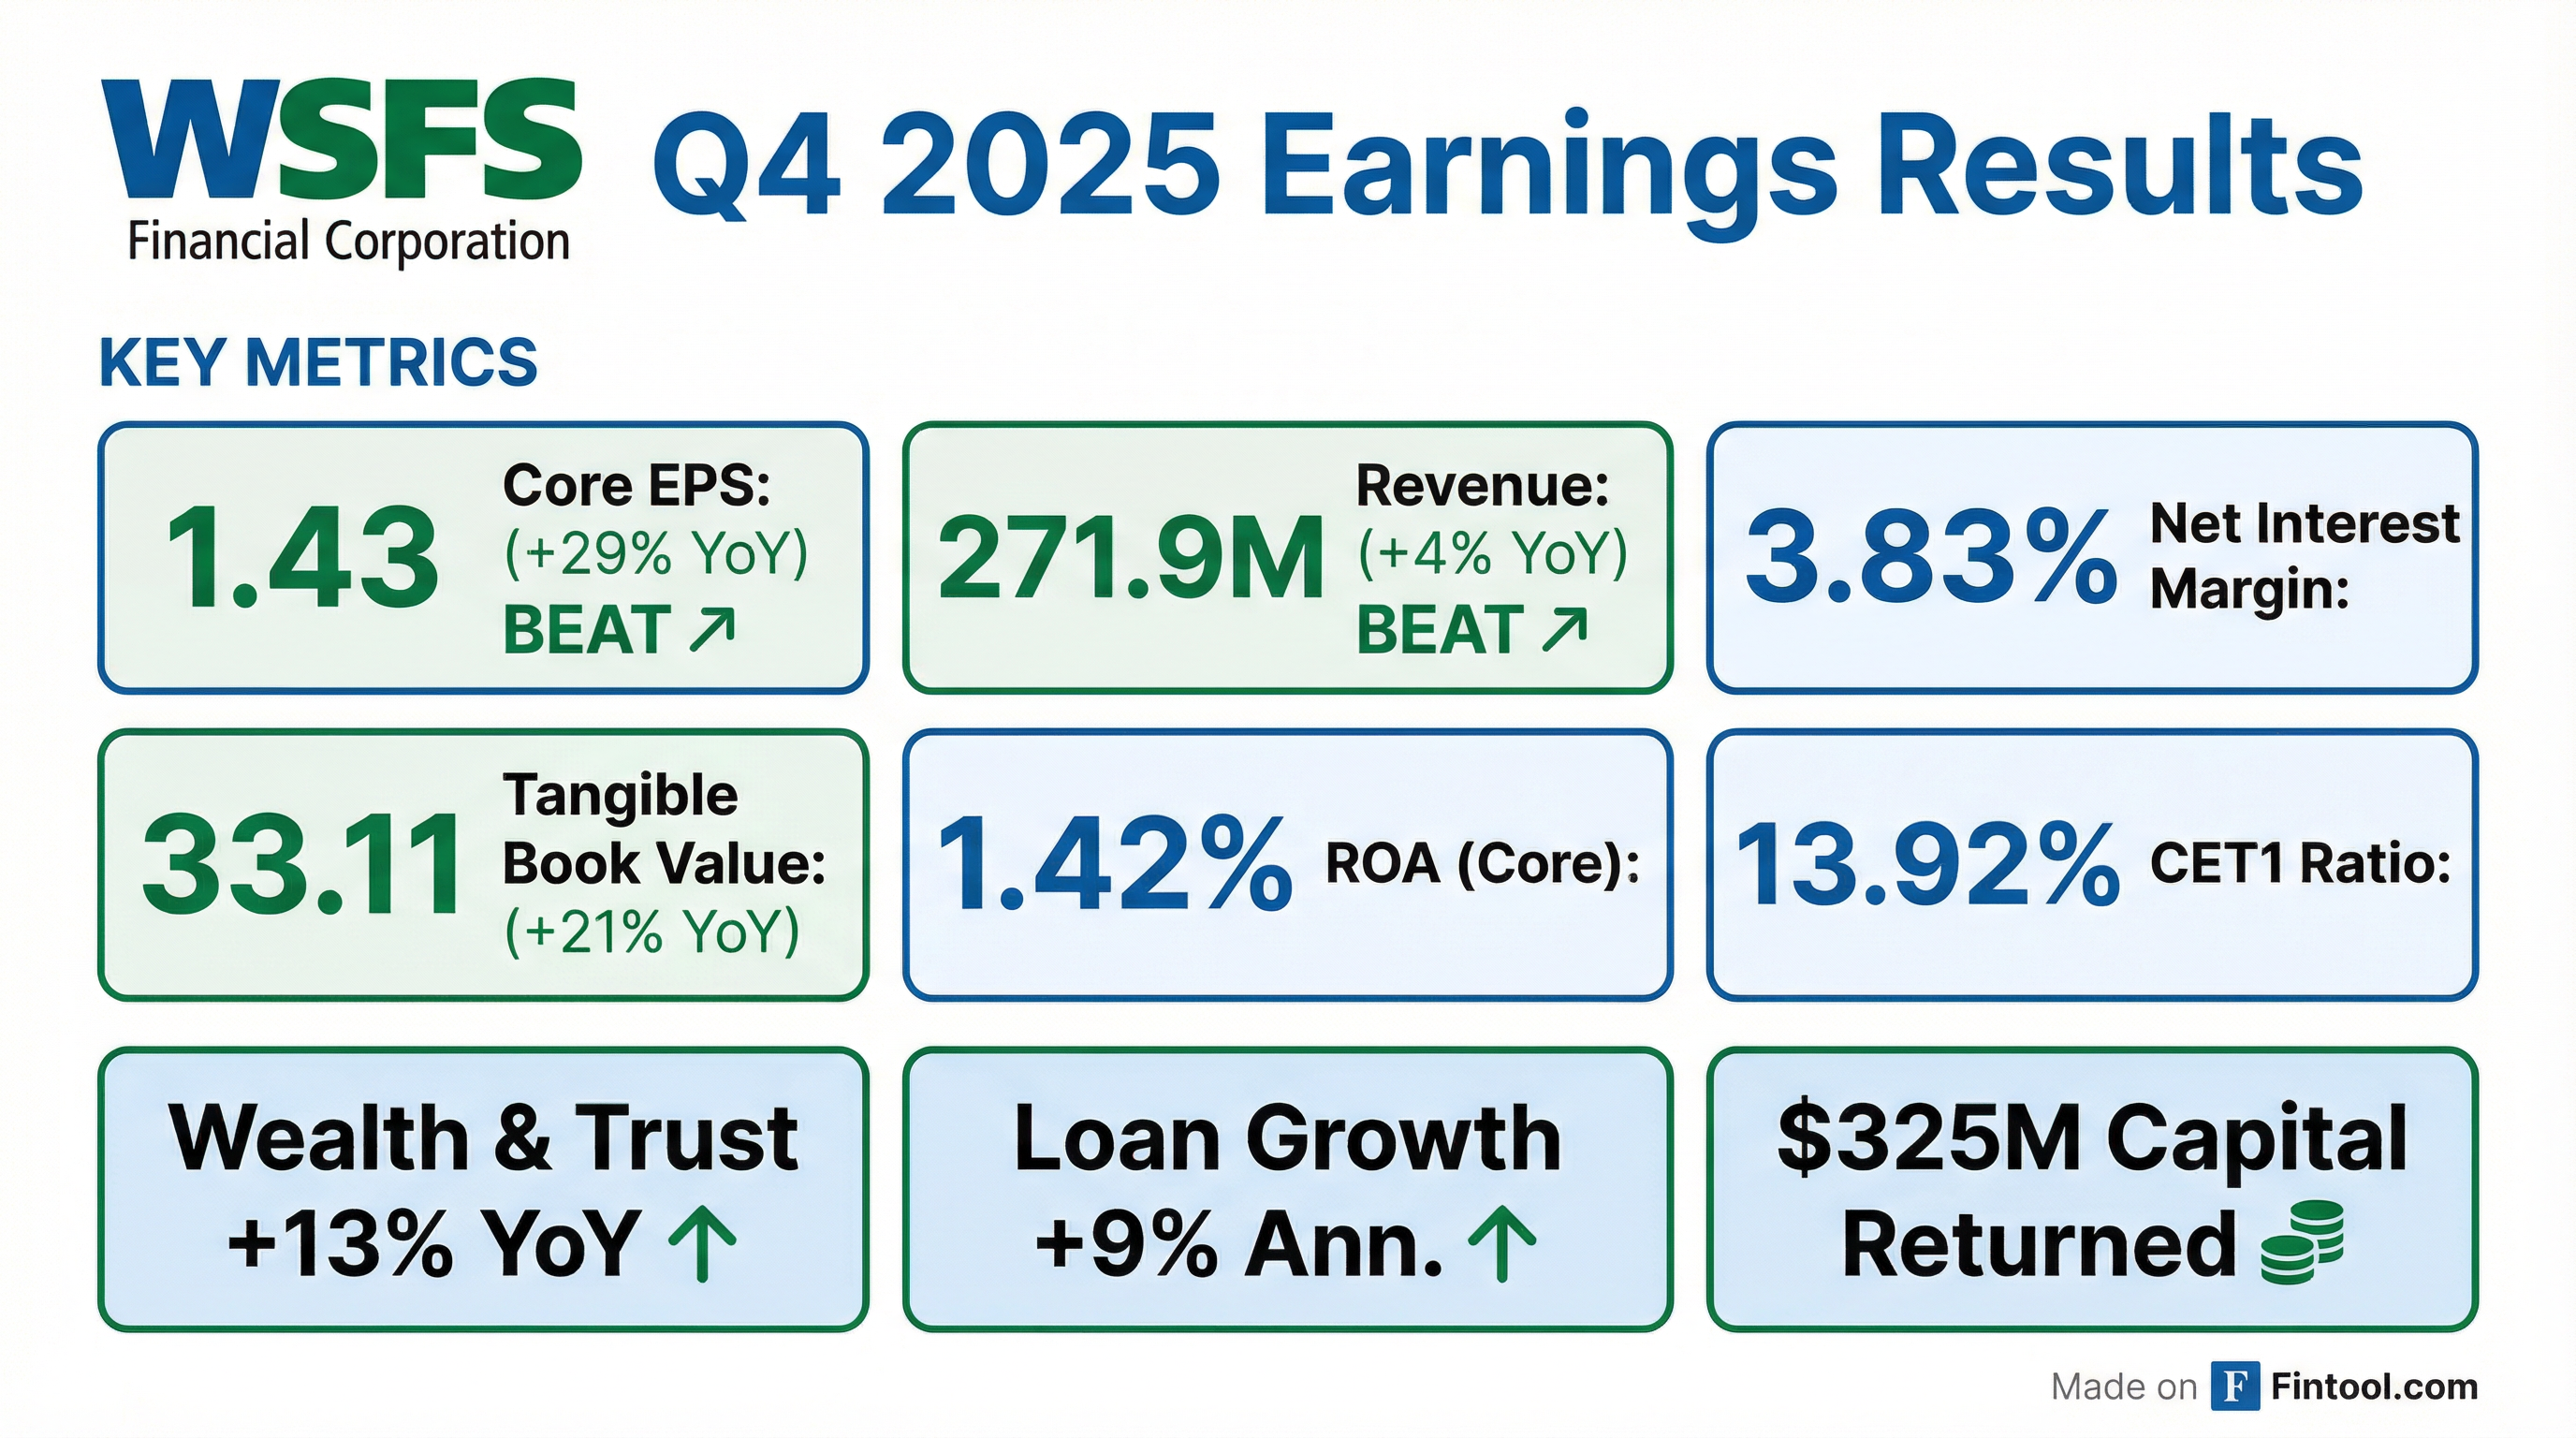
WSFS Financial Corporation (NASDAQ: WSFS) reported Q4 2025 results that significantly exceeded expectations, with core EPS of $1.43 representing a 29% year-over-year increase and a 14% beat versus consensus. The largest locally-headquartered bank in the Delaware-Greater Philadelphia region delivered its ninth consecutive earnings beat, driven by double-digit growth in Wealth & Trust (13% YoY) and the highest commercial loan fundings in over two years.
Management guided to another year of double-digit core EPS growth in 2026, supported by mid-single-digit loan and deposit growth, NIM of approximately 3.80%, and continued aggressive share repurchases. The stock surged 4.8% following the earnings call as investors responded to the strong execution and bullish outlook.
Did WSFS Beat Earnings?
Yes — WSFS beat on both EPS and revenue:
Beat/miss history (Core EPS):
WSFS has beaten EPS estimates for nine consecutive quarters, demonstrating consistent execution.
KRX Peer Percentile Rankings (3Q25 YTD):
What Did Management Guide?
WSFS provided 2026 guidance pointing to continued momentum:
Rate assumptions: Guidance includes three 25bp rate cuts (March, July, December 2026). December exit deposit beta was 43% (interest-only) with exit client deposit cost of 1.39%.
Note: Management confirmed the double-digit EPS growth outlook is on a core basis (core vs. core year-over-year).
Key drivers of double-digit EPS growth:
- Continued share repurchases (7% of shares remain in authorization)
- Double-digit growth in Wealth & Trust
- Disciplined expense management
What Changed From Last Quarter?
Improved:
- Net interest income: +$3.3M QoQ (+2%) on lower deposit costs and loan growth
- Noninterest deposits: +6% QoQ — now 33% of total deposits
- Problem assets: Down 83bps QoQ to lowest level in 2+ years
- Commercial loan fundings: Highest quarterly total in 2+ years
- C&I loans: +4% QoQ as commercial line utilization rose to 36.6%; 90-day weighted pipeline ~$200M
Declined:
- NIM: Down 8bps QoQ to 3.83% due to lower loan yields (rate cuts impact); loan yields down 24bps QoQ
- Delinquencies: +46bps QoQ to 1.27% (three well-secured CRE loans)
- Cash Connect units: Down 2% QoQ as ATM volumes normalize
What Did Management Say on the Call?
Commercial Loan Growth Drivers
CFO David Burg attributed the strong commercial loan momentum to improving business sentiment:
"In the first half of last year, there was quite a bit of uncertainty in the economy, with the tax bill pending, some of the tariffs and legislative issues that were ongoing... Small business owners and entrepreneurs were delaying some business decisions. What happened over the course of the year was we continued those discussions with clients. We saw that pipeline really build in the third quarter... and in the fourth quarter, when some of those things crystallized, people felt better about making some of those decisions with the passage of the tax bill."
The commercial pipeline reached over $300 million in Q3 2025, leading to the highest quarterly fundings in over two years.
Capital Return Philosophy
Management outlined a clear framework for capital allocation:
- CET1 and TCE are the primary metrics, incorporating AOCI volatility
- Targeting roughly 100% of net income returned annually
- 85% through buybacks, ~15% through dividends
- Multi-year glide path to 12% CET1 target (currently 13.92%)
- "We will toggle that up and down, depending on what we see. If there are investment opportunities, we want to take advantage of those."
Cash Connect Revenue Sensitivity
Burg provided specific guidance on rate sensitivity: ~$2.5 million annual revenue impact per 25bp rate cut, but this is more than offset in expenses.
Key margin drivers beyond rates:
- Pricing leverage — using scale to increase pricing across products
- Expense optimization — optimizing in-transit cash and management expenses
- Smart safe mix shift — smart safes grew from 25% to 33% of units YoY, carrying higher margins
Strategic "Relook" Initiative
Management discussed an ongoing initiative to evaluate business fit:
"We have an initiative here we call it Relook, where we continue to look at different parts of our business and think about the fit and the strategic fit of that going forward."
CEO Rodger Levenson added context:
"When you go through a period of rapid growth like we did four or five years ago... as you settle into your scale and you see where you're getting that higher growth, you're looking to free up capital and resources to continue to invest in those areas."
M&A Positioning
On bank M&A, Levenson stated:
"We've been clear over the last year or so that if something came along that would strengthen our position, our very strong position, in the greater Philly, Delaware region, we would absolutely consider that... But we also feel good about the organic growth."
Credit Quality Updates
Two delinquent office loans have clear resolution paths:
- One already resolved in January 2026
- One medical office expected to sell in H1 2026 — would result in full loan repayment
CRE portfolios carry high recourse protection:
- Office portfolio: 80% recourse
- Multifamily portfolio: 86% recourse
Hedging Program
Currently $1.3 billion of hedges in the money, increasing to $1.5 billion with another rate cut. This is a key tool for mitigating rate sensitivity.
Securities Portfolio Strategy
Management plans to keep the portfolio flat at ~21% of assets:
- Current yield: 2.35-2.40%
- Reinvestment yield: 4.30-4.40%
- ~200bp uplift as securities roll over
Non-Interest Bearing Deposit Mix
NIB deposits (33% of total) are broadly diversified:
- 40% Consumer
- 35% Trust & Private Banking
- 25% Commercial
Q4 growth was led by trust and private banking, but "every business is contributing meaningfully."
How Is the Business Performing?
Wealth & Trust — The Growth Engine
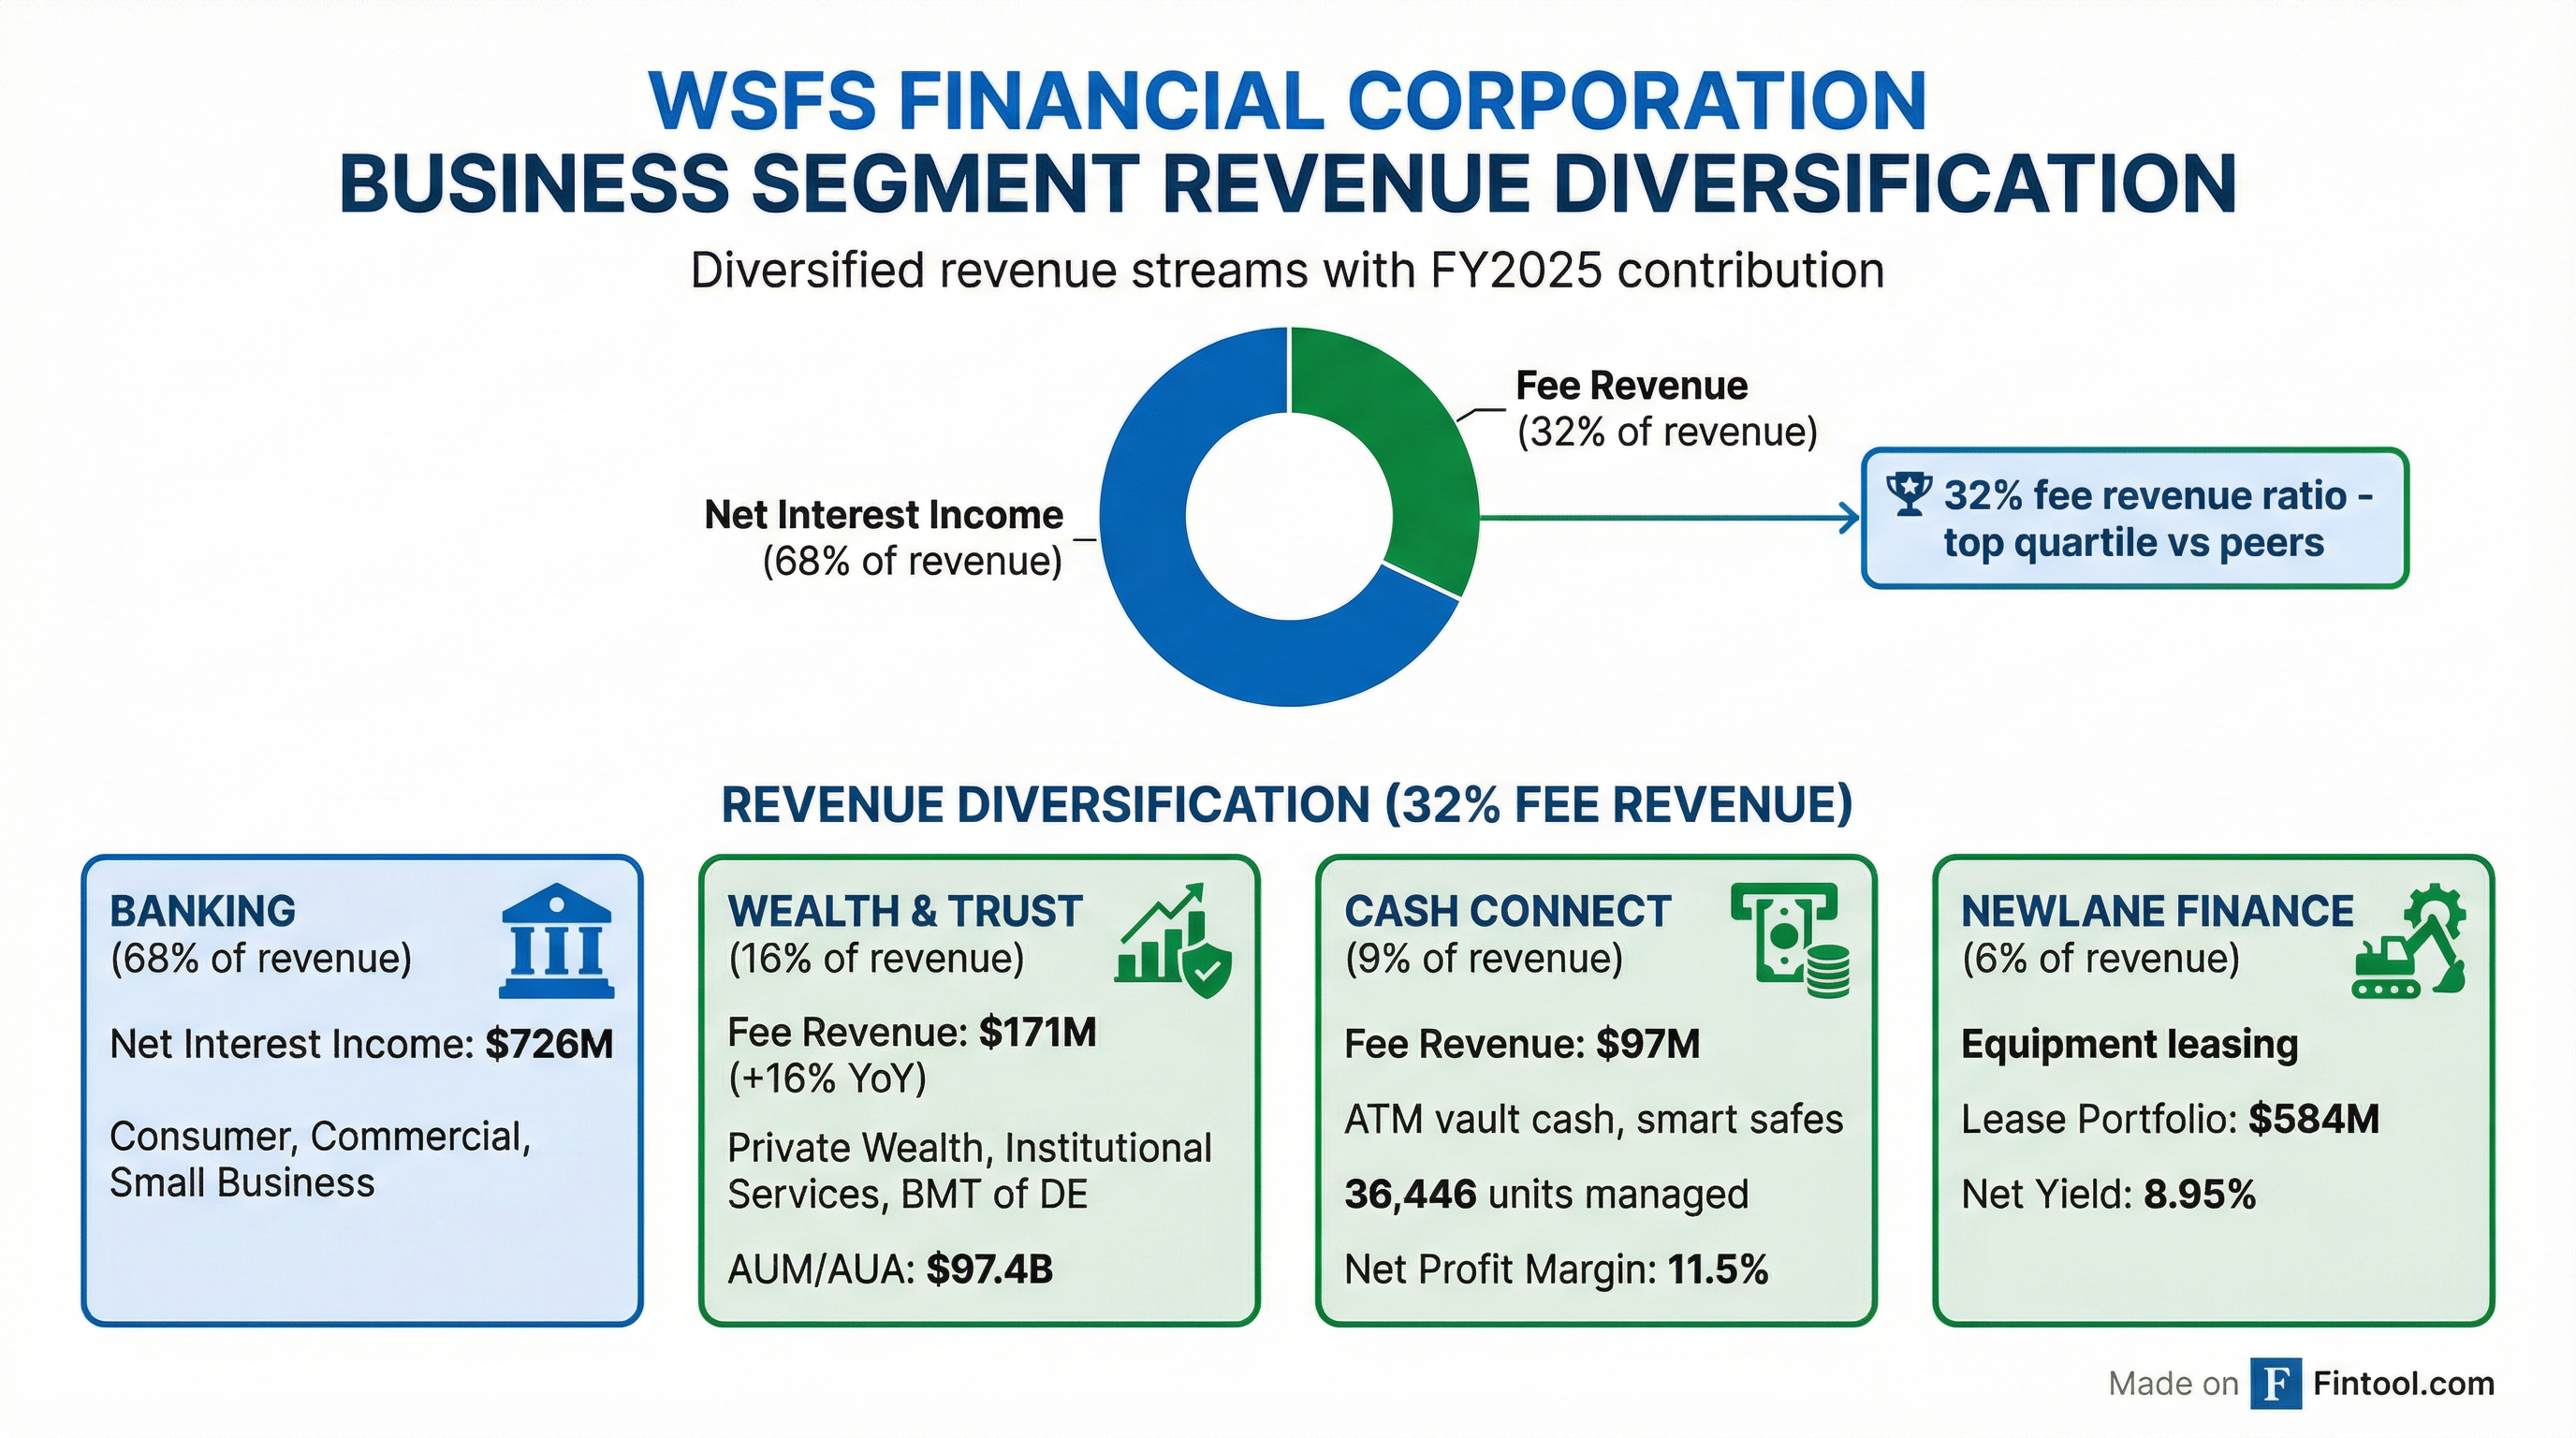
+13% YoY fee revenue growth, contributing 25% of total FY2025 revenue
AUM/AUA reached $97.4 billion — up 4% QoQ and 9% YoY, driven by client growth and market appreciation.
WSFS Institutional Services ranked as the 4th most active U.S. ABS & MBS trustee in 2025 with 11.7% market share, behind only U.S. Bank, Citi, and Wilmington Trust.
Cash Connect — Margin Inflection
Net profit margin expanded to 11.5% (up from 1.0% in 2024) as pricing initiatives and expense optimization took hold.
Smart safe units grew +20% YoY, now representing 33% of total units managed vs 25% a year ago.
NewLane Finance — Small Ticket Equipment Leasing
NewLane Finance provides high-yield equipment financing with a granular portfolio:
Investment Portfolio — Liquidity Backstop
The high-quality investment portfolio provides borrowing capacity and predictable cash flows:
AOCI improved $29.1M (6%) QoQ as rates stabilized. The forecasted cash flows could fund ~3.5% annualized loan growth.
How Did the Stock React?
WSFS shares surged 4.8% to $60.67 following the Q4 2025 earnings call, marking the stock's highest close since early 2024. The move reflects:
- Strong beat (+14% EPS vs consensus) with 9th consecutive quarterly beat
- Bullish 2026 guidance for double-digit EPS growth
- Commercial loan momentum — highest quarterly fundings in 2+ years
- Wealth & Trust growth engine (+13% YoY) continuing to deliver
Valuation context:
- Stock price: $60.67 (+4.8% on Jan 27)
- Tangible book value: $33.11 (+21% YoY)
- P/TBV: 1.83x
- Market cap: ~$3.32B
- 52-week range: $42.44 - $61.65
What About Credit Quality?
Credit metrics showed mixed trends but remain manageable:
Key takeaways:
- Problem assets at lowest level in 2+ years — down to $536M from $630M QoQ
- Delinquency increase is temporary — 3 well-secured CRE loans and previously identified problem assets
- NCO spike ($15.2M) driven by partial charge-off of one nonperforming land development loan
- CRE office exposure: 5.0% of gross loans with 10.6% problem loan rate
Capital Return Highlights
WSFS returned 110% of FY2025 net income to shareholders:
- 9.3% of outstanding shares repurchased in FY2025
- 7% of shares remain authorized for future buybacks
- Quarterly dividend increased to $0.17/share
- CET1 of 13.92% — well above 6.5% "well-capitalized" threshold
CET1 trajectory: The bank is managing toward a medium-term target of ~12%, implying continued aggressive capital return.
Key Quotes From Management
"Our businesses continued to perform very well in the quarter, providing strong momentum moving into 2026. For the fourth quarter, WSFS delivered a core earnings per share of $1.43, a core ROA of 1.42%, and core return on tangible common equity of 18%, which are all up meaningfully on a year-over-year basis."
— David Burg, CFO, on Q4 results
"We're excited about the future and remain committed to delivering high performance."
— David Burg, closing the prepared remarks
"The other component, which you'll hear us continue to talk about more, is getting more out of our client relationships, particularly C&I, but across the platform by referrals throughout our franchise, especially on the wealth side. I think we've done a good job on that front, but we also feel like we're just getting started."
— Rodger Levenson, on cross-sell opportunity
Forward Catalysts
Near-term (1-2 quarters):
- Q1'26 guidance validation as rate cut trajectory becomes clearer
- Continued share repurchase execution (~7% of shares remaining in authorization)
- Resolution of delinquent medical office loan (expected H1 2026)
Medium-term:
- Wealth & Trust expansion — management sees "huge opportunity" in cross-referrals
- Cash Connect smart safe mix shift (now 33% of units vs 25% a year ago)
- Commercial pipeline momentum following strongest fundings in 2+ years
- Securities portfolio reinvestment at ~200bp higher yields
Risks to monitor:
- CRE office exposure (5% of loans) though 80% recourse mitigates risk
- NIM compression if rate cuts exceed 3 cuts assumed in guidance
- Deposit beta management — targeting low-to-mid 40s throughout 2026