ZIFF DAVIS (ZD)·Q4 2025 Earnings Summary
Ziff Davis Misses Q4 Across the Board as Tech & Shopping Segment Sinks 18%
February 24, 2026 · by Fintool AI Agent
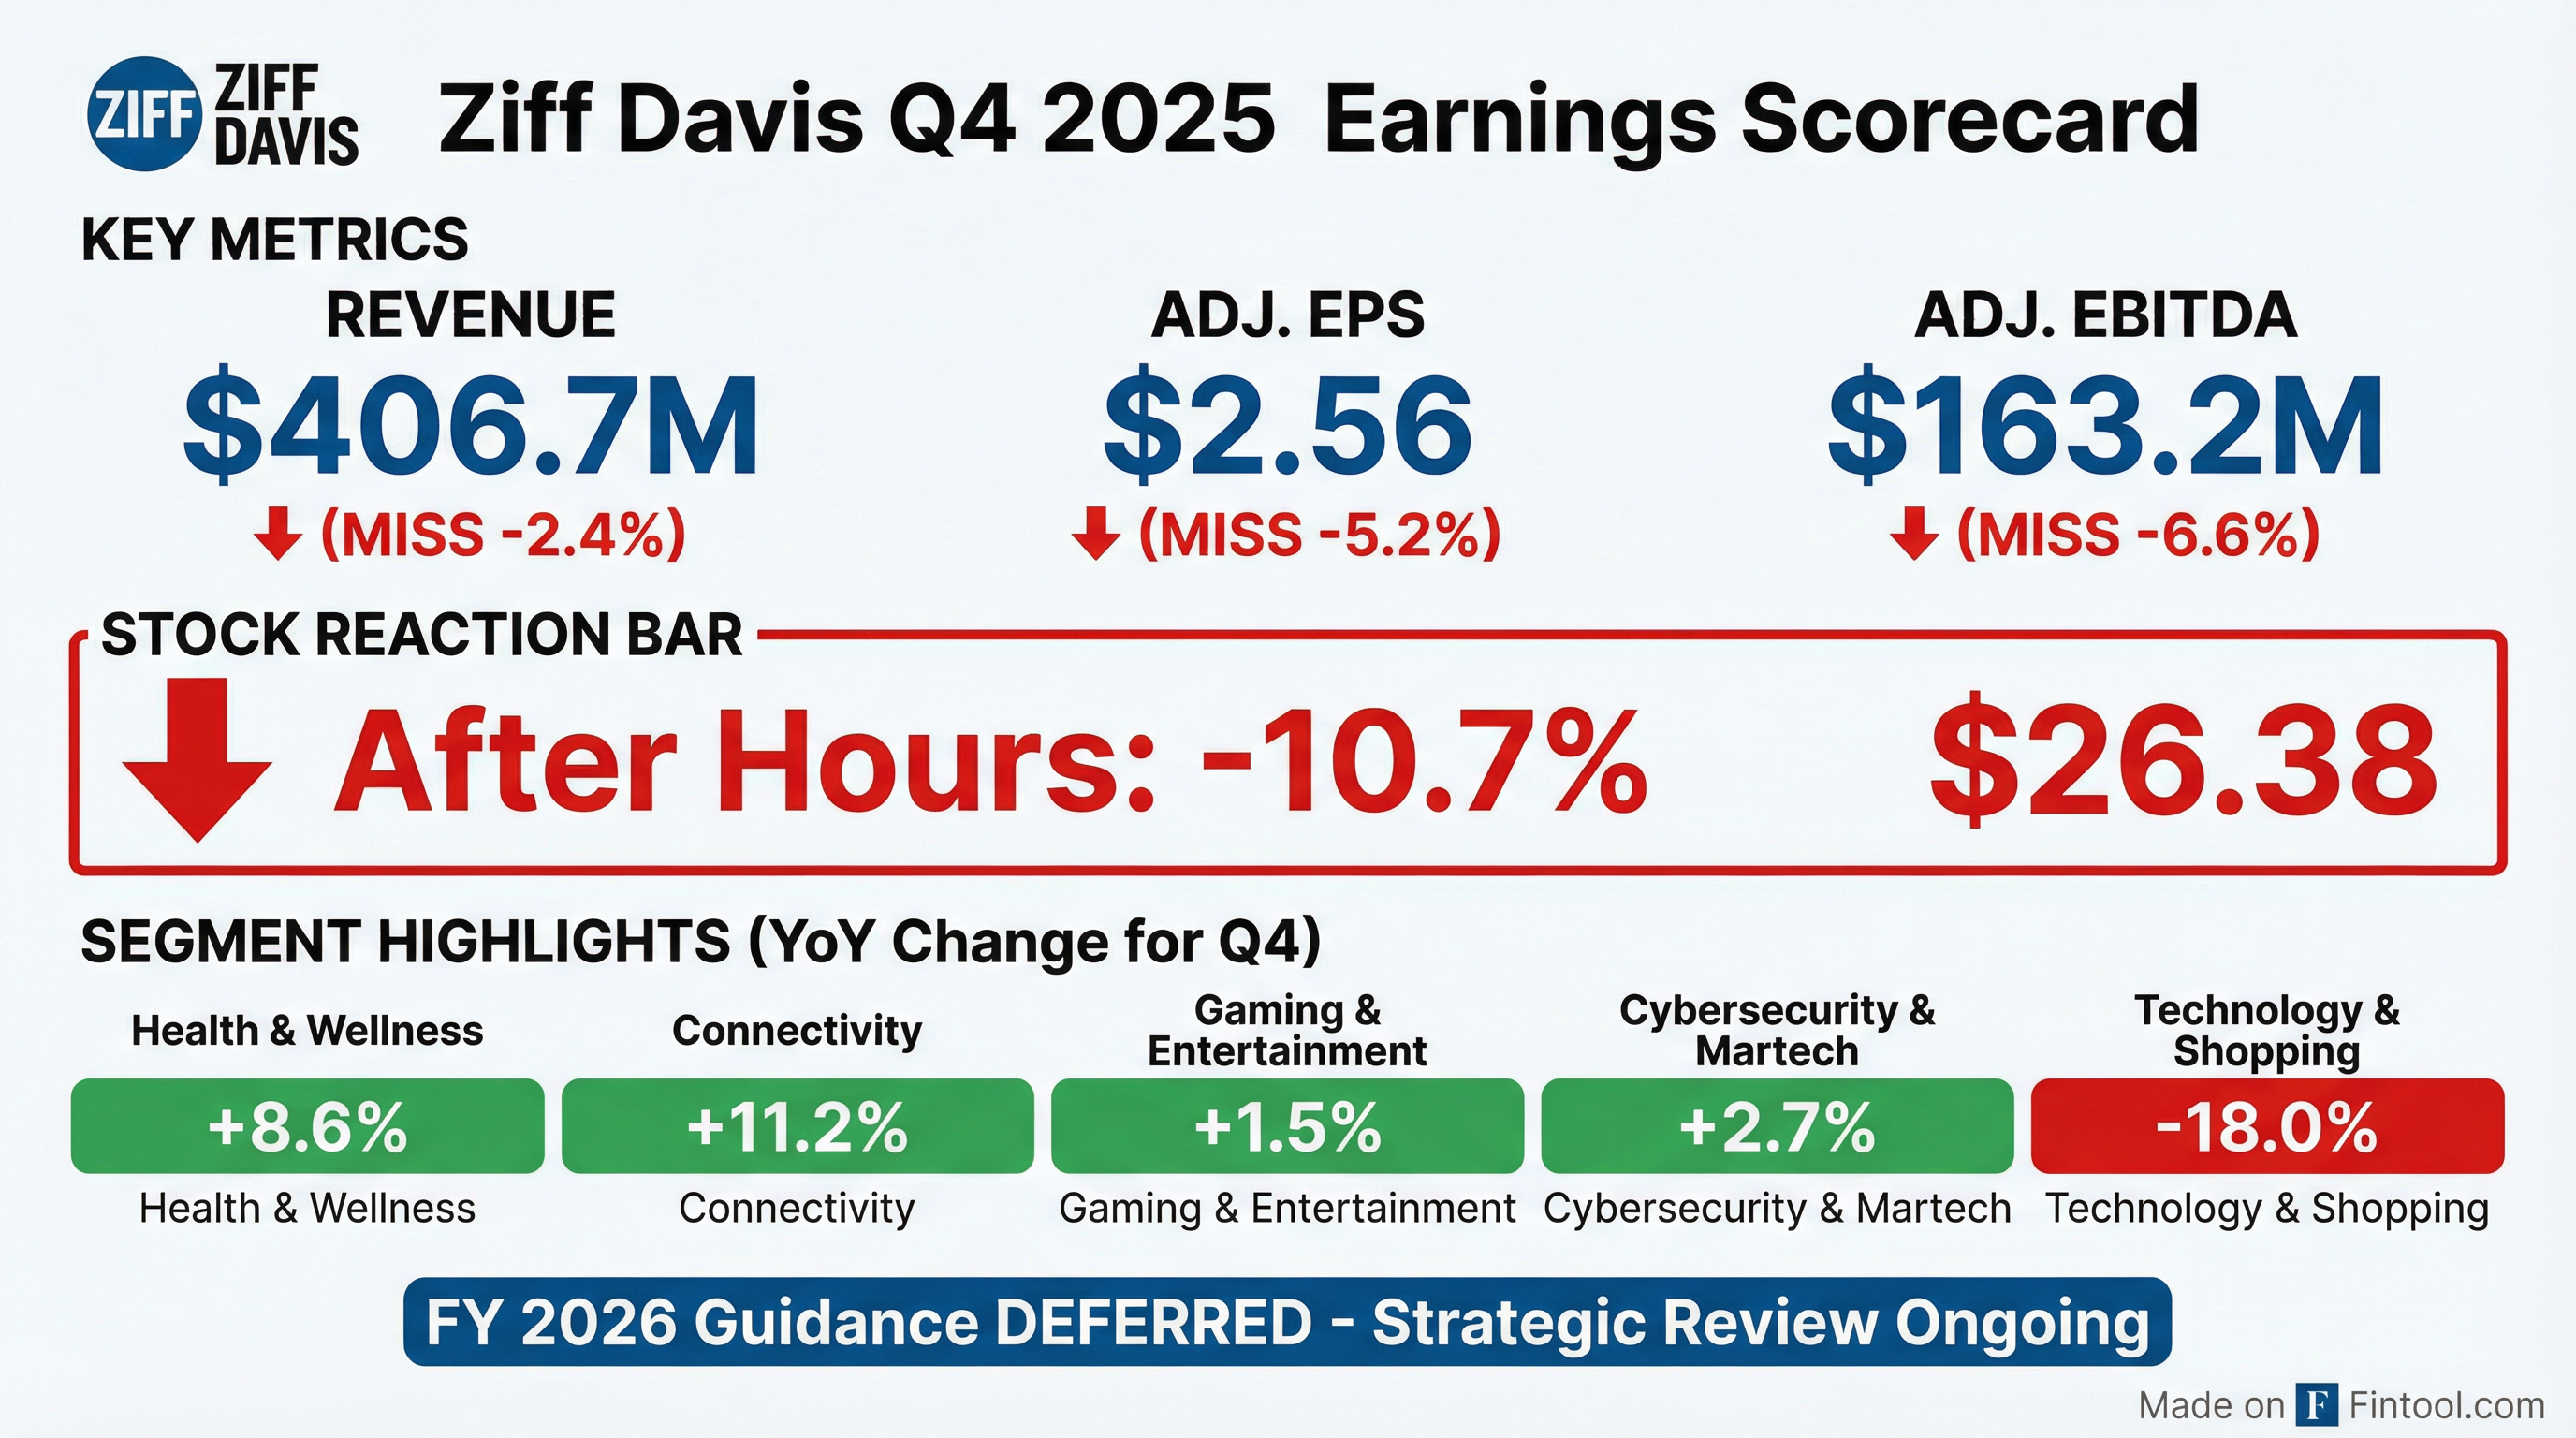
Ziff Davis (NASDAQ: ZD) reported Q4 2025 results that disappointed on every key metric, missing revenue, Adjusted EPS, and Adjusted EBITDA estimates. The stock plunged over 10% in after-hours trading as management declined to provide fiscal 2026 guidance, citing an ongoing strategic review that could result in the sale of entire business divisions.
Did Ziff Davis Beat Earnings?
No. Ziff Davis missed consensus estimates across all key metrics in Q4 2025:
*Values retrieved from S&P Global
The revenue miss was driven primarily by the Technology & Shopping segment, which saw an 18% year-over-year decline to $108.9M from $132.9M in Q4 2024.
Historical Beat/Miss Pattern
Ziff Davis has struggled with consistency over the past 8 quarters:
*Values retrieved from S&P Global
How Did the Stock React?
ZD shares tumbled following the earnings release:
- Regular Session: -5.7% to $29.55
- After-Hours: -10.7% to $26.38
The stock has been under significant pressure, trading near 52-week lows of $28.55 and well below its 52-week high of $49.59.
The sharp after-hours drop reflects investor frustration with the triple miss combined with management's refusal to provide forward guidance.
What Did Management Say?
CEO Vivek Shah emphasized capital returns and intrinsic value in his prepared remarks:
"In 2025, Ziff Davis grew Revenues, Adjusted EBITDA, and Adjusted diluted EPS, while generating almost $290 million in Free cash flow. We deployed $174 million in share repurchases during the year with the conviction that our share price does not adequately reflect the intrinsic value of our businesses."
AI Content Licensing Strategy
Management provided significant color on their approach to AI content licensing negotiations:
"We are actively engaged in discussions with key players. The nature of these dialogues reinforces our confidence in the future revenue opportunities for content licensing. However, we are taking a deliberate, principled approach to execution."
Critically, CEO Shah drew a clear line on licensing terms:
"Both use cases require proper licensing. We will not enter into RAG-focused agreements that compromise our rights to fair compensation for foundational training. These are separate use cases with distinct value propositions, and our authoritative content must be valued accordingly in both contexts."
The company anticipates "greater clarity on these fundamental licensing questions following the resolution of our ongoing litigation," which could unlock deals that have been in limbo.
What Did Management Guide?
No guidance provided. In an unusual move, Ziff Davis deferred fiscal 2026 guidance entirely:
"As noted in the Company's Third Quarter 2025 earnings release, Ziff Davis has engaged outside advisors to assist in evaluating value-creating opportunities, including the potential sale of entire divisions of the Company. As this process is ongoing, the Company is deferring its fiscal 2026 guidance."
Q1 2026 Directional Outlook
While formal guidance was deferred, CFO Bret Richter provided Q1 2026 color:
The margin compression is attributed to Tech & Shopping revenue decline flow-through, lower-margin Health & Wellness revenue mix, and continued Connectivity growth investment.
2026 Segment-Level Outlook
CEO Shah provided high-level segment expectations for FY 2026:
Management expects company-wide Adjusted EBITDA margins to "continue to hover around 34%."
What Changed From Last Quarter?
Segment Performance: Winners and Losers
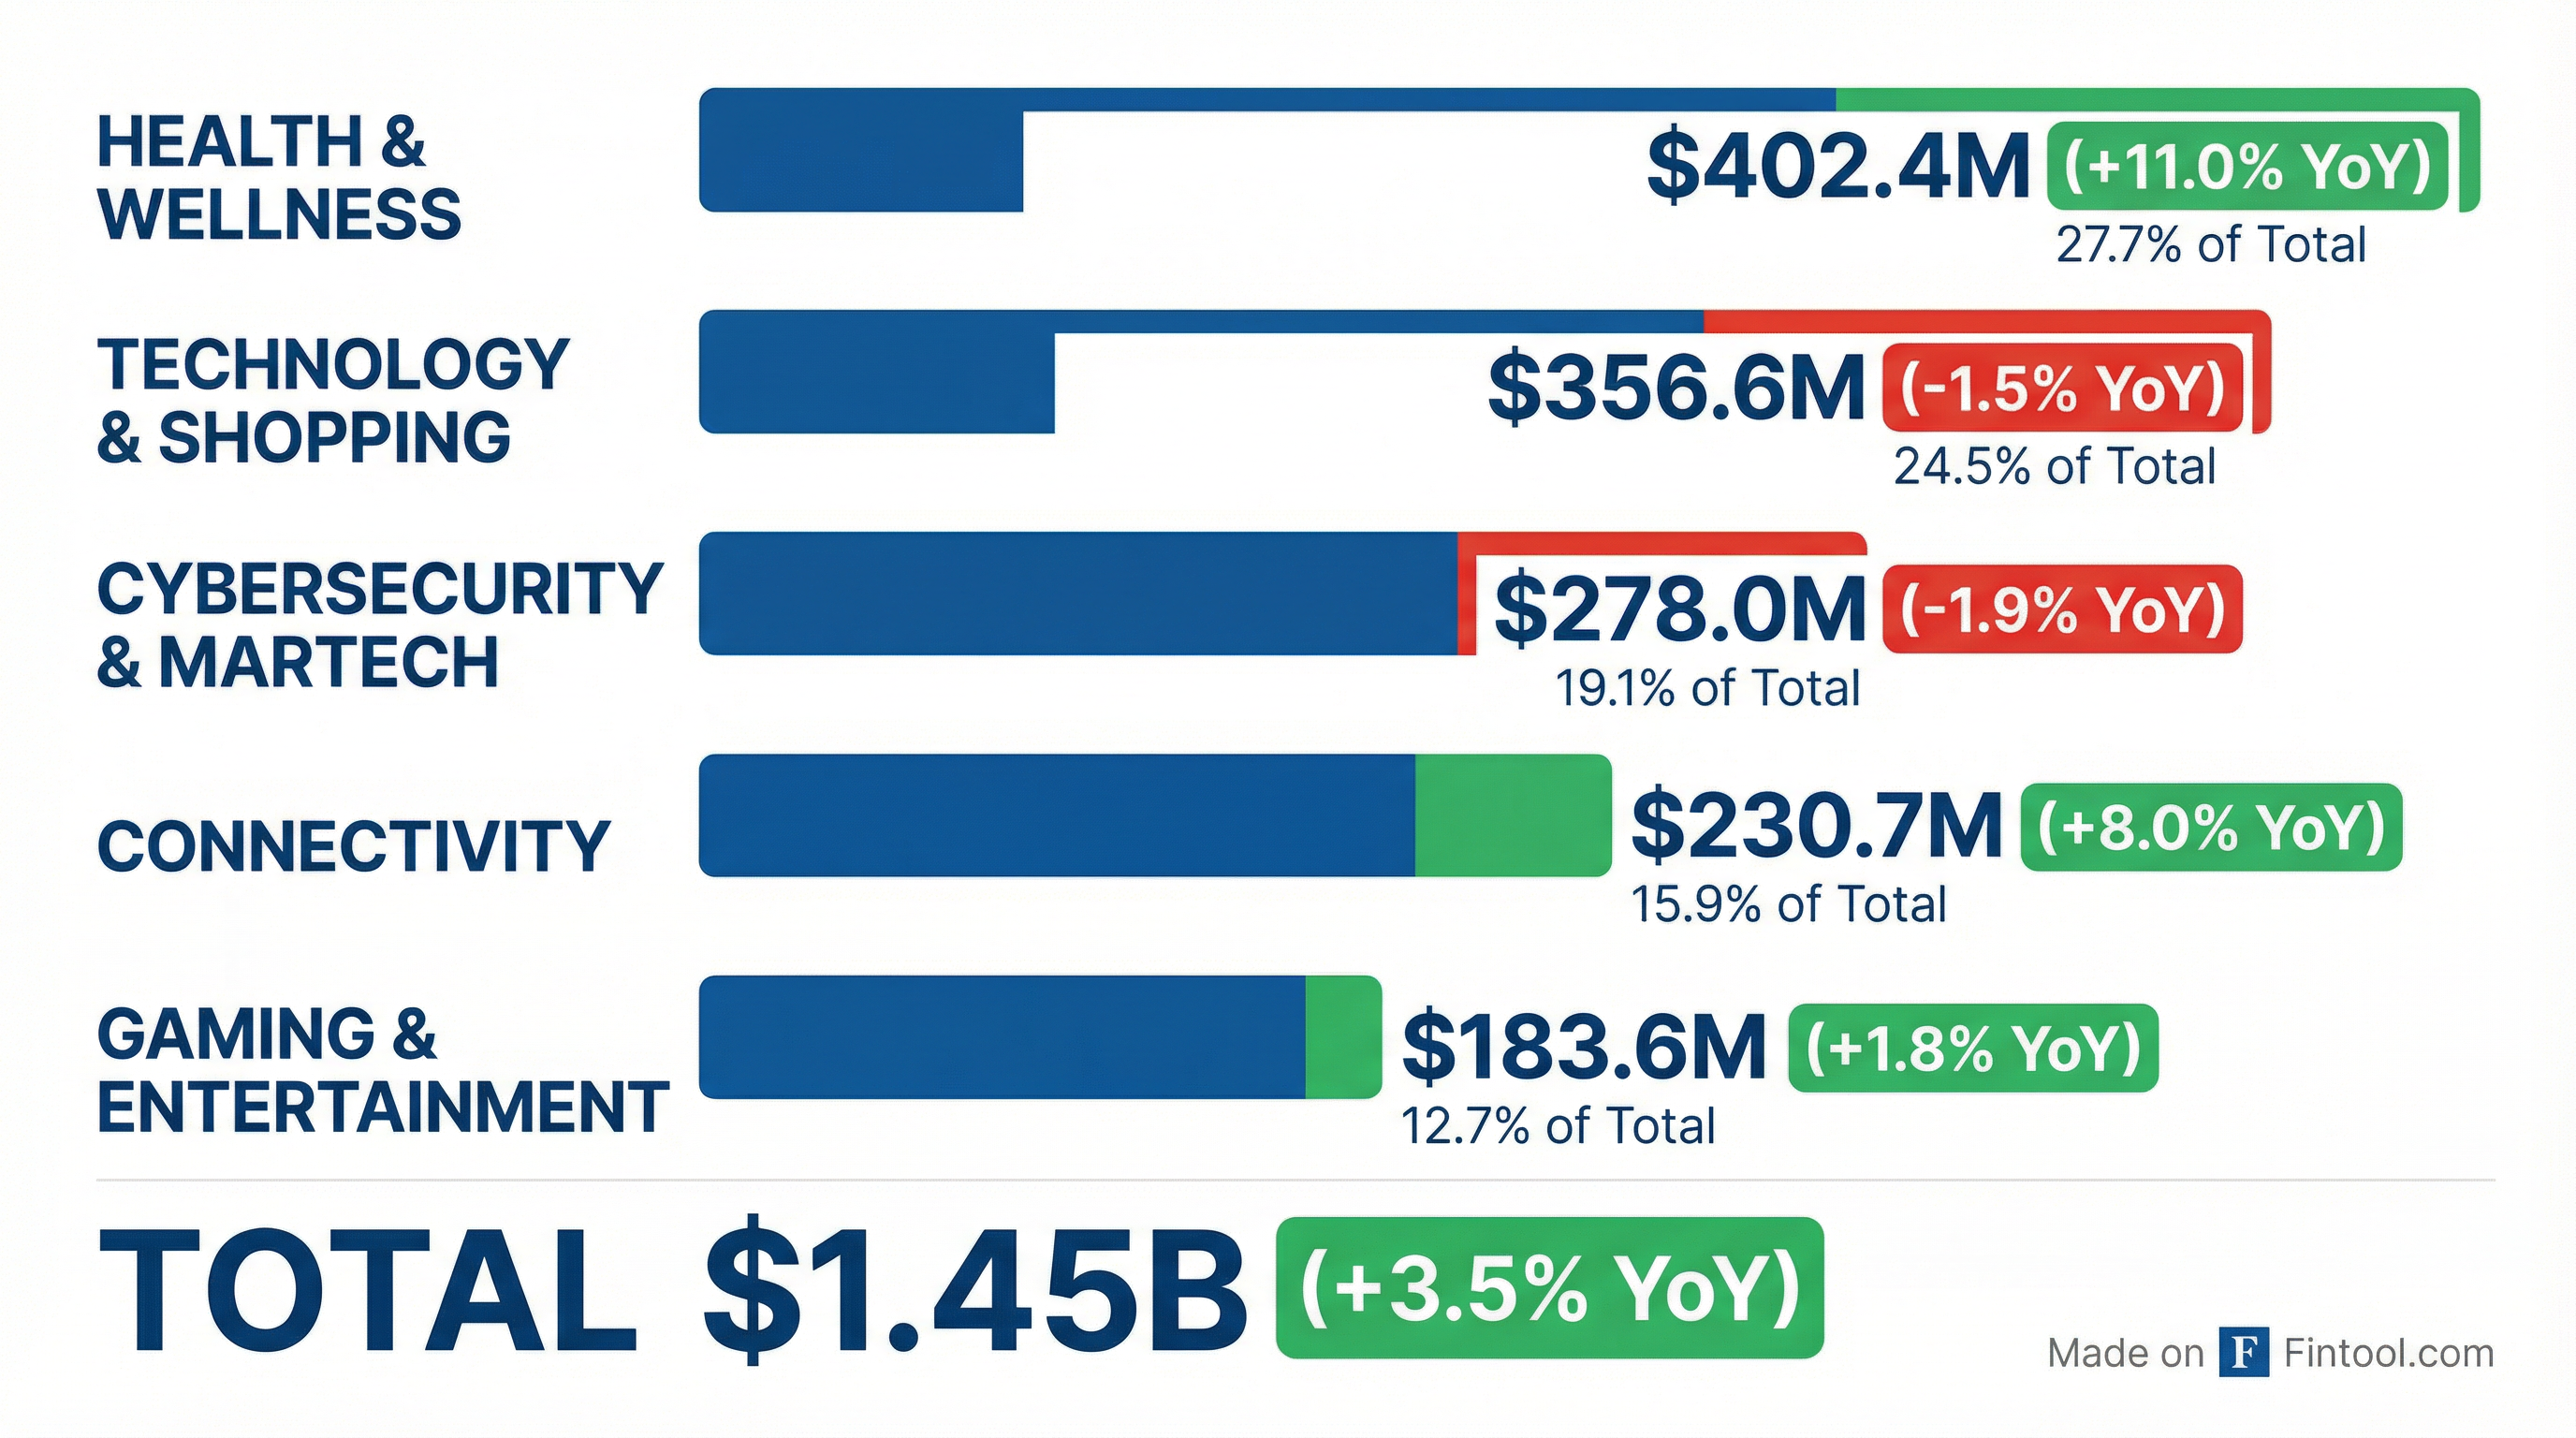
Q4 2025 Segment Revenue (YoY Change):
The Technology & Shopping segment continues to be the problem child, with revenue falling 18% YoY in Q4 and 1.5% for the full year. This segment includes brands like PCMag, Mashable, and Offers.com. Customer count fell from 793 to 753 YoY, while quarterly revenue per customer dropped from $163,947 to $144,070.
CEO Shah quantified the affiliate commerce damage on the call: "We did, in 2025, roughly $90 million in affiliate commerce commissions related to organic traffic. That was down about $25 million year-over-year, and half of that $25 million was in Q4." This means affiliate commerce represents roughly 25% of Tech & Shopping's annual revenue and is highly concentrated in search-driven traffic.
Additionally, the B2B business within Tech & Shopping is being intentionally contracted—revenues were down $11M YoY, but EBITDA improved by nearly $6M as management cut costs faster than revenue declined.
Health & Wellness remains the growth engine, up 11% for FY 2025 to $402.4M, driven by strong advertising and performance marketing revenue growth.
Connectivity (which includes Ookla/Speedtest) delivered consistent subscription growth with quarterly revenue per customer rising from $1,915 to $2,098 YoY. The segment launched two new products in Q4: Speedtest Pulse, a handheld diagnostic device for field technicians, and Speedtest Certified, a network verification program for commercial venues. Both are expected to contribute meaningful growth in 2026.
Gaming & Entertainment highlights included Humble Bundle's best storefront quarter in five years and its 15-year anniversary milestone ($275M raised for charity to date). IGN's social engagement grew strongly with Facebook views up 22% to 300M and X views up 19% to 45M. The IGN Store saw total sales triple in Q4.
CNET Group (within Tech & Shopping) showed encouraging all-platform diversification: video and social views grew 100% in Q4 and 80% for FY 2025 to 1 billion views—a potential offset to declining search traffic.
Organic Growth Remains Negative
The company reported -3% organic revenue decline in Q4 2025 and -1% for FY 2025, excluding brands in managed decline. Including those brands, organic growth would have been -5% for Q4 and -3% for FY 2025.
Key Operating Metrics
Advertising & Performance Marketing (by segment)
Health & Wellness is the only segment showing net revenue expansion from existing customers, a positive signal for that business.
Subscription & Licensing
Gaming subscriptions continue to decline (-12.7% YoY) but ARPU is improving (+15%), suggesting a shift toward higher-value customers.
Capital Allocation & Balance Sheet
Ziff Davis maintains a strong balance sheet and continues aggressive capital return:
FY 2025 Capital Deployment:
- Share Repurchases: $173.8M
- Acquisitions: $68.7M
- Free Cash Flow Generated: $287.9M
The company has minimal leverage (0.5x net debt/EBITDA) and generated nearly $290M in free cash flow, giving it significant flexibility to fund buybacks, acquisitions, or debt reduction.
Full Year 2025 Summary
Despite Q4 weakness, FY 2025 showed modest growth:
Growth was driven by Health & Wellness (+11%) and Connectivity (+8%), offset by declines in Technology & Shopping (-1.5%) and Cybersecurity & Martech (-1.9%).
Risks & Concerns
-
Strategic Uncertainty: The ongoing strategic review creates significant uncertainty. Investors don't know which segments might be sold, at what valuation, or how proceeds would be deployed.
-
Technology & Shopping Deterioration: The 18% Q4 decline in Tech & Shopping is alarming. Customer losses and declining revenue per customer suggest structural challenges.
-
AI Content Risks: Management highlighted risks from "developers and users of generative artificial intelligence" related to content usage and intellectual property.
-
Organic Revenue Decline: Core organic growth remains negative at -1% for FY 2025, excluding brands in managed decline.
-
No 2026 Visibility: Without guidance, investors are flying blind on near-term expectations.
Q&A Highlights
On Search Traffic Headwinds
CEO Shah explained why Tech & Shopping is uniquely vulnerable compared to other segments:
"A lot of traffic is fungible, meaning that lost search traffic can be and has been made up with other sources of engagement: apps, social traffic, video, programmatic traffic, and email... Where that has become really hard is within Tech and Shopping, 'cause the one type of traffic that really is hard to replace is high-intent consumers who arrive via search, looking for a product or a service, and then clicking through to make a purchase."
Management expects Tech & Shopping pain to peak in H1 2026, with improvement in H2 from favorable comps and new monetization initiatives (video, licensing, app/browser extension traffic).
On Health & Wellness Resilience
Unlike Tech & Shopping, Health & Wellness is not meaningfully exposed to search traffic decline:
"Much of the inventory within that segment is not search-based. We have our partnership, our hospital ad network, the Mayo Clinic and Cleveland Clinic... We do these custom condition centers, which really don't rely on search engine traffic. We have our direct-to-provider business, which is largely email."
On M&A Appetite
Despite challenges, management sees the current environment as an M&A opportunity:
"The market fear in digital media actually presents us with a pretty unique opportunity to be an active buyer in this space. Look, the valuations are compelling... I think both things can be true, that we can be very focused on opportunities within the M&A landscape while we continue in this strategic review process to unlock value for shareholders."
On AI Licensing Optionality as M&A Factor
When asked if AI licensing potential is freezing M&A activity:
"Some folks may be holding out, just given that there could be a potential windfall on the AI licensing front, and so may not be willing to transact right now... that's certainly a question that's out there, that until we really understand what the revenue framework and potential is around licensed content for LLMs, you may have certain owners of content assets skittish about transacting."
Forward Catalysts
- Strategic Review Outcome: The sale of one or more divisions could unlock significant value if priced well
- AI Litigation Resolution: Could unlock content licensing deals that have been on hold
- Q1 2026 Earnings: First look at 2026 execution; watch Tech & Shopping trajectory
- New Product Traction: Speedtest Pulse and Speedtest Certified contribution to Connectivity growth
The Bottom Line
Ziff Davis delivered a disappointing Q4 2025, missing on revenue, EPS, and EBITDA while declining to provide forward guidance. The Technology & Shopping segment's 18% revenue decline is particularly concerning and suggests structural headwinds beyond cyclical factors.
The silver lining: Health & Wellness and Connectivity continue to perform well, the balance sheet is strong (0.5x net leverage), and the company generates substantial free cash flow (~$288M annually). The strategic review could be value-creating if management finds attractive prices for underperforming assets.
At $26 after-hours (implied market cap ~$1.1B), ZD trades at roughly 2.2x FY 2025 Adjusted EBITDA and 3.8x free cash flow—optically cheap, but the lack of guidance and execution challenges warrant caution.
For more on Ziff Davis, explore the company page or read the full earnings transcript.