Earnings summaries and quarterly performance for AFLAC.
Executive leadership at AFLAC.
Daniel Amos
Chief Executive Officer
Audrey Tillman
Senior Executive Vice President and General Counsel
Bradley Dyslin
Executive Vice President and Global Chief Investment Officer; President, Aflac Global Investments
Max Brodén
Senior Executive Vice President and Chief Financial Officer
Virgil Miller
President, Aflac Incorporated; President, Aflac U.S.
Board of directors at AFLAC.
Arthur Collins
Director
Georgette Kiser
Director
Joseph Moskowitz
Director
Karole Lloyd
Director
Katherine Rohrer
Director
Michael Forrester
Director
Miwako Hosoda
Director
Nobuchika Mori
Director
Thomas Kenny
Director
W. Paul Bowers
Lead Non-Management Director
Research analysts who have asked questions during AFLAC earnings calls.
John Barnidge
Piper Sandler
7 questions for AFL
Thomas Gallagher
Evercore
7 questions for AFL
Alex Scott
Barclays PLC
6 questions for AFL
Jack Matten
BMO Capital Markets
5 questions for AFL
Suneet Kamath
Jefferies
5 questions for AFL
Joel Hurwitz
Dowling & Partners Securities, LLC
4 questions for AFL
Ryan Krueger
KBW
4 questions for AFL
Wesley Carmichael
Autonomous Research
4 questions for AFL
Elyse Greenspan
Wells Fargo
3 questions for AFL
Jamminder Bhullar
JPMorgan Chase & Co.
3 questions for AFL
Wilma Jackson Burdis
Raymond James
3 questions for AFL
Jimmy Bhullar
JPMorgan Chase & Co.
2 questions for AFL
Michael Ward
Citi Research
2 questions for AFL
Nicholas Annitto
Wells Fargo & Company
2 questions for AFL
Wes Carmichael
Wells Fargo
2 questions for AFL
Wilma Burdis
Raymond James Financial
2 questions for AFL
Francis Matten
BMO Capital Markets
1 question for AFL
Joshua Shanker
Bank of America Merrill Lynch
1 question for AFL
Taylor Scott
BofA Securities
1 question for AFL
Recent press releases and 8-K filings for AFL.
- Draft Simplification Bill’s Article 26 would amend the guarantee framework to grant AFL-issued bonds a 0% risk-weighting, aligning them with its shareholders’ exposures.
- Although the ACPR granted a 0% risk-weight to French local government debt on 21 June 2024, AFL bonds have remained risk-weighted at 20% (standardised) and 30% following France’s sovereign downgrade.
- Achieving 0% risk-weighting would allow AFL debt to qualify as HQLA Level 1, enhancing market appeal and improving funding terms for French local governments.
- AFL is actively engaging with public authorities to finalise the legal and regulatory amendments in connection with the decentralisation-focused Simplification Bill.
- Record capital returns: In 2025, Aflac repurchased a record $3.5 billion of shares and marked its 43rd consecutive annual dividend increase, deploying nearly $4.8 billion to shareholders.
- Innovation in Japan: Leveraging its Third Sector leadership, Aflac introduced the Tsumitasu savings product, Miraito cancer insurance, and a new medical product, driving two consecutive years of sales growth via bank alliances, agency force, and Japan Post distribution.
- U.S. voluntary benefits growth: Group products grew 14%, outpacing the market, while the Life, Absence & Disability platform saw 11% sales growth and dental & vision sales rebounded 48.8%; Aflac is launching a 1-minute digital enrollment tool for its agents.
- Capital deployment discipline: With an internal capital target of 10% (currently ~6%), Aflac prioritizes dividends and buybacks and remains opportunistic on M&A, while focusing on organic expansion.
- Aflac delivered strong 2025 results with Japanese sales growth driven by the yen-denominated Tsumitasu savings product, Miraito cancer insurance, and a new medical product launched in Q4, alongside $1.6 billion in U.S. supplemental sales
- Returned record capital in 2025 with $3.5 billion in share repurchases and marked the 43rd consecutive year of dividend increases, totaling $4.8 billion to shareholders
- Distribution channels have largely recovered post-pandemic, recruiting ~1,300 agents/agencies in Japan, maintaining partnerships with Japan Post and Dai-ichi, and expanding bank relationships; U.S. launched digital self-guided sales and implemented AI-driven back-office automation
- Product design of fixed-benefit policies limits interest rate sensitivity—with Tsumitasu repricing flexibility—while rising medical inflation underpins supplemental insurance demand; FX and JGB yield exposures are mitigated through asset-liability duration matching and targeted investments
- Targeting an Economic Solvency Ratio of 10% (currently ~6%), prioritizing dividends and buybacks, with organic growth focused on dental & vision and large-case group; M&A remains selective to fill strategic product gaps
- Record shareholder returns in 2025: $3.5 B of share repurchases and the 43rd consecutive dividend increase, totaling $4.8 B returned to shareholders.
- Japan market innovation driving sales: expansion of the Tsumitasu savings product, Miraito cancer insurance and a new medical product, supported by growing bank alliances and agency distribution.
- US product-led growth: group products up 14%, Life, Absence and Disability business up 11%, agency productivity up 16%, with brokers accounting for over 60% of sales and dental & vision sales rebounding 48.8%.
- Capital management focus: targeting a 10% capital ratio (currently ~6%), leveraging a Bermuda REIT to free up excess capital, prioritizing dividends and buybacks, while remaining opportunistic on M&A.
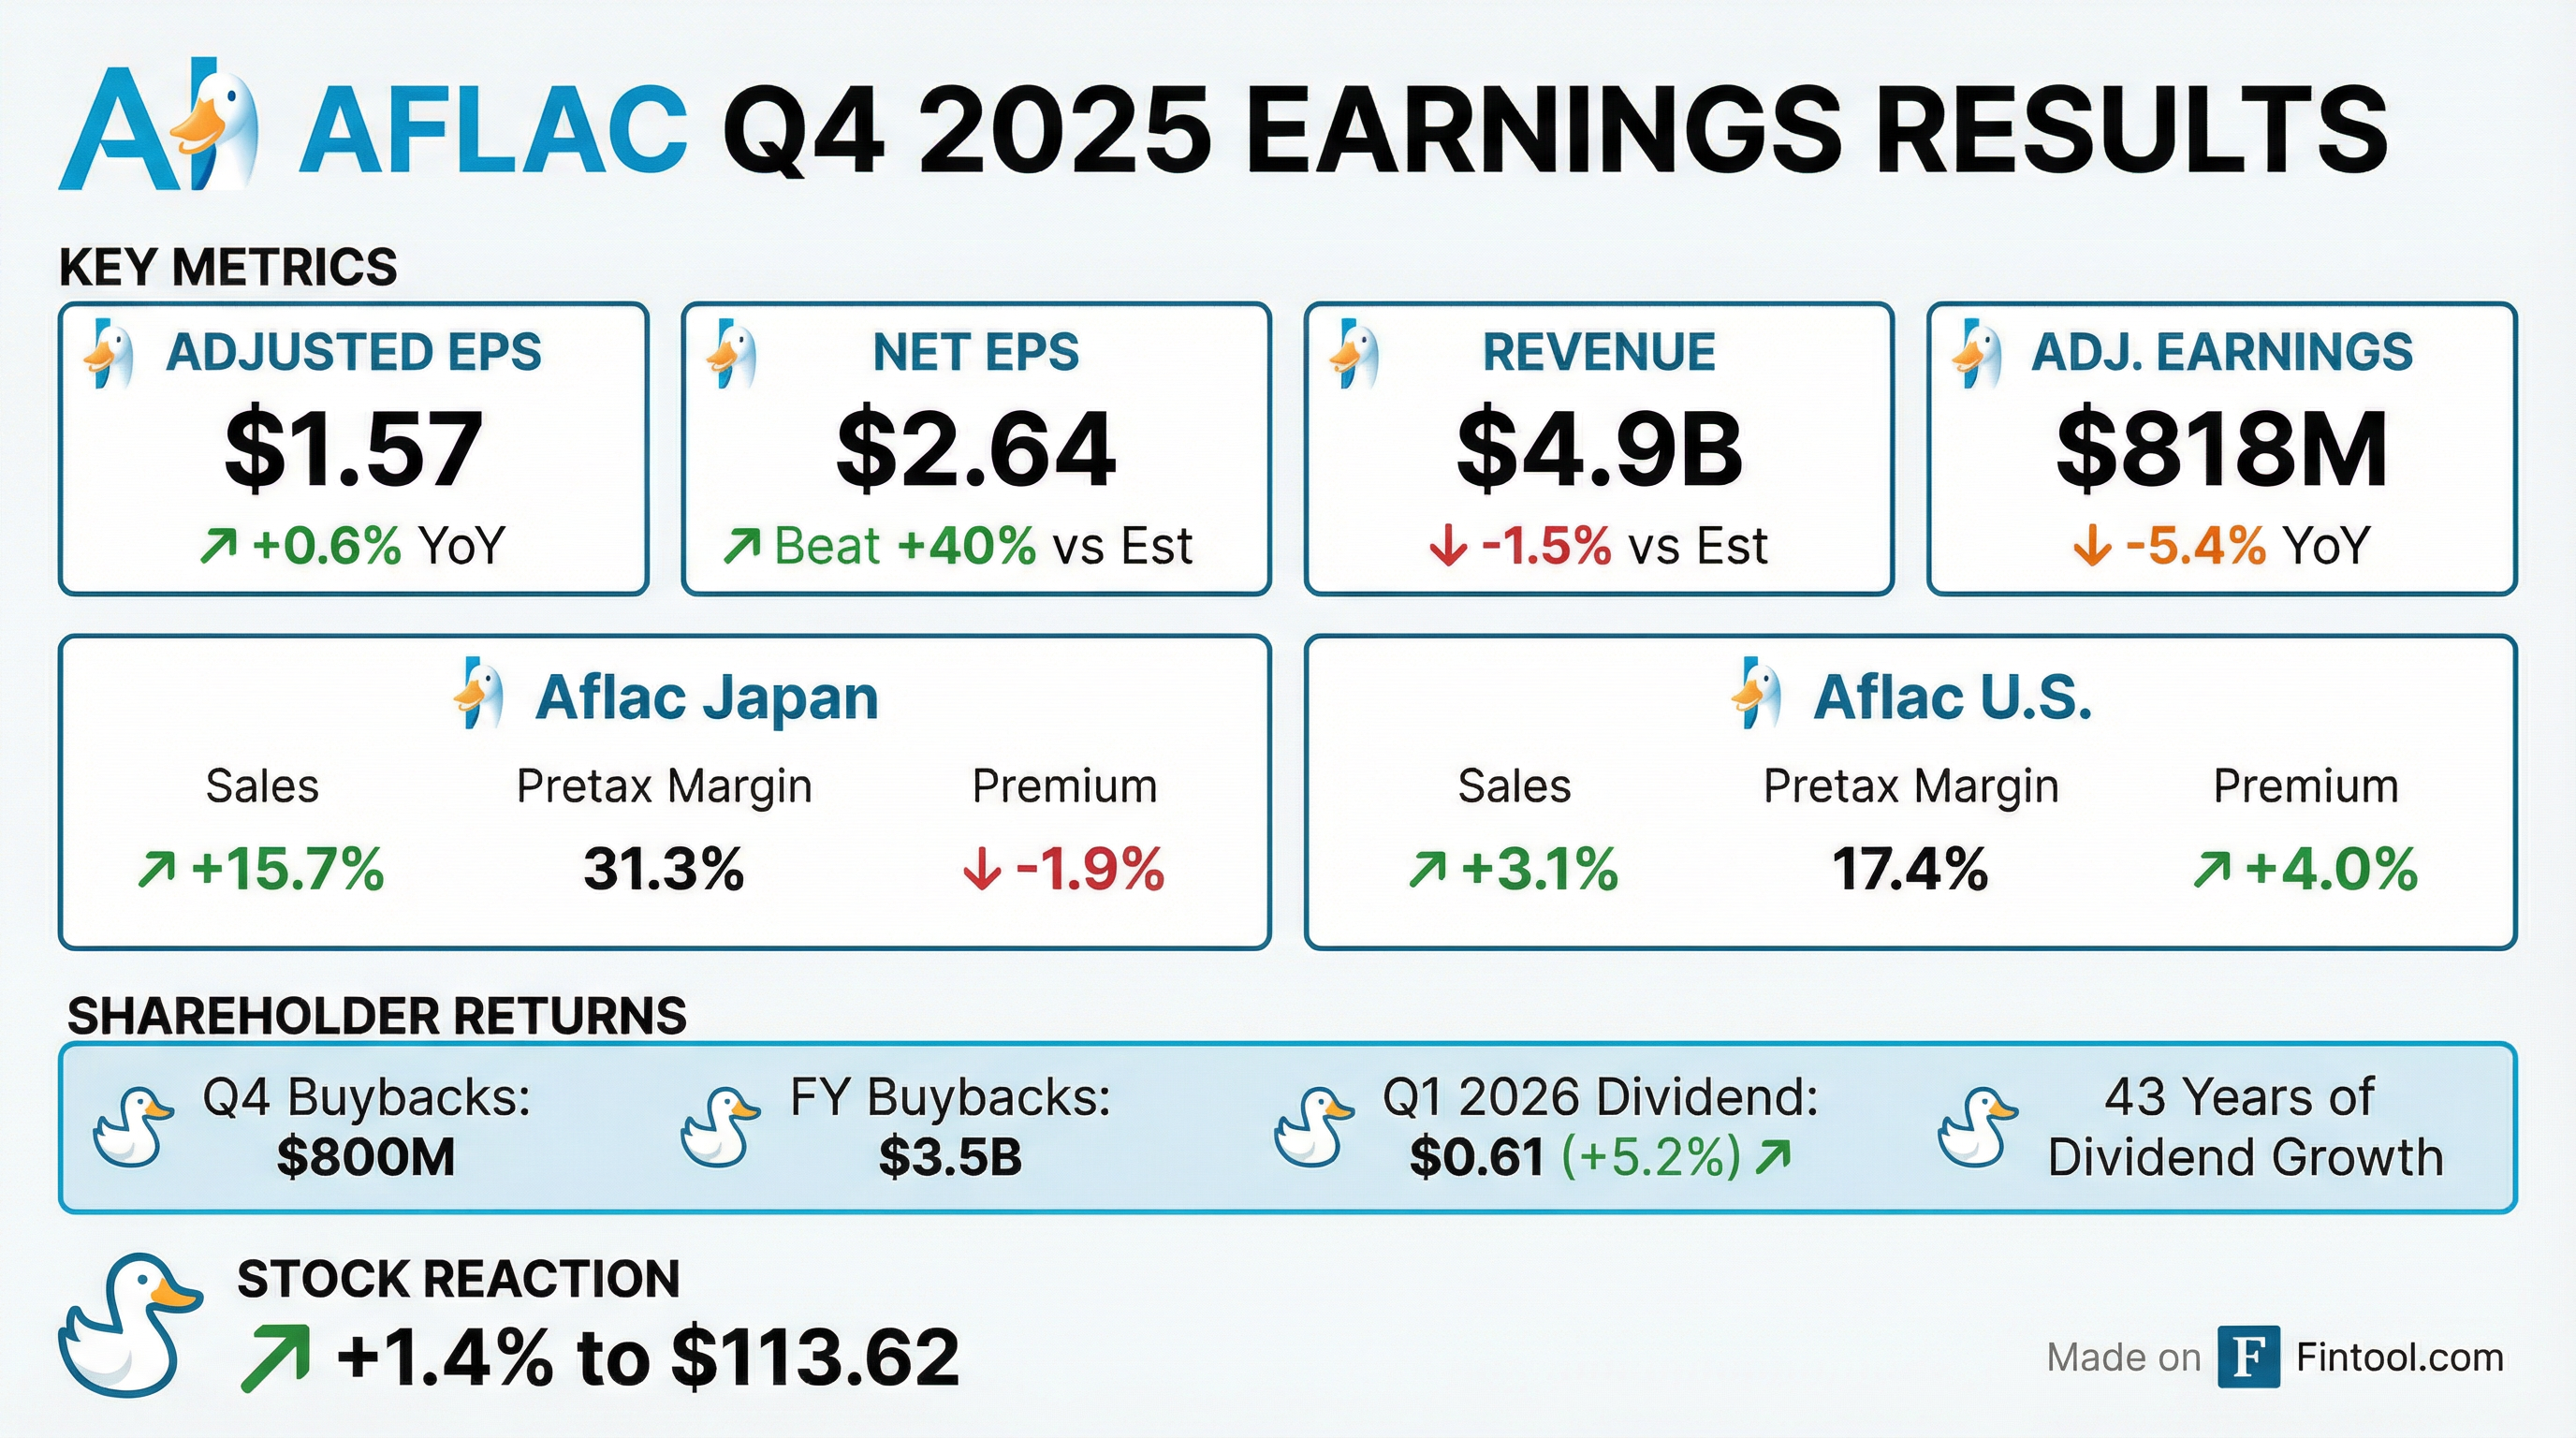
- In 4Q25, net EPS (diluted) $2.64, down 22.8% y-o-y; adjusted EPS ex-FX $1.57, up 0.6% y-o-y.
- Adjusted ROE ex-FX remained 14.5%, and adjusted leverage ratio stood at 21.4%, within the target 20–25% range.
- Regulatory capital strong: Japan ESR with USP at 253% (target 170–230%), U.S. Combined RBC at 575% (target 350–450%).
- Returned $1.103 B to shareholders in 4Q25 via $800 M dividends and $303 M buybacks; 2026 pretax margin guidance: Japan 33–36%, U.S. 17–20%.
- Aflac delivered adjusted EPS of $1.57, up 0.6% year-over-year, with an adjusted ROE of 11.7% (14.5% excluding foreign currency) and adjusted book value per share rising 0.5% excluding FX effects.
- Q4 segment results: Japan net earned premiums fell 1.9% (underlying –1.2%), with a 65% benefit ratio, 22% expense ratio, and 31.3% pre-tax margin; U.S. premiums rose 4%, with a 48.6% benefit ratio, 40.4% expense ratio, and 17.4% pre-tax margin.
- Capital deployment in Q4 included $800 million of share repurchases and $303 million of dividends; for full-year 2025, Aflac repurchased $3.5 billion of stock and paid $1.2 billion in dividends, returning $4.8 billion to shareholders.
- 2026 outlook: Japan underlying premiums down 1%–2%, benefit ratio 60%–63%, expense ratio 20%–23%, and pre-tax margin 33%–36%; U.S. net premium growth 3%–6% (lower end), benefit ratio 48%–52%, expense ratio 36%–39%, and pre-tax margin 17%–20%.
- Q4 EPS: net $2.64, adjusted $1.57; FY net $6.82, adjusted $7.49
- Aflac Japan: Q4 sales +15.7%, FY +16% driven by Moraito cancer product (+35.6%); persistency 93.1%
- Aflac U.S.: 2025 new sales $1.6 billion; premium persistency 79.2%; net earned premiums +2.9%
- Capital return: record $3.5 billion repurchases (33 M shares) & $1.2 billion dividends in 2025; Q1 2026 dividend +5.2%
- 2026 outlook: Japan underlying premiums –1% to –2%, expense ratio 20–23%, benefit ratio 60–63%, margin 33–36%; U.S. premium growth 3–6%, expense ratio 36–39%, benefit ratio 48–52%, margin 17–20%
- Q4 net EPS $2.64 and adjusted EPS $1.57; full-year net EPS $6.82 and adjusted EPS $7.49.
- Japan sales rose 15.7% in Q4 (16% in 2025) with persistency at 93.1%; net earned premiums declined 1.9% in Q4.
- Aflac U.S. new sales $1.6 billion in 2025 (over one-third in Q4); net earned premiums +2.9% and persistency 79.2%.
- Capital deployment: record $3.5 billion share repurchases and $1.2 billion dividends in 2025; Q4 repurchases $800 million, dividends $303 million; Q1 2026 dividend +5.2%.
- 2026 outlook: Japan underlying premiums −1% to −2%, expense ratio 20–23%, benefit ratio 60–63%, margin 33–36%; U.S. premiums +3–6%, benefit ratio 48–52%, expense ratio 36–39%, margin 17–20%.
- Aflac reported Q4 2025 total revenues of $4.9 billion and net earnings of $1.4 billion ($2.64 per diluted share), down from $5.4 billion and $1.9 billion ($3.42/share) in Q4 2024.
- Adjusted Q4 earnings were $818 million or $1.57 per diluted share, a 5.4% decline and a 0.6% increase ex-FX.
- The board raised the Q1 2026 dividend by 5.2% to $0.61 per share and repurchased $800 million of common stock in Q4, with 114.3 million shares still authorized.
- For the full year 2025, revenues fell 9.3% to $17.2 billion, with net earnings of $3.6 billion ($6.82/share), while adjusted EPS grew 3.5% ex-FX.
- In Q4 2025, total revenues were $4.9 billion (vs. $5.4 billion in Q4 2024) and net earnings were $1.4 billion, or $2.64 per diluted share (vs. $1.9 billion, $3.42).
- Adjusted earnings for the quarter were $818 million (–5.4% YoY) and adjusted EPS was $1.57 (+0.6%).
- For FY 2025, revenues declined 9.3% to $17.2 billion and net earnings were $3.6 billion ($6.82 per share), down from $5.4 billion ($9.63) in FY 2024.
- The board declared a Q1 2026 dividend of $0.61 per share, up 5.2%, payable March 2, 2026.
- Aflac repurchased $800 million of common stock (7.2 million shares) in Q4, with 114.3 million shares still authorized for buyback.
Quarterly earnings call transcripts for AFLAC.
Ask Fintool AI Agent
Get instant answers from SEC filings, earnings calls & more