Earnings summaries and quarterly performance for ALERUS FINANCIAL.
Executive leadership at ALERUS FINANCIAL.
Katie A. Lorenson
President and Chief Executive Officer
Alan A. Villalon
Executive Vice President and Chief Financial Officer
Forrest R. Wilson
Executive Vice President and Chief Retirement Services Officer
Jim R. Collins
Executive Vice President and Chief Banking and Revenue Officer
Karin M. Taylor
Executive Vice President and Chief Operating Officer
Missy S. Keney
Executive Vice President and Chief Engagement Officer
Board of directors at ALERUS FINANCIAL.
Research analysts who have asked questions during ALERUS FINANCIAL earnings calls.
Brendan Nosal
Hovde Group, LLC
6 questions for ALRS
Damon Del Monte
Keefe, Bruyette & Woods
6 questions for ALRS
Jeff Rulis
D.A. Davidson & Co.
6 questions for ALRS
David Long
Raymond James Financial, Inc.
5 questions for ALRS
Nathan Race
Piper Sandler & Co.
5 questions for ALRS
Adam Crow
Piper Sandler
1 question for ALRS
David Feaster
Raymond James
1 question for ALRS
Recent press releases and 8-K filings for ALRS.
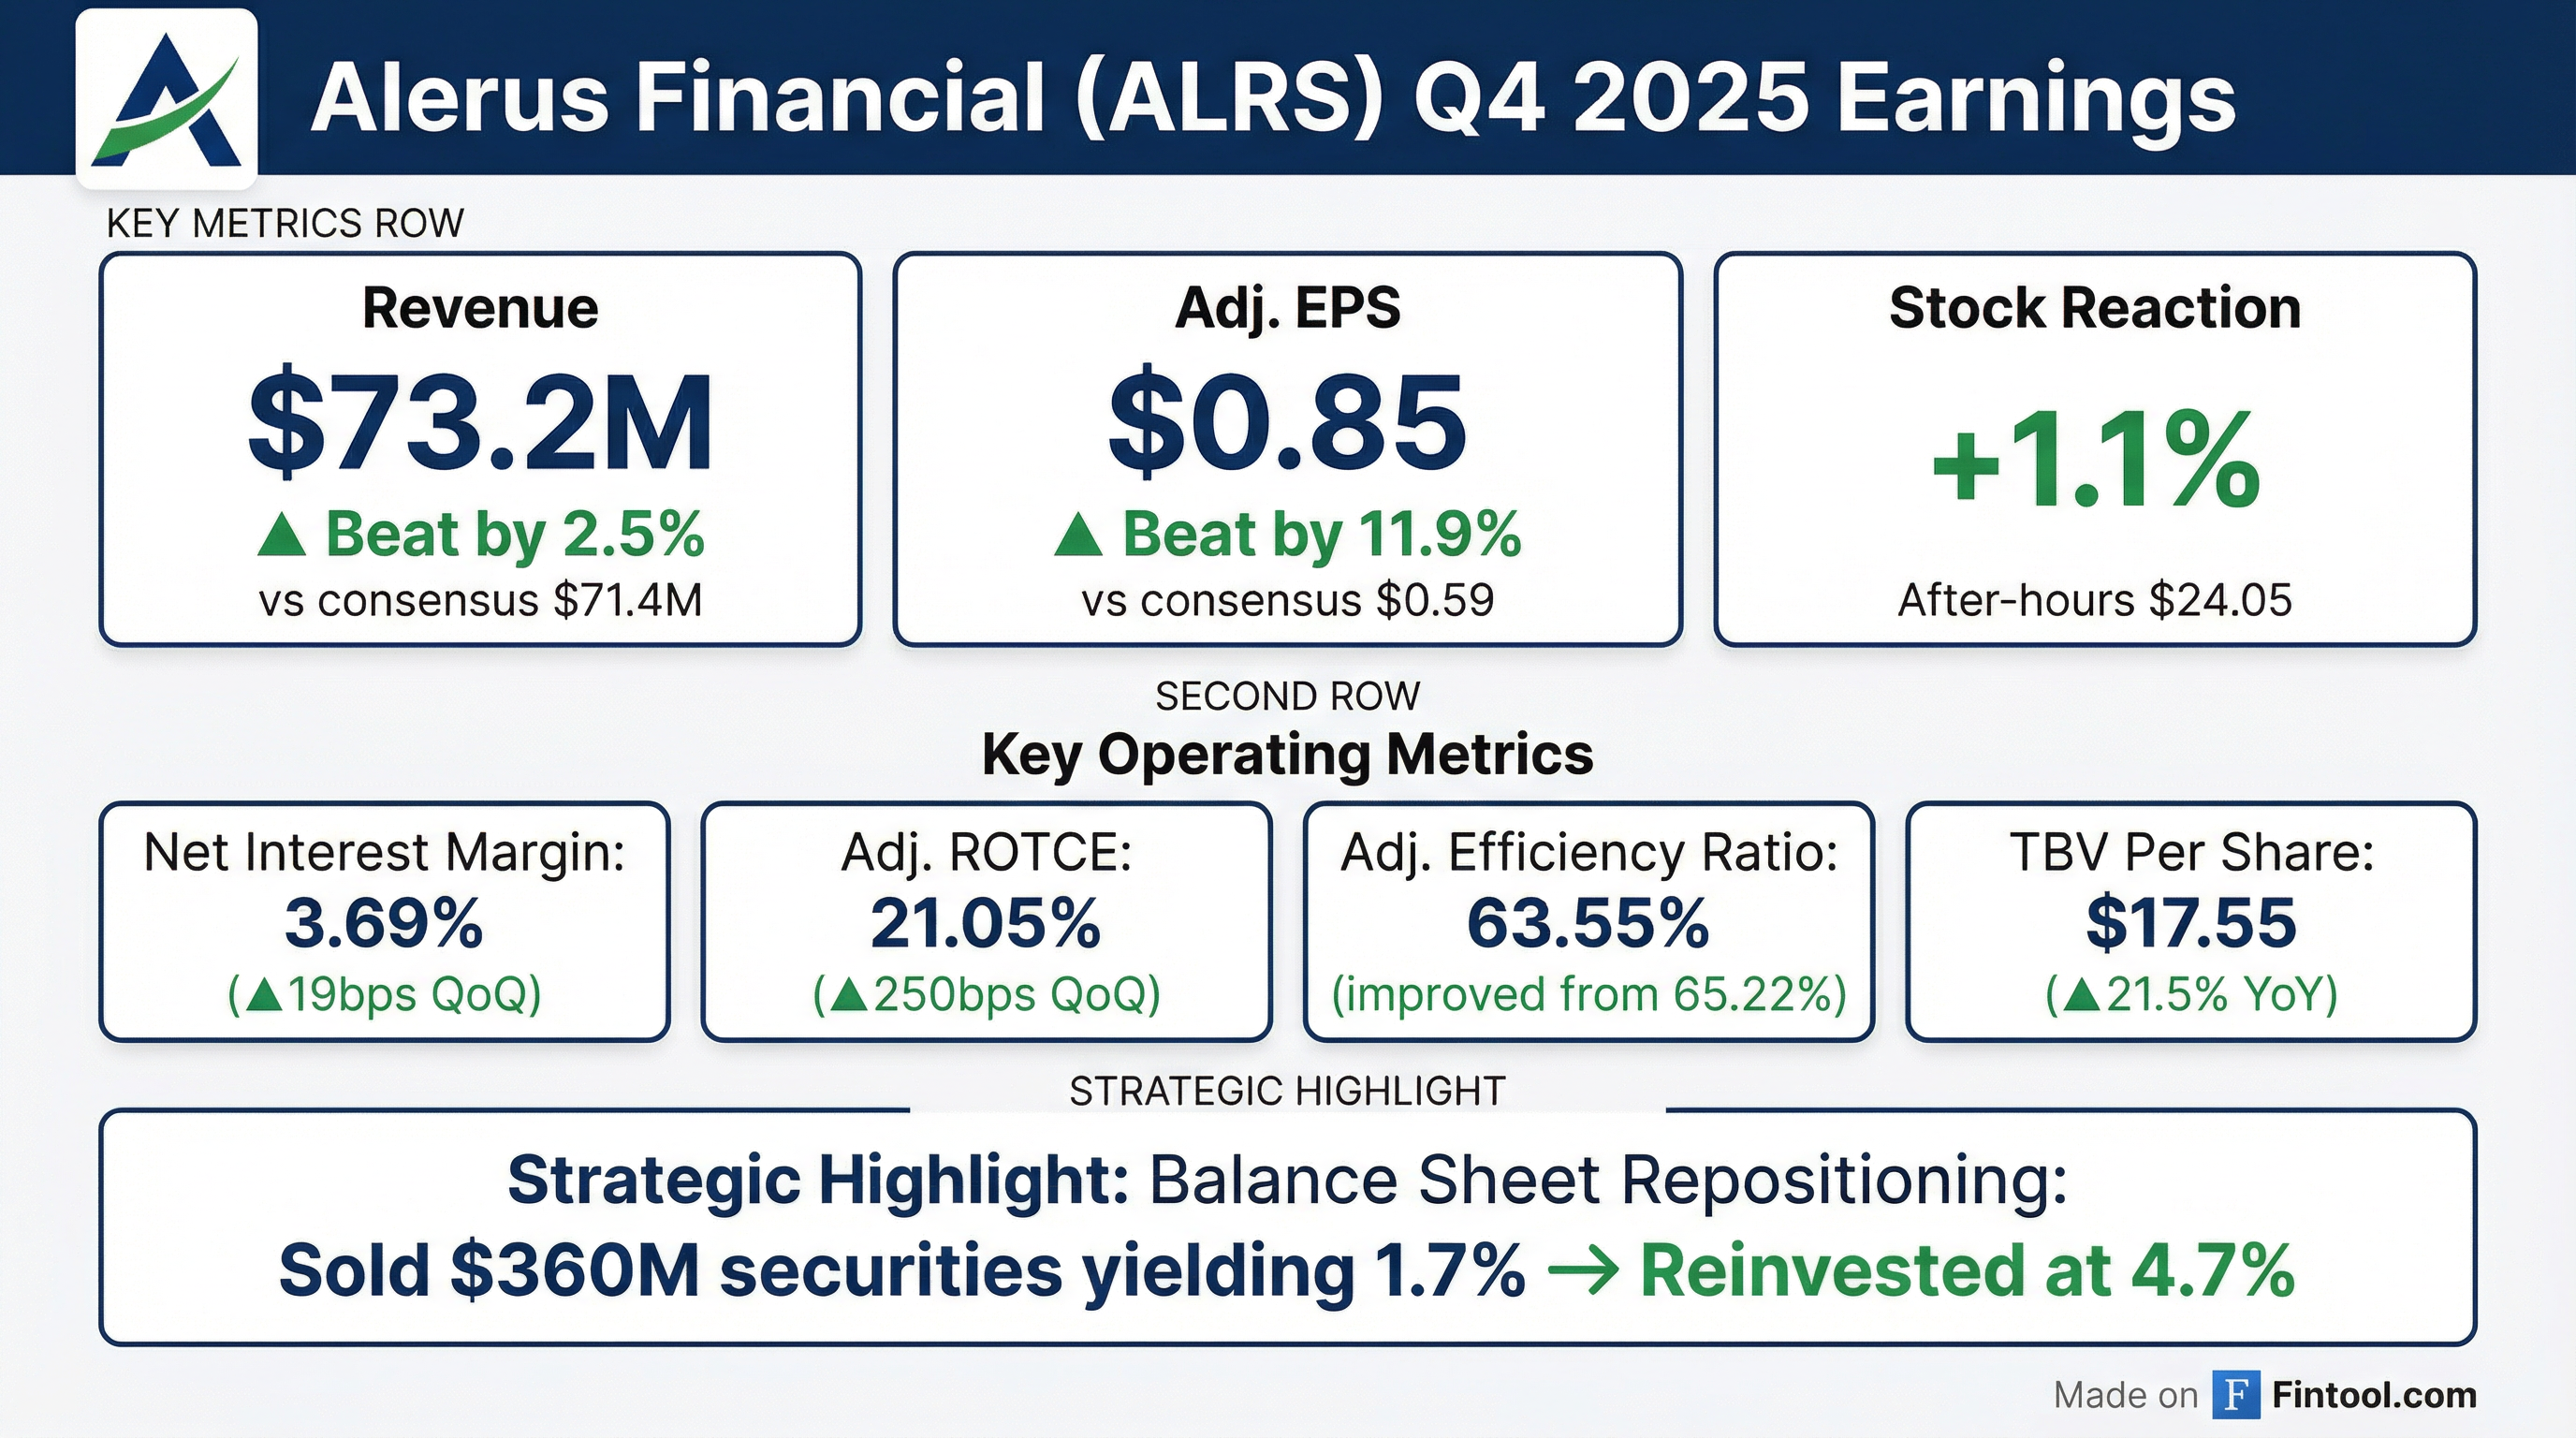
- Alerus reported Adjusted EPS of $0.85 for Q4 2025, an increase of $0.19 compared to Q3 2025.
- Net Interest Income (NII) for Q4 2025 was $45.2 million, with a Net Interest Margin (NIM) of 3.69%.
- As of December 31, 2025, Loans totaled $4.0 billion and Deposits were $4.2 billion.
- The company completed a strategic balance sheet repositioning, selling $360 million of AFS securities with a 1.7% weighted average yield and reinvesting the proceeds into securities with a 4.7% weighted average yield.
- For full-year 2026, Alerus provided guidance including mid-single digit growth for Loans and Adjusted Revenue, low-single digit growth for Deposits and Adjusted Noninterest Expense, and a Net Interest Margin between 3.50% and 3.60%.
- Alerus Financial Corporation reported a core return on assets (ROA) of 1.62% for Q4 2025 and an adjusted ROA of 1.35% for the full year 2025. Net interest income reached $45.2 million with a reported net interest margin of 3.69% in Q4 2025. Fee income remained strong, exceeding 40% of total revenues , with retirement business revenue up 4.6% to $17.3 million and wealth management revenue up 13.4% to $7.4 million quarter-over-quarter.
- In 2025, the company executed a strategic balance sheet repositioning, including selling $360 million of available-for-sale securities with a 1.7% yield and reinvesting proceeds at 4.7%. Loans decreased 1.3% quarter-over-quarter due to strategic downsizing and pruning marginal credits, while deposits declined 5% due to intentional optimization. The tangible common equity ratio improved to 8.72% from 8.24% in the prior quarter.
- For 2026, Alerus expects mid-single digit loan growth and low single digit deposit growth, with the net interest margin projected to be around 3.5% to 3.6%. Adjusted non-interest income and net revenue are both expected to grow in the mid-single digits, while non-interest expense is anticipated to grow in the low single digits. The company aims for an ROA exceeding 1.2% for the year and a target loan-to-deposit ratio of 95%-96%.
- Alerus Financial Corporation reported a core return on assets (ROA) of 1.62% for Q4 2025 and an adjusted ROA of 1.35% with an adjusted efficiency ratio of 64.45% for the full year 2025, following the successful integration of Home Federal.
- The company executed a strategic balance sheet repositioning in 2025, including selling $360 million of low-yielding available-for-sale securities and reinvesting at a higher yield, leading to an improved tangible common equity (TCE) ratio of 8.72%.
- For 2026, Alerus expects mid-single digit loan growth, low single digit deposit growth, a net interest margin (NIM) of 3.5%-3.6%, and a return on assets (ROA) exceeding 1.2%.
- Fee income remained strong, comprising over 40% of total revenues, with assets in the retirement and wealth divisions reaching nearly $50 billion by the end of 2025.
- Alerus Financial Corporation reported a core ROA of 1.62% for Q4 2025 and an adjusted ROA of 1.35% for the full year 2025, with an adjusted efficiency ratio of 64.45%.
- The company executed a strategic balance sheet repositioning in 2025, including selling $360 million of available-for-sale securities and reinvesting at a higher yield, and strategically downsizing the loan portfolio.
- For 2026, Alerus expects mid-single digit loan growth, low single digit deposit growth, a net interest margin of 3.5%-3.6%, and an ROA exceeding 1.2%.
- Alerus ended 2025 with a TCE ratio of 8.72% and CET1 capital levels at 10.28%, and is building a pipeline of potential M&A partners in the retirement and HSA space.
- Fee income businesses grew core revenues 7% year-over-year, with fee income remaining over 40% of total revenues, and assets in retirement and wealth divisions reaching nearly $50 billion.
- Alerus Financial Corporation reported a net loss of $33.1 million, or $(1.27) per diluted common share, for the fourth quarter of 2025, primarily due to a $68.4 million pre-tax net loss from a strategic balance sheet repositioning involving the sale of available-for-sale securities. However, adjusted diluted earnings per common share (non-GAAP) were $0.85 for the quarter.
- Net interest income increased by 4.7% to $45.2 million in Q4 2025 compared to Q3 2025, with the net interest margin rising to 3.69% from 3.50% in the prior quarter. For the full year 2025, net interest income grew 61.1% to $172.5 million, and the net interest margin increased by 97 basis points to 3.53%.
- For the full year ended December 31, 2025, the company achieved an adjusted return on average assets (non-GAAP) of 1.35% and an adjusted efficiency ratio (non-GAAP) of 64.45%.
- The company strengthened its capital and risk profile, with the tangible common equity to tangible assets ratio (non-GAAP) increasing to 8.72% as of December 31, 2025, from 7.13% a year prior, and tangible book value per common share (non-GAAP) growing 21.54% from the prior year to $17.55.
- Alerus Financial Corporation reported a net loss of $33.1 million, or $(1.27) per diluted common share, for the fourth quarter of 2025, compared to net income of $16.9 million, or $0.65 per diluted common share, for the third quarter of 2025.
- This net loss was primarily driven by a strategic balance sheet repositioning in the fourth quarter of 2025, which included the sale of $360.1 million of available-for-sale securities and resulted in a one-time pre-tax net loss of $68.4 million.
- For the full year ended December 31, 2025, the company exceeded financial performance expectations with an adjusted return on average assets of 1.35% and an adjusted efficiency ratio of 64.45%.
- The company strengthened its capital and risk profile, with tangible common equity to tangible assets rising to 8.72% and reserves ending at 1.53% of loans as of December 31, 2025.
- Alerus Financial Corporation sold $360 million of available-for-sale securities on December 23, 2025, representing over 68% of its total AFS securities, which resulted in a one-time pre-tax net loss of $68.5 million.
- The company reinvested the proceeds into new investment securities with a weighted average yield of 4.7% and a duration of just over 3 years, compared to the sold securities' 1.7% yield and 5.1-year duration.
- This strategic reinvestment is expected to improve the 2026 net interest margin guidance to 3.50% to 3.60%, an increase from the previous guidance of 3.35% to 3.45%.
- The securities portfolio restructuring is anticipated to position the company for higher earnings and improved financial returns in 2026 and beyond, with no impact on tangible capital.
- On December 23, 2025, Alerus Financial Corporation sold $360 million of available-for-sale securities, representing over 68% of its total AFS securities, resulting in a one-time pre-tax net loss of $68.5 million.
- The company reinvested the proceeds into new investment securities with a weighted average yield of 4.7% and a duration of just over 3 years, significantly higher than the 1.7% yield of the sold securities.
- This strategic reinvestment led to an updated 2026 net interest margin guidance of 3.50% to 3.60%, an increase from the previous guidance of 3.35% to 3.45%.
- Alerus expects risk-based capital measures to remain above regulatory limits and internal targets at the end of 2025, with no impact on tangible capital from this restructuring.
- Alaris Financial Corporation reported Q3 2025 results with net interest income increasing 0.2% and a stable net interest margin of 3.5%. Loans grew 1.4% and deposits increased 1.7% quarter-over-quarter.
- Non-performing assets to total assets rose to 1.13%, driven by one commercial relationship and a large multifamily loan, which together account for nearly 75% of total non-performers. The company holds a 50% reserve against the commercial relationship and a 15% reserve for the multifamily loan.
- Strategic actions included de-risking the balance sheet, resulting in the investor CRE to capital ratio dropping below the 300% threshold, and a focus on organic growth in commercial and industrial (C&I) relationships. Alaris also completed a major platform upgrade in wealth management and plans to double the number of wealth advisors.
- For 2025, Alaris expects year-end loans to exceed $4,100,000,000 and deposits to be around $4,300,000,000. For 2026, the company anticipates mid-single digit loan growth and low single-digit deposit growth, with a net interest margin between 3.35% and 3.45%.
- ALRS reported Net Income of $16,924 thousand and Adjusted Diluted Earnings Per Common Share of $0.66 for Q3 2025.
- The company saw total loans increase by 1.4% to $4.1 billion and total deposits increase by 1.7% to $4.4 billion from the prior quarter.
- Asset quality highlights include net recoveries of $1.7 million and a reserves to total loans ratio of 1.51% as of September 30, 2025, with no provision for credit losses recorded for the quarter.
- For FY 2025, ALRS provided guidance for loans between $4.1-4.2 billion, deposits between $4.3-4.4 billion, and an Adjusted Return on Average Total Assets of >1.15%.
Quarterly earnings call transcripts for ALERUS FINANCIAL.
Ask Fintool AI Agent
Get instant answers from SEC filings, earnings calls & more