Earnings summaries and quarterly performance for AMETEK INC/.
Executive leadership at AMETEK INC/.
David A. Zapico
Chairman and Chief Executive Officer
Dalip Puri
Executive Vice President–Chief Financial Officer
David Hermance
President–Electromechanical Group
Emanuela Speranza
Chief Commercial Officer
John Hardin
President–Electronic Instruments
Robert Amodei
Senior Vice President, Controller and Principal Accounting Officer (effective January 1, 2026)
Ronald Oscher
Chief Administrative Officer
Thomas Marecic
President–Electronic Instruments
Thomas Montgomery
Senior Vice President–Comptroller & Principal Accounting Officer
Tony Ciampitti
President–Electronic Instruments
Board of directors at AMETEK INC/.
Research analysts who have asked questions during AMETEK INC/ earnings calls.
Andrew Obin
Bank of America
8 questions for AME
Scott Graham
Seaport Research Partners
7 questions for AME
Brett Linzey
Mizuho Securities
6 questions for AME
Deane Dray
RBC Capital Markets
6 questions for AME
Matt Summerville
D.A. Davidson & Co.
6 questions for AME
Andrew Buscaglia
BNP Paribas
5 questions for AME
Christopher Snyder
Morgan Stanley
5 questions for AME
Jamie Cook
Truist Securities
5 questions for AME
Joseph Giordano
TD Cowen
5 questions for AME
Jeffrey Sprague
Vertical Research Partners
4 questions for AME
Julian Mitchell
Barclays Investment Bank
4 questions for AME
Nigel Coe
Wolfe Research, LLC
4 questions for AME
Robert Wertheimer
Melius Research
4 questions for AME
Christopher Glynn
Oppenheimer & Co. Inc.
3 questions for AME
Robert Mason
Robert W. Baird & Co.
3 questions for AME
Rob Wertheimer
Melius Research LLC
3 questions for AME
Christian Zijlstra
KeyBanc Capital Markets
2 questions for AME
Matthew Summerville
D.A. Davidson
2 questions for AME
Michael Anastasiou
Cowen and Company
2 questions for AME
Nicole DeBlase
Deutsche Bank
2 questions for AME
Robert Jamieson
Vertical Research Partners
2 questions for AME
Deane Michael Dray
RBC Capital Markets
1 question for AME
Jacob Moore
Sidoti & Company, LLC
1 question for AME
Nigel Edward Coe
Wolfe Research
1 question for AME
Sahil Guttal
RBC Capital Markets
1 question for AME
Steve Barger
KeyBanc Capital Markets Inc.
1 question for AME
Recent press releases and 8-K filings for AME.
- AMETEK’s Board approved a 10% increase in its quarterly cash dividend to $0.34 per share, raising the indicated annual rate to $1.36.
- The first‐quarter dividend is payable March 31, 2026, to shareholders of record on March 16, 2026.
- CEO David A. Zapico highlighted strong growth, outstanding cash‐flow generation and excellent operating results, and reiterated the focus on strategic acquisitions and dividend growth.
- The company reports annual sales of $7.5 billion and targets double‐digit EPS growth and superior return on total capital.
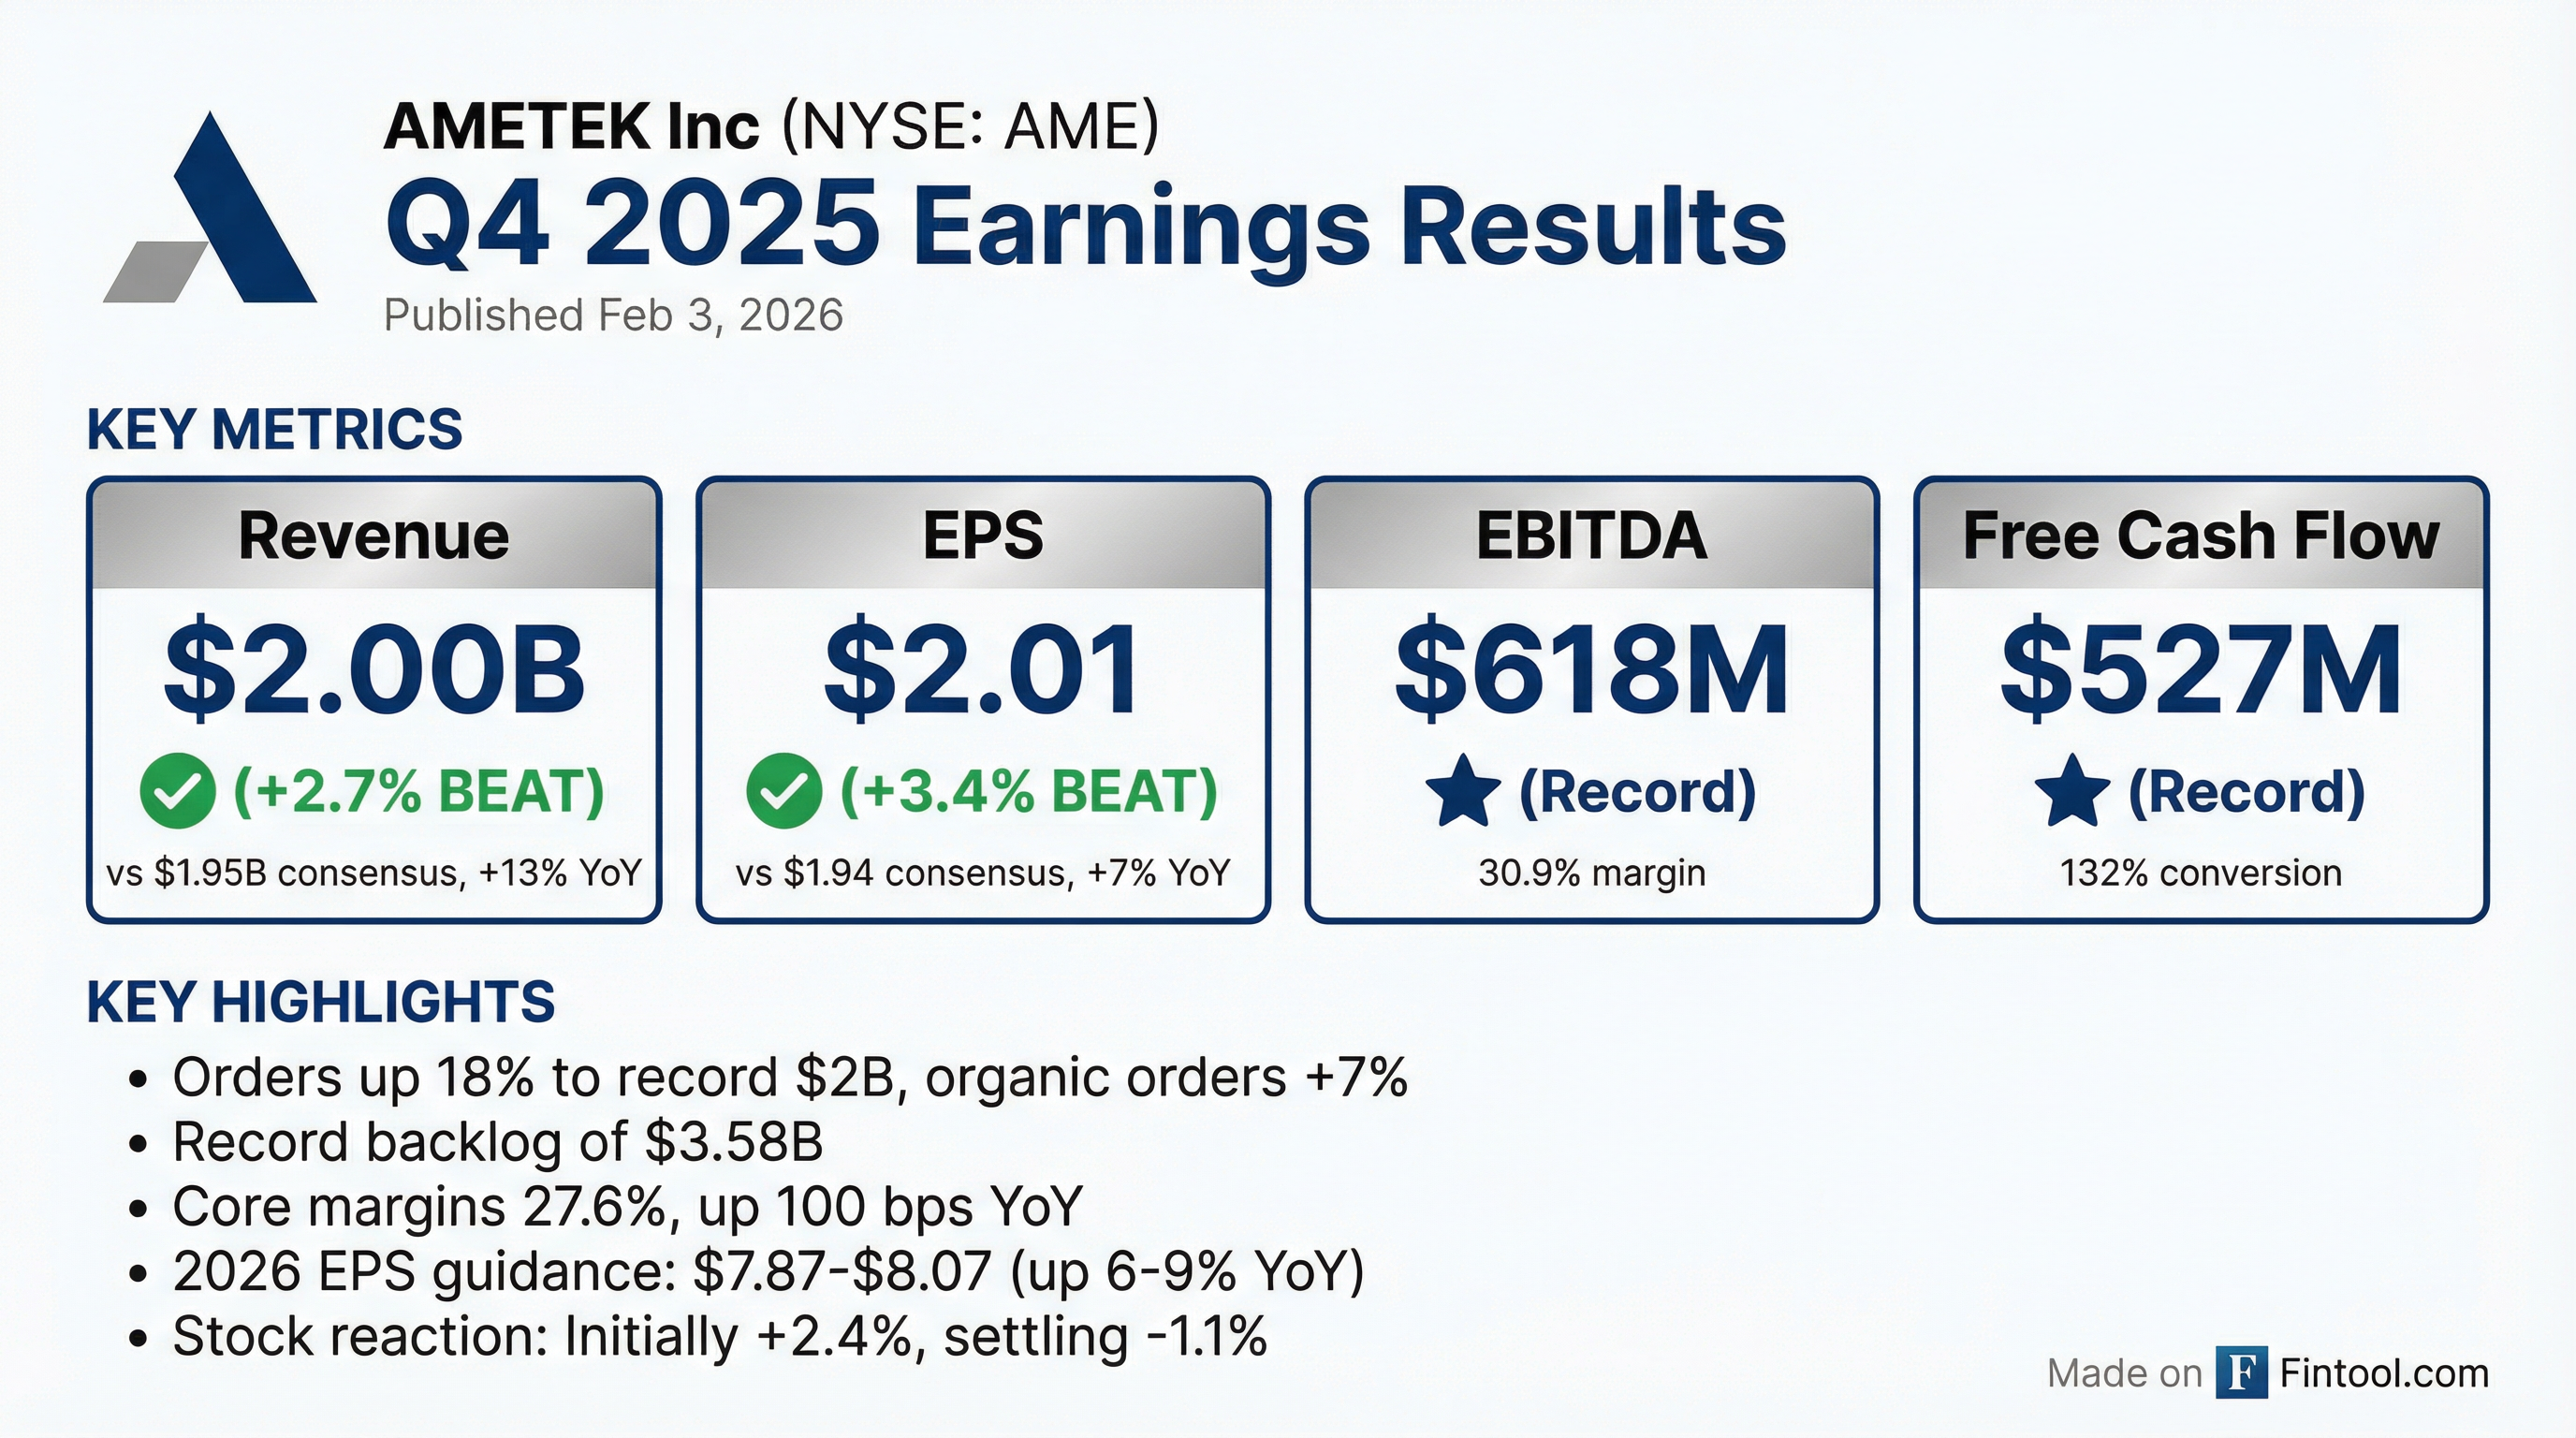
- AMETEK’s Q4 2025 sales reached $2.0 billion, up 13% year-over-year; GAAP EPS was $1.73, while adjusted EPS rose 7% to $2.01.
- Q4 operating income hit a record $505.5 million (adjusted $523.0 million), with operating cash flow of $584.3 million and free cash flow of $527.3 million.
- For FY 2025, sales were $7.4 billion, up 7%; GAAP EPS was $6.40, and adjusted EPS grew 9% to $7.43, with adjusted operating margin of 26.2%.
- AMETEK delivered record Q4 sales of $2.0 billion (up 13% YoY; organic +5%, acquisitions +7%, FX +1) and orders of $2.0 billion (up 18% YoY; organic +7%), driving a backlog of $3.58 billion.
- Q4 operating income was $523 million (up 12% YoY) with core operating margins of 27.6% (up 100 bps); EBITDA reached $618 million (up 10%; margin 30.9%).
- Free cash flow in the quarter was $527 million (up 6% YoY) with a 132% free cash flow to net income conversion; full-year free cash flow was $1.7 billion (113% conversion).
- For 2026, AMETEK guides sales growth of mid- to high-single digits (organic up low- to mid-single digits) and EPS of $7.87–$8.07 (up 6–9%); Q1 sales are expected +10% with EPS of $1.90–$1.95 (up 6–9%).
- Completed the acquisitions of LKC Technologies to expand med-tech exposure and FARO Technologies, deploying over $1.8 billion on acquisitions and returning $443 million in share repurchases in 2025.
- AMETEK delivered record $2.0 billion Q4 sales (+13%), $2.0 billion Q4 orders (+18%), operating income of $523 million (+12%) and EPS of $2.01 (+7%) versus prior year.
- FY 2025 sales reached $7.4 billion (+7%), operating income $1.94 billion (+7%), EBITDA $2.33 billion (+7%) and diluted EPS $7.43 (+9%).
- Q4 organic sales grew 5%, acquisitions added 7 points, FX contributed +1 point; backlog ended at a record $3.58 billion.
- Completed acquisitions of FARO Technologies and Kern Microtechnik (~$1 billion), and announced LKC Technologies deal to broaden med-tech offerings.
- 2026 outlook: sales up mid- to high-single digits (organic +low- to mid-single digits), EPS $7.87–$8.07; Q1 sales +~10% with EPS of $1.90–$1.95.
- Record Q4 sales of $2.0 billion (+13% YoY) and operating income of $523 million (+12%) with core margin up 100 bps to 27.6%
- Full-year 2025 sales of $7.4 billion (+7%), operating income $1.94 billion (+7%), and EPS of $7.43 (+9%)
- Free cash flow of $527 million in Q4 (up 6%) with 132% conversion of net income; $443 million in share repurchases for the year
- Completed acquisitions of FARO Technologies and Kern Microtechnik (~$1 billion), added LKC Technologies in Q4; capacity to deploy $5 billion while maintaining investment-grade rating
- 2026 outlook: sales up mid- to high-single digits (organic low- to mid-single digits); EPS guidance $7.87–$8.07 (+6–9%)
- Record Q4 results: sales of $2.0 billion (+13% y/y), GAAP EPS $1.73, adjusted EPS $2.01
- Full-year 2025 performance: sales of $7.4 billion (+7% y/y), GAAP EPS $6.40, adjusted EPS $7.43, operating income $1.91 billion
- Segment performance: Q4 EIG sales $1.37 billion (+13%) with operating income $396.1 million; EMG sales $628.9 million (+15%) with operating income $142.5 million
- Cash flow strength: Q4 operating cash flow $584.3 million, free cash flow $527.3 million, free cash flow to net income conversion 132%
- 2026 guidance: expects mid- to high-single-digit sales growth, adjusted EPS $7.87–$8.07, and Q1 sales growth ~10% with adjusted EPS $1.85–$1.90
- AMETEK reported record Q3 sales of $1.89 billion, up 11% YoY, with GAAP EPS of $1.60 and adjusted EPS of $1.89, a 14% increase YoY.
- Q3 GAAP operating income was $488.4 million (25.8% margin), while adjusted operating income reached $496.1 million, up 11% year-over-year.
- Electronic Instruments Group sales grew 10% to $1.25 billion (adjusted operating income $360.2 million, +6%), and Electromechanical Group sales rose 13% to $646.3 million (operating income $163.9 million, +25%).
- AMETEK raised its 2025 adjusted EPS guidance to $7.32–$7.37, up 7–8% over 2024, and expects Q4 sales growth of ~10% with adjusted EPS of $1.90–$1.95.
- Record Q3 sales of $1.89 billion (up 11% Y/Y; organic +4%), orders of $1.97 billion (up 13%; organic +7%) and backlog of $3.54 billion
- Operating income of $496 million (+11% Y/Y), EBITDA of $592 million (+11%) and diluted EPS of $1.89 (+14%); raised full-year EPS guidance to $7.32–$7.37 (prior $7.06–$7.20)
- Segment performance: EIG sales of $1.25 billion (+10%; margin ex-acquisitions 30.4%, +50 bps) and EMG sales of $646 million (+13%; margin 25.4%, +250 bps)
- Strong cash flow: Q3 free cash flow of $420 million (113% conversion), net debt/EBITDA at 0.9×; deployed $920 million on FARO acquisition, $150 million on buybacks, and $71 million in dividends
- Recorded Q3 sales of $1.89 billion, up 11%, with operating income of $496 million (+11%) and diluted EPS of $1.89 (+14%).
- Raised full-year diluted EPS guidance to $7.32–$7.37, and expects Q4 sales up ~10% with EPS of $1.90–$1.95.
- Generated $441 million in operating cash flow and $420 million in free cash flow (113% conversion); ended Q3 with net debt/EBITDA of 0.9× and deployed $920 million on FARO, $150 million on buybacks, and $71 million in dividends.
- Achieved record segment results: Electronic Instruments Group sales of $1.25 billion (+10%), with 30.4% operating margin ex-acquisitions; Electromechanical Group sales of $646 million (+13%) with 25.4% margin ex-acquisitions.
- Recent acquisitions (FARO, Vertech, Kern, Paragon) are integrating well, and the M&A pipeline remains robust for further strategic deals.
- AMETEK delivered record third-quarter sales of $1.89 billion (up 11% y/y), with organic sales +4% and orders of $1.97 billion (up 13%).
- Operating performance was strong: operating income of $496 million (up 11%), EBITDA of $592 million (+11%), and diluted EPS of $1.89 (up 14%).
- Raised full-year EPS guidance to $7.32–$7.37 (up 7–8% vs. 2024); Q4 outlook calls for ~10% sales growth and EPS of $1.90–$1.95.
- Generated $420 million of free cash flow in Q3 (113% conversion) and maintained a net debt/EBITDA ratio of 0.9×.
Quarterly earnings call transcripts for AMETEK INC/.
Ask Fintool AI Agent
Get instant answers from SEC filings, earnings calls & more