Earnings summaries and quarterly performance for BRUNSWICK.
Executive leadership at BRUNSWICK.
David Foulkes
Chairman and Chief Executive Officer
Aine Denari
Executive Vice President and President, Navico Group, and Chief Technology Officer
Brenna Preisser
Executive Vice President and President, Brunswick Boat Group
John Buelow
Executive Vice President and President, Mercury Marine
Ryan Gwillim
Executive Vice President and Chief Financial and Strategy Officer
Board of directors at BRUNSWICK.
David Everitt
Lead Independent Director
David Singer
Director
Joseph McClanathan
Director
Lauren Flaherty
Director
MaryAnn Wright
Director
Nancy Cooper
Director
Reginald Fils-Aimé
Director
Roger Wood
Director
Steven Whisler
Director
Research analysts who have asked questions during BRUNSWICK earnings calls.
Craig Kennison
Robert W. Baird & Co. Incorporated
7 questions for BC
James Hardiman
Citigroup
7 questions for BC
Xian Siew
BNP Paribas
7 questions for BC
Jaime Katz
Morningstar
6 questions for BC
Joseph Altobello
Raymond James & Associates, Inc.
5 questions for BC
Anna Glaessgen
B. Riley Securities
3 questions for BC
Michael Swartz
Truist Securities
3 questions for BC
Noah Zatzkin
KeyBanc Capital Markets
3 questions for BC
Scott Stember
ROTH MKM
3 questions for BC
Frederick Wightman
Wolfe Research, LLC
2 questions for BC
Megan Christine Alexander
Morgan Stanley
2 questions for BC
Amanda Douglas
JPMorgan Chase & Co.
1 question for BC
Garrick Johnson
Seaport Research Partners
1 question for BC
Gerrick Johnson
Seaport Research
1 question for BC
Joseph Nolan
Longbow Research
1 question for BC
Matthew Boss
JPMorgan Chase & Co.
1 question for BC
Megan Alexander
Morgan Stanley
1 question for BC
Stephen Grambling
Morgan Stanley
1 question for BC
Tristan Thomas Martin
BMO Capital Markets
1 question for BC
Tristan Thomas-Martin
BMO Capital Markets
1 question for BC
Recent press releases and 8-K filings for BC.
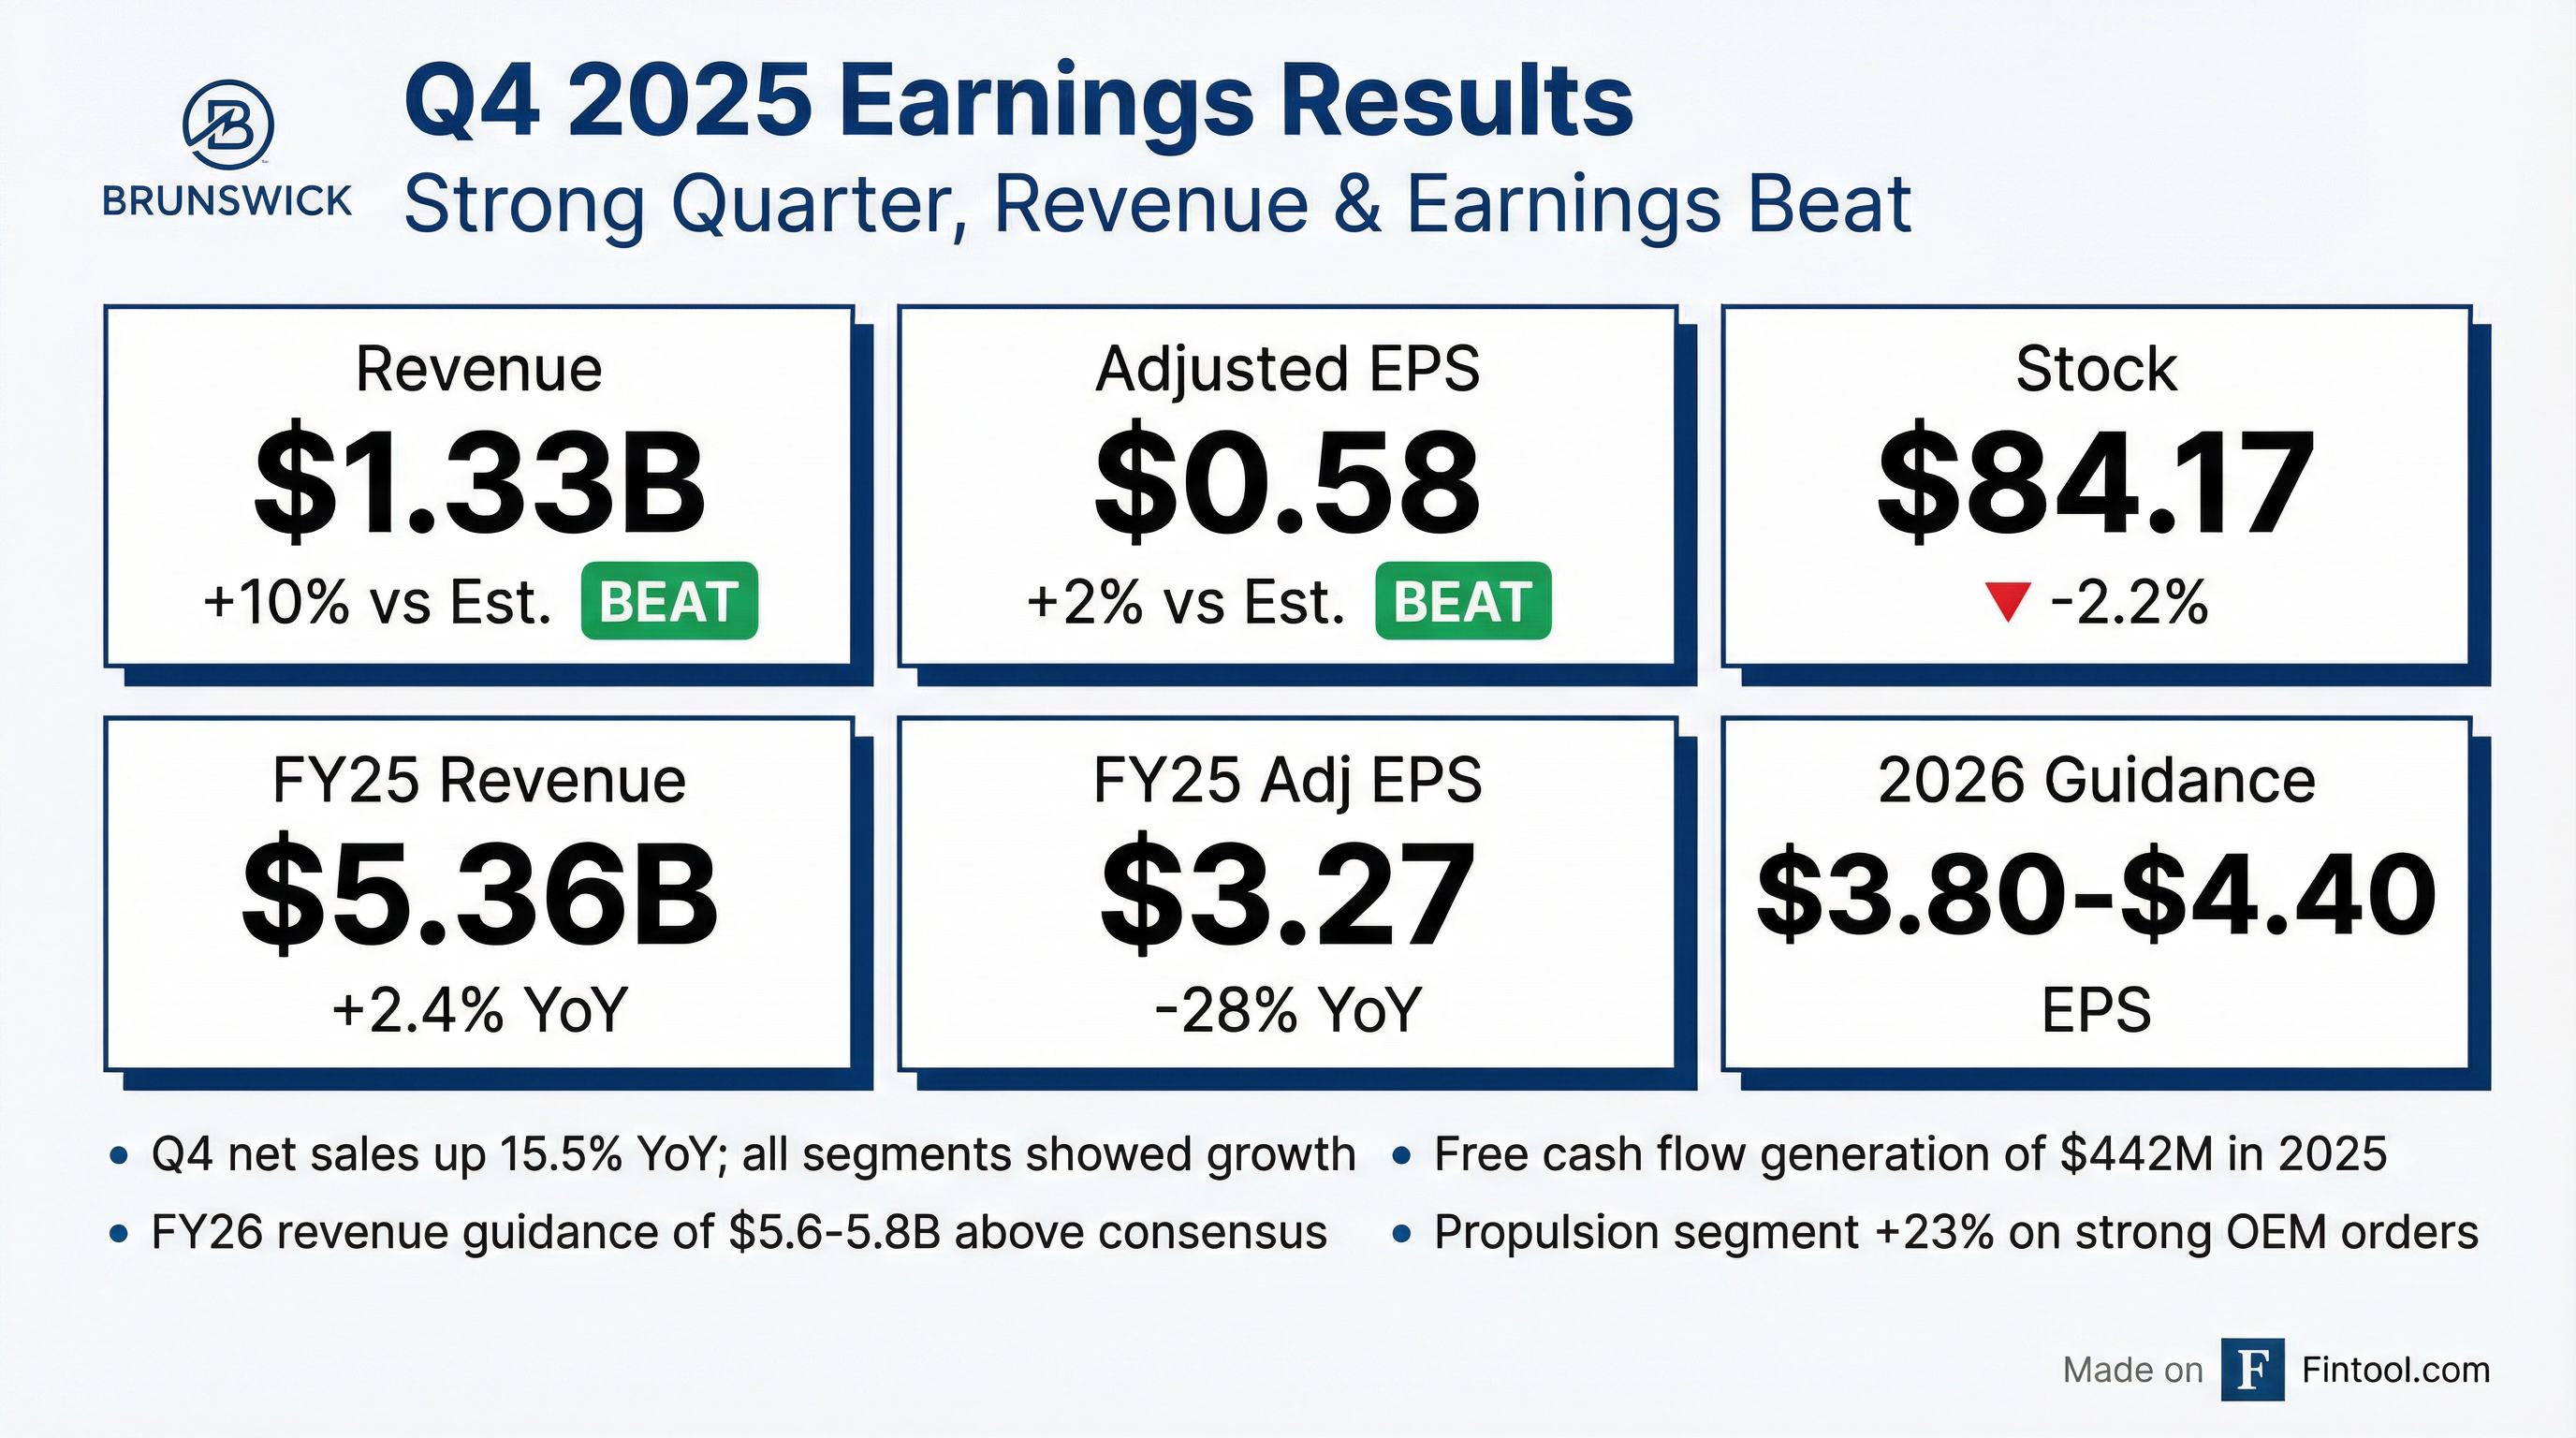
- Brunswick reported full-year 2025 net sales of $5.4 billion, up 2% over the prior year, marking the first sales growth in three years, and achieved $442 million in free cash flow, a 56% increase year-over-year.
- The company provided 2026 guidance including anticipated revenue between $5.6 billion and $5.8 billion, adjusted operating margins of 7.5% to 8%, and adjusted EPS in the range of $3.80 to $4.40.
- Brunswick plans to retire no less than $160 million of debt in 2026, contributing to a total of $400 million in debt retirement between 2025 and 2026, and anticipates approximately $50 million in share repurchases for 2026, alongside a slight dividend increase.
- Mercury maintained its market leadership, finishing 2025 with approximately 47% share in the outboard market and achieving 61% overall outboard share at the Fort Lauderdale Show, while the company continues to invest in new products and technology, including 5 new outboard programs.
- Brunswick Corporation reported a 16% increase in sales and a 41% improvement in earnings for Q4 2025, contributing to a 2% full-year net sales growth, the first in three years.
- The company generated $442 million in Free Cash Flow for the full year 2025, a 56% increase year-over-year, and retired approximately $240 million of debt.
- For 2026, Brunswick anticipates revenue between $5.6-$5.8 billion, adjusted EPS in the range of $3.80-$4.40, and free cash flow exceeding $350 million.
- Retail demand stabilized in the second half of 2025, supported by 75 basis points of Fed rate cuts, and Mercury Marine maintained a U.S. retail outboard share of approximately 47%. The company is also accelerating investments in new products and technology, including five new outboard programs.
- Brunswick Corporation finished 2025 with net sales growth for the first time in three years, reaching $5.4 billion, up 2% over the prior year, and reported adjusted earnings per share of $3.27.
- The company generated $442 million in free cash flow for 2025, a 56% increase year-over-year, which was used to repurchase $80 million of shares and retire approximately $240 million of debt.
- For 2026, Brunswick anticipates revenue between $5.6 billion and $5.8 billion, with adjusted EPS in the range of $3.80 to $4.40, representing approximately 25% growth over 2025 at the midpoint.
- Retail demand for boats stabilized in the second half of 2025, and the U.S. Fed cut rates by 75 basis points in late 2025, with further cuts anticipated in 2026, providing a tailwind for the upcoming season.
- The company plans to continue strategic investments in new products and technology, including hiring 60 new Mercury engineers in 2025 and initiating 5 new outboard programs, while also planning to retire at least $160 million of additional debt in 2026.
- Brunswick Corporation reported full-year 2025 net sales of $5.363 billion, a 2% increase from 2024, with adjusted diluted EPS of $3.27, a 28% decrease from 2024, and free cash flow of $442 million, an increase of $158 million compared to 2024.
- For Q4 2025, the company achieved net sales of $1.334 billion, a 16% increase from Q4 2024, and adjusted diluted EPS of $0.58, up from $0.24 in Q4 2024.
- The company provided full-year 2026 guidance, projecting revenue between $5.6 billion and $5.8 billion, diluted EPS between $3.80 and $4.40, an operating margin of 7.5% to 8.0%, and free cash flow of over $350 million.
- Brunswick reduced its total debt by approximately $240 million in 2025, bringing the total debt to $2,102 million, and repurchased $80 million in shares while increasing dividends for the 13th consecutive year.
- For the fourth quarter of 2025, Brunswick Corporation reported consolidated net sales of $1,333.8 million, a 16% increase from the fourth quarter of 2024, with diluted EPS of $0.28 on a GAAP basis and $0.58 on an as adjusted basis.
- The company achieved full-year net sales growth for the first time in three years and generated significantly higher free cash flow, totaling $442 million for the full year 2025.
- Brunswick's 2026 outlook anticipates net sales between $5.6 billion and $5.8 billion and adjusted diluted EPS in the range of $3.80 to $4.40.
- Performance was driven by improved retail conditions, solid boating participation, and outstanding operating execution across the enterprise.
- Mercury Marine demonstrated significant market leadership at the 2026 Düsseldorf Boat Show, accounting for over half of all outboard engines on display and securing two new exclusive five-year supply agreements.
- Brunswick's premium fiberglass brands, including Boston Whaler and Navan, achieved year-over-year unit sales growth, while Sea Ray posted strong large boat sales.
- Collectively, Boston Whaler, Sea Ray, and Navan delivered a 15% revenue increase compared to the 2025 Show, with Sea Ray and Navan also receiving prestigious product awards.
- Mercury Marine, a division of Brunswick Corporation, has entered into a new five-year exclusive supply agreement with Axopar Boats.
- This agreement extends a successful collaboration that has been ongoing for over a decade.
- Under the renewed agreement, Mercury outboards will remain the exclusive power choice for Axopar's expanding fleet.
- Brunswick Corporation increased the maximum aggregate principal amount for its cash tender offer of 5.100% Senior Notes due 2052 from $50,000,000 to $100,000,000.
- As of the November 25, 2025 Early Tender Deadline, $111,327,000 aggregate principal amount of notes were validly tendered, exceeding the increased Tender Cap.
- Due to the oversubscription, Brunswick will accept $100,000,000 aggregate principal amount of notes, applying a proration rate of approximately 90.2%.
- The settlement for accepted notes is expected on December 1, 2025, and no notes tendered after the Early Tender Deadline will be accepted.
- Brunswick Corporation has commenced a cash tender offer to purchase up to $50,000,000 of its 5.100% Senior Notes due 2052.
- The total principal amount outstanding for these notes is $300,000,000.
- The tender offer is set to expire on December 11, 2025, at 5:00 p.m., Eastern Time, with an early tender deadline of November 25, 2025, at 5:00 p.m., Eastern Time.
- Holders who validly tender their notes by the early tender deadline will receive an early tender premium of $50.00 per $1,000 principal amount.
- Brunswick reported Q3 2025 sales of $1.4 billion, an increase of 7% versus the prior year, with adjusted EPS of $0.97. The company generated $111 million in free cash flow during Q3, contributing to a year-to-date total of $355 million, which is a $348 million improvement over the first three quarters of last year.
- The full-year 2025 free cash flow estimate was increased to in excess of $425 million, and the debt reduction target was raised to $200 million for the year. Full-year 2025 guidance for revenue (approximately $5.2 billion), adjusted operating margins (approximately 7%), and adjusted EPS (approximately $3.25) remains unchanged.
- GAAP operating earnings were impacted by a $323 million non-cash intangible asset impairment charge for Navico Group, though the segment still reported 2% sales growth. Brunswick also announced the strategic rationalization of its fiberglass boat manufacturing footprint, consolidating production into existing U.S. facilities by mid-2026, which is expected to generate over $10 million in annual run-rate savings.
Quarterly earnings call transcripts for BRUNSWICK.
Ask Fintool AI Agent
Get instant answers from SEC filings, earnings calls & more