Earnings summaries and quarterly performance for Chubb.
Executive leadership at Chubb.
Board of directors at Chubb.
David H. Sidwell
Director
Frances F. Townsend
Director
Fred Hu
Director
Michael G. Atieh
Director
Michael L. Corbat
Director
Michael P. Connors
Lead Independent Director
Nancy K. Buese
Director
Nelson J. Chai
Director
Olivier Steimer
Director
Robert J. Hugin
Director
Robert W. Scully
Director
Sheila P. Burke
Director
Theodore E. Shasta
Director
Research analysts who have asked questions during Chubb earnings calls.
Brian Meredith
UBS
7 questions for CB
David Motemaden
Evercore ISI
7 questions for CB
C. Gregory Peters
Raymond James
6 questions for CB
Alex Scott
Barclays PLC
5 questions for CB
Meyer Shields
Keefe, Bruyette & Woods
5 questions for CB
Andrew Kligerman
TD Cowen
4 questions for CB
Michael Zaremski
BMO Capital Markets
4 questions for CB
Jian Huang
Morgan Stanley
3 questions for CB
Ryan Tunis
Cantor Fitzgerald
3 questions for CB
Bob Huang
Morgan Stanley
2 questions for CB
Elyse Greenspan
Wells Fargo
2 questions for CB
Matthew Heimermann
Citi
2 questions for CB
Tracy Benguigui
Wolfe Research
2 questions for CB
Vikram Gandhi
HSBC
2 questions for CB
Yaron Kinar
Oppenheimer & Co. Inc.
2 questions for CB
Charles Peters
Raymond James
1 question for CB
Mike Zaremski
BMO Capital Markets
1 question for CB
Robert Cox
The Goldman Sachs Group, Inc.
1 question for CB
Recent press releases and 8-K filings for CB.
- The Board will propose a $4.08 annual per-share dividend, payable in four $1.02 quarterly installments, marking the 33rd consecutive year of increases.
- A $0.97 per-share quarterly dividend was declared, payable on April 6, 2026 to shareholders of record as of March 13, 2026.
- This payment is funded from legal reserves and represents the fourth installment approved at the May 15, 2025 shareholder meeting.
- Total premium revenue reached $56.4 B LTM 9/30/25, up 59% vs. 2020; P&C underwriting income surged to $5.9 B (389% growth) and core operating income to $9.4 B (185% growth)
- Core operating ROE improved to 13.2% and ROTE to 20.1%, approaching medium-term targets of 14%+ ROE and 20%+ ROTE
- Capital returns: share buybacks rose from $1.5 B in 2019 to $3.0 B LTM 9/30/25; dividends increased 24% to $0.97 per share
- Digital transformation aims for ~20% headcount reduction, ~1.5 pts of combined ratio savings, and automation of 85% of underwriting and claims processes within 3–4 years
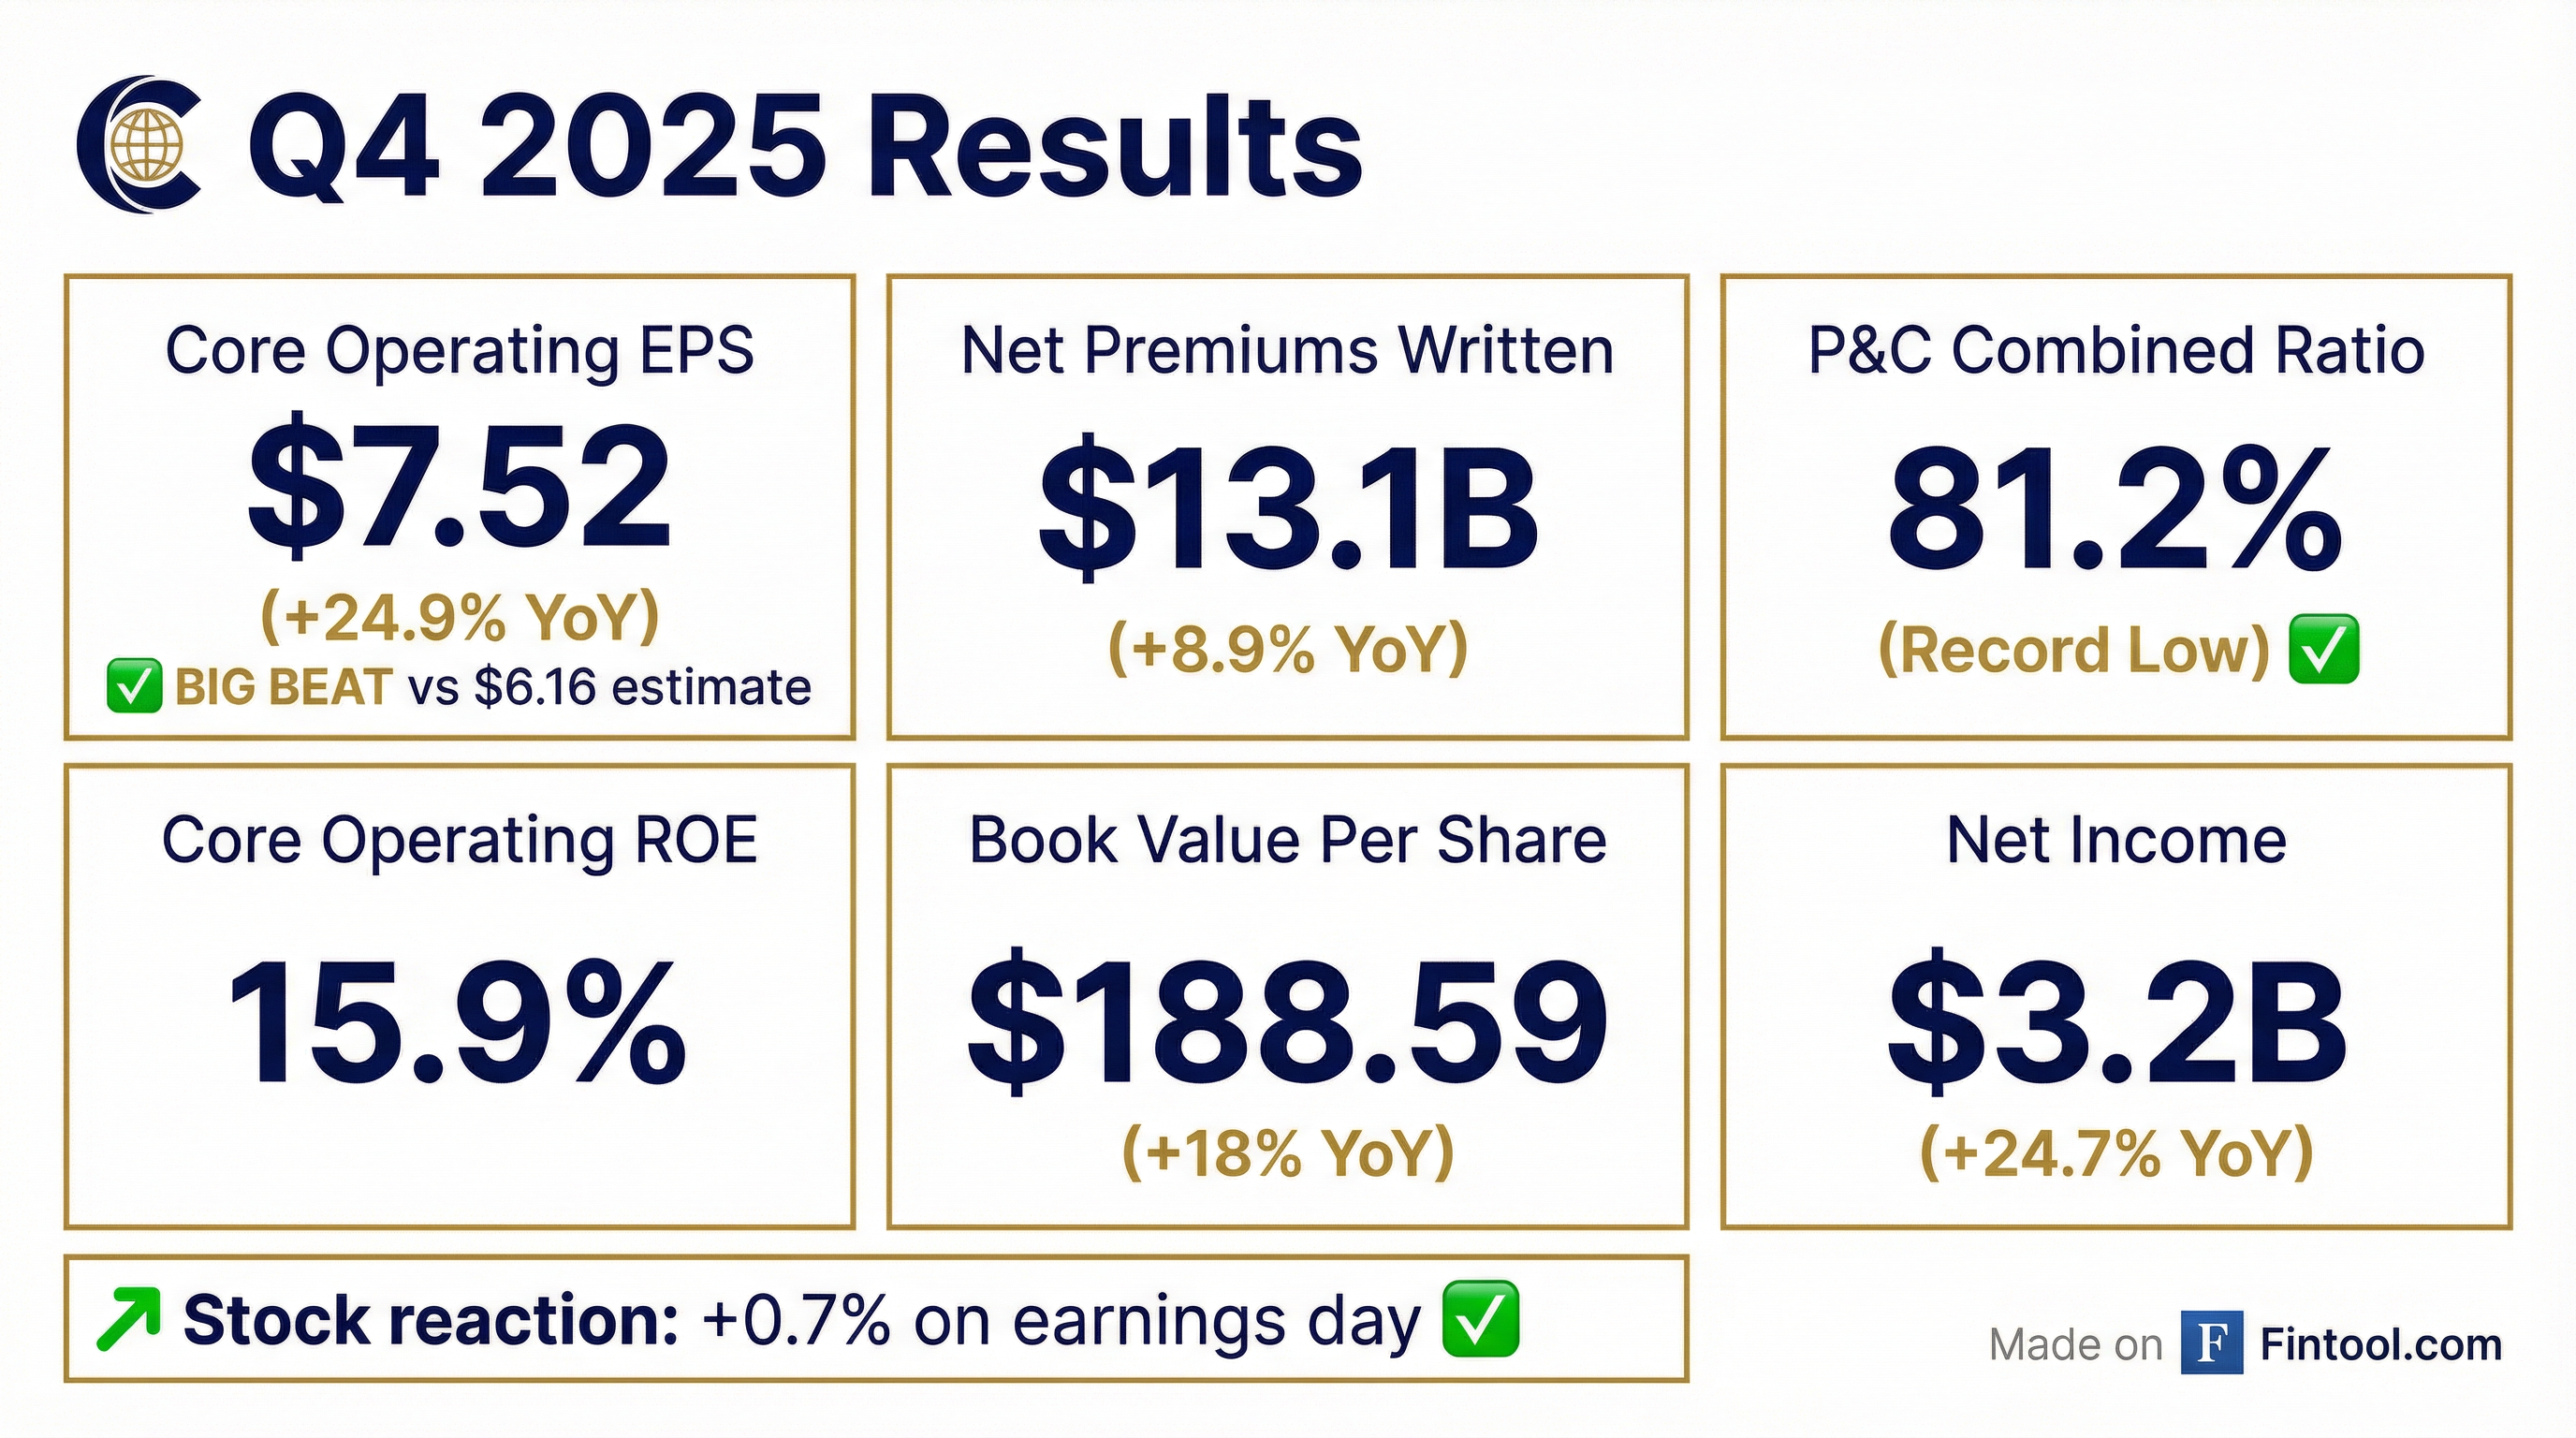
- Core operating income for Q4 was $3 billion or $752 per share, up 22% and 25% year-over-year respectively; full-year 2025 core operating income set a record at $9.9 billion or $24.79 per share, up 9% and 11% respectively.
- P&C underwriting income in Q4 was $2.2 billion, up 40%, with a combined ratio of 81.2%; full-year P&C underwriting income was $6.5 billion with a combined ratio of 85.7%.
- Net premiums grew 9% in Q4 (P&C +7.7%, Life +17%) and 6.5% for the year (P&C +5.5%, Life +15%).
- Adjusted net investment income in Q4 was $1.8 billion (+7.3%), with invested assets of $169 billion at a 5.1% yield; full-year investment income was $6.9 billion (+9%), and Q1 2026 guidance is $1.81–1.84 billion.
- Returned $4.9 billion of capital in 2025 (share repurchases of $3.4 billion at $282.57 average price and $1.5 billion in dividends); core operating tax rate for 2026 is guided at 19.5%–20%.
- Chubb delivered record Q4 core operating income of nearly $3 billion (up ~22%) or $7.52 per share (up 25%), and full-year core operating income of just under $10 billion ($24.79/share, +11%).
- Q4 net premiums grew 9% (P&C +7.7%, life +17%), with a Q4 combined ratio of 81.2% and a full-year combined ratio of 85.7%; full-year net premiums increased 6.5% (P&C +5.5%, life +15%).
- Record Q4 adjusted net investment income was $1.8 billion (+7.3%), with full-year investment income of $6.9 billion (+9%) on a $169 billion invested asset base (vs. $151 billion a year ago).
- Returned $4.9 billion of capital in FY 2025 ($3.4 billion repurchases at $282.57/share; $1.5 billion dividends); expects Q1 2026 adjusted net investment income of $1.81–$1.84 billion and annual effective tax rate of 19.5–20%.
- Q4 core operating ROE was 15.9%, core operating ROTE 23.5%, full-year operating cash flow $13.9 billion, and book value per share (ex-AOCI) grew 11% (tangible book +15.5%).
- Record Q4 and full-year core operating income: Q4 core operating income of nearly $3 billion or $752 per share (up 22% core, 25% EPS); FY core operating income of ~$10 billion or $24.79 per share (up 9% core, 11% EPS)
- P&C underwriting strength: Q4 P&C underwriting income of $2.2 billion (up 40%) with a record low combined ratio of 81.2%; current accident year CR of 80.4% (80.9% excluding agriculture)
- Robust investment performance: Q4 adjusted net investment income of $1.81 billion (up 7.3%); FY NII of $6.9 billion (up 9%); invested assets at $169 billion
- Solid premium growth: Q4 net premiums up 9% (P&C +7.7%, life +17%); FY premiums up 6.5% (P&C +5.5%, life +15%)
- Quarter net income of $3.21 billion (up 24.7%) and core operating income of $2.98 billion (up 21.7%).
- Consolidated Q4 net premiums written of $13.1 billion (up 8.9%) and record P&C combined ratio of 81.2%.
- Full-year 2025 net income of $10.31 billion (up 11.2%), core operating income of $9.95 billion (up 8.9%), and consolidated net premiums written of $54.8 billion (up 6.6%); record P&C combined ratio of 85.7%.
- Annualized return on equity of 17.6% and core operating return on tangible equity of 23.5%.
- Q4 2025 net income of $3.21 billion, up 24.7%, and core operating income of $2.98 billion, up 21.7%
- Q4 consolidated net premiums written of $13.13 billion, up 8.9%; P&C $11.31 billion, up 7.7%; Life $1.83 billion, up 16.9%
- Q4 record P&C combined ratio of 81.2%
- Full-year 2025 record net income of $10.31 billion, up 11.2%, and core operating income of $9.95 billion, up 8.9%
- Full-year consolidated net premiums written of $54.84 billion, up 6.6%; P&C $47.56 billion, up 5.4%; Life $7.28 billion, up 15.1%; record P&C combined ratio of 85.7%
- Q3 2025 core operating income hit $3.0 billion (+29%), driving EPS of $7.49 (+31%); underwriting income was $2.3 billion (+55%) on an 81.8% combined ratio, while adjusted net investment income reached $1.78 billion (+8.3%).
- Total premiums rose 7.5% (consumer +16%, commercial +3.3%), with life insurance premiums up 24.5% and international P&C growth led by Asia (+14%) and Latin America (+10.5%).
- Capital management included $1.6 billion returned to shareholders (dividends $385 million; buybacks $1.2 billion) and issuance of $2.2 billion of debt at 4% average cost and 12-year term.
- Guidance and outlook: core operating ROE was 24.5% in Q3; Q4 adjusted net investment income is expected at $1.775–1.81 billion, full-year core tax rate at 19.5–20%, and medium-term target core operating ROE of 14+%.
- Chubb generated $2.80 billion of net income (up 20.5%), or $6.99 per share, and $3.00 billion of core operating income (up 28.7%), or $7.49 per share for Q3 2025.
- Consolidated net premiums written were $14.9 billion (up 7.5%), including $12.93 billion of P&C (up 5.3%) and $1.93 billion of life insurance (up 24.6%).
- P&C underwriting income reached a record $2.26 billion (up 55.0%) with a combined ratio of 81.8%, and current accident year underwriting income ex-catastrophe was $2.18 billion (up 10.3%) with a combined ratio of 82.5%.
- Book value per share rose 4.7% to $182.22, and tangible book value per share increased 6.6% to $120.13 from June 30, 2025.
- Total capital returned to shareholders was $1.62 billion, including $1.23 billion in share repurchases (average price $277.67) and $385 million in dividends.
- Net income per share of $6.99, up 22.6% year-over-year.
- Core operating EPS of $7.49, up 30.9% year-over-year.
- Consolidated net premiums written of $14.9 billion, up 7.5%.
- Record P&C combined ratio of 81.8%, down from 87.7% a year ago.


Quarterly earnings call transcripts for Chubb.
Ask Fintool AI Agent
Get instant answers from SEC filings, earnings calls & more