FIRST FINANCIAL BANCORP /OH/ (FFBC)·Q4 2025 Earnings Summary
First Financial Bancorp Posts Record Adjusted EPS on M&A Momentum
January 29, 2026 · by Fintool AI Agent
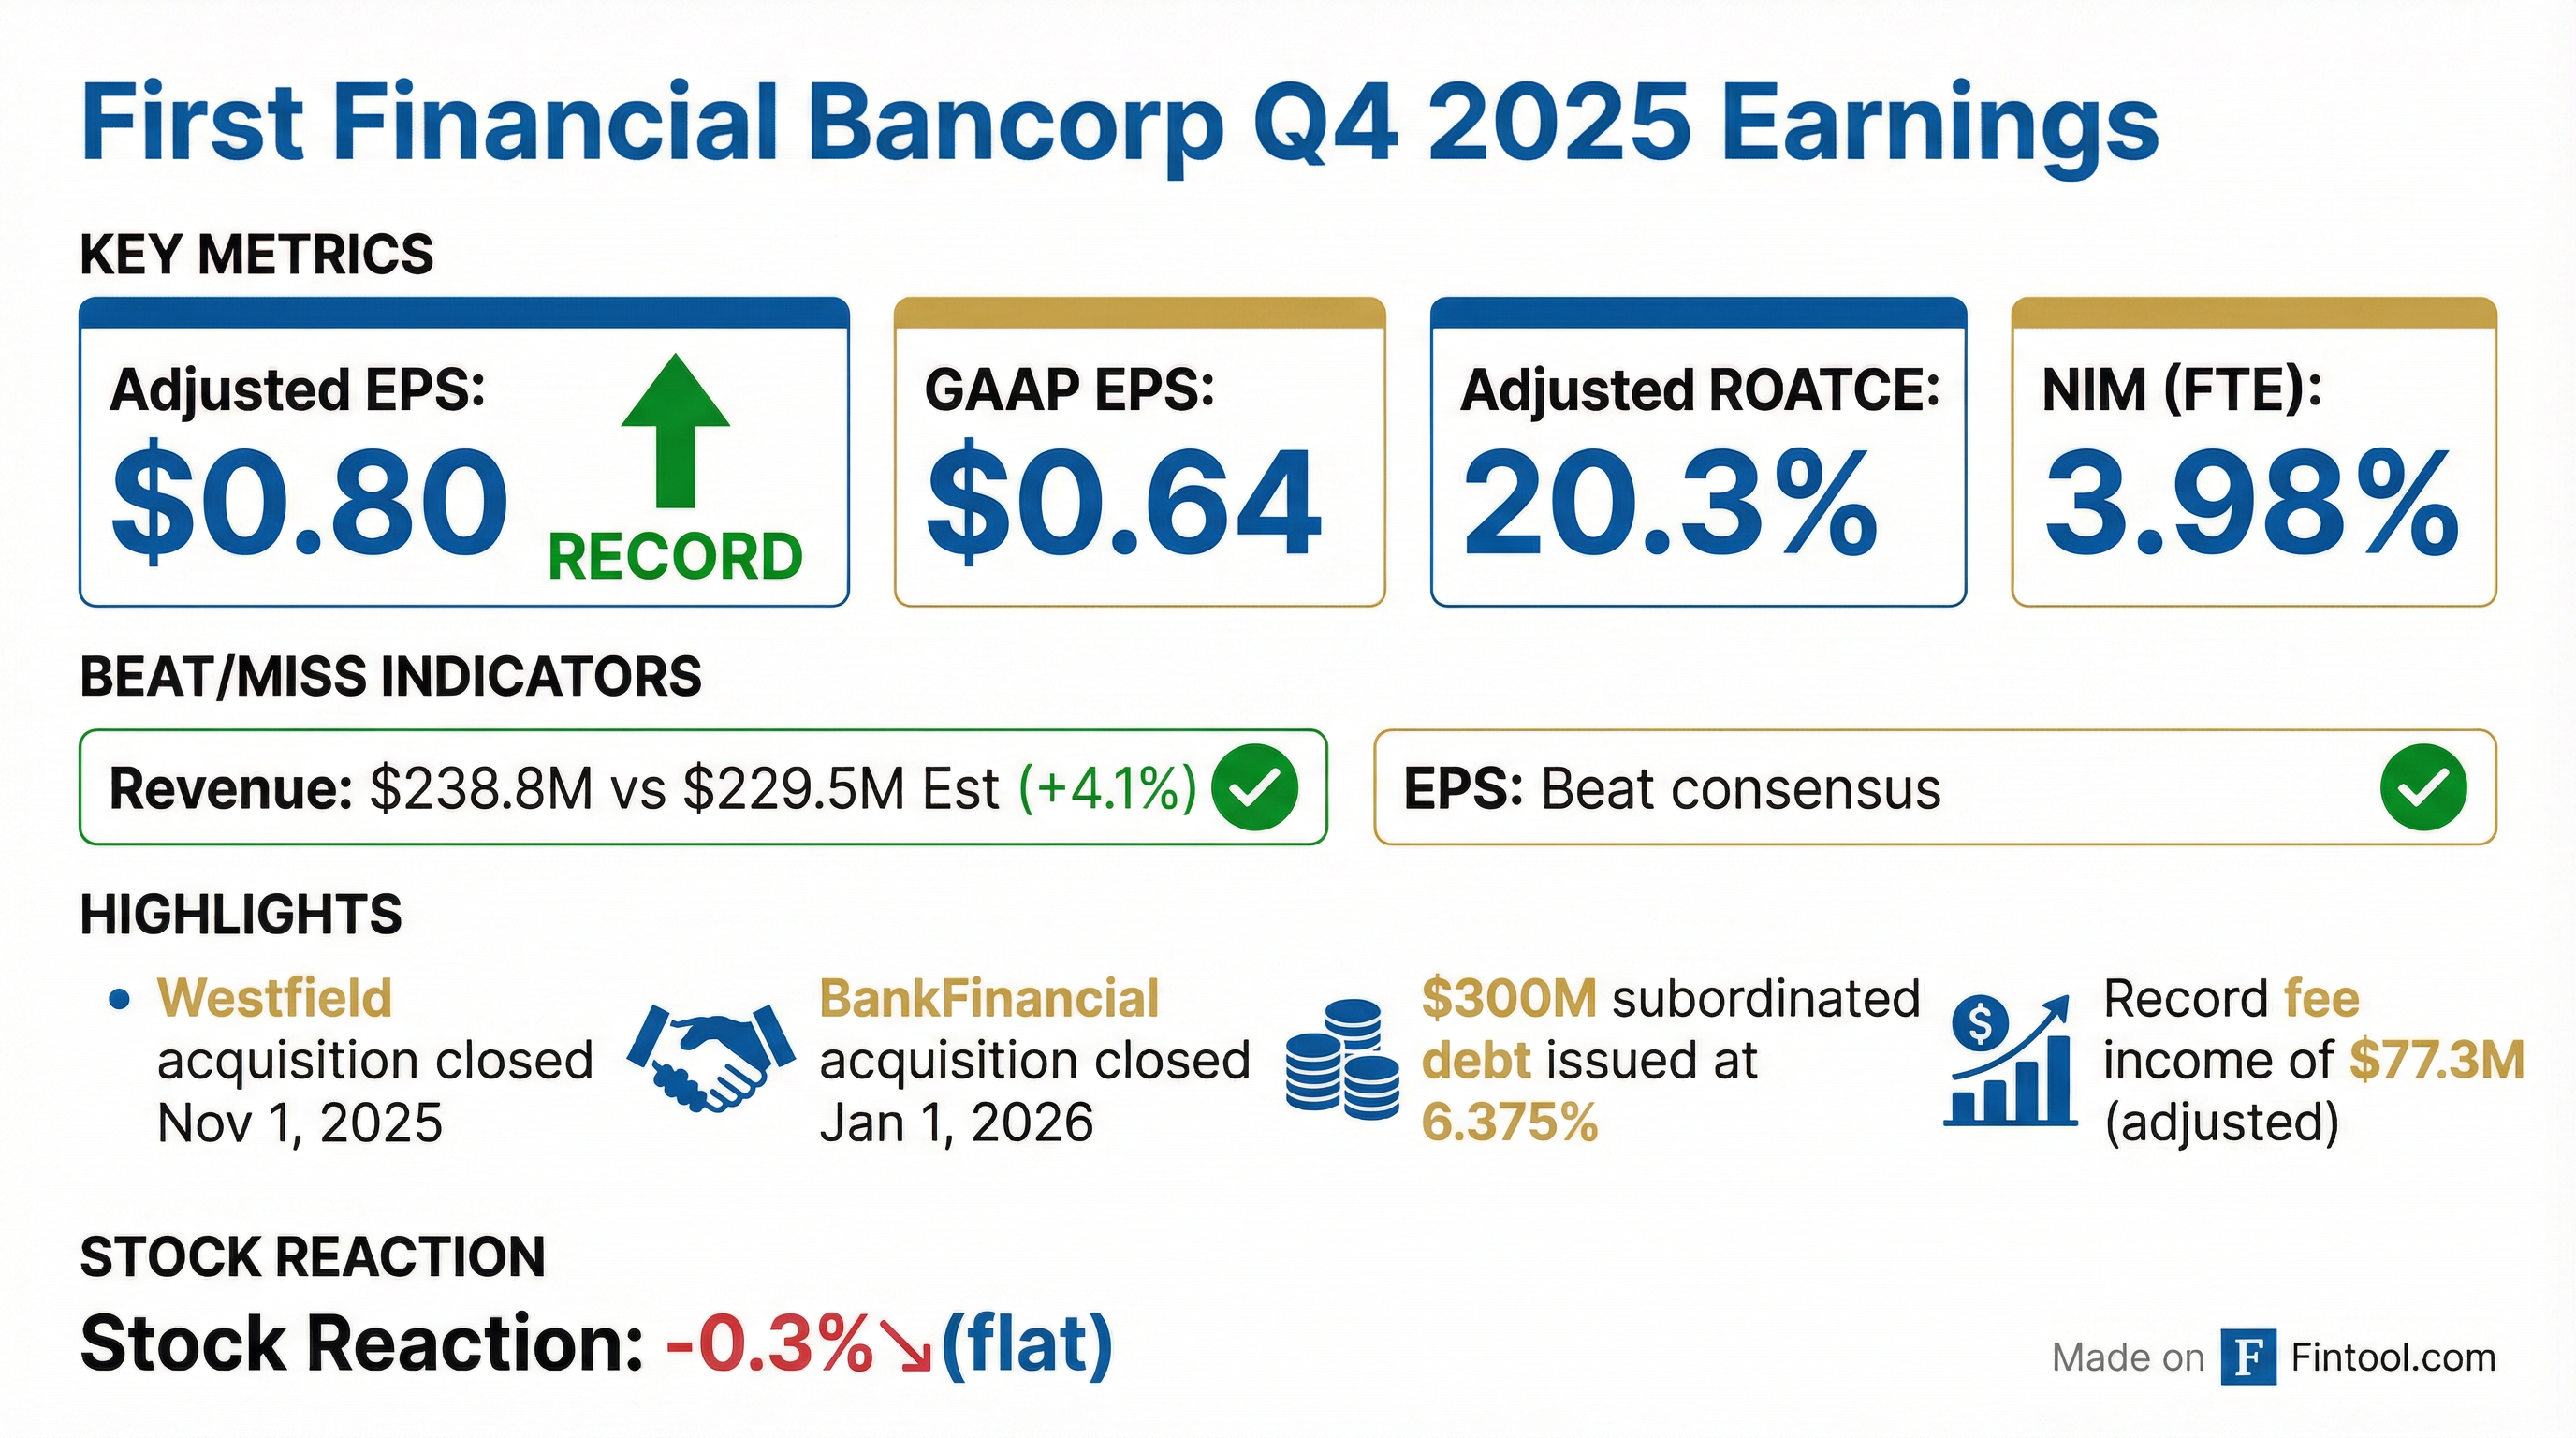
First Financial Bancorp (NASDAQ: FFBC) delivered record quarterly results driven by successful M&A execution and strong fee income growth. Adjusted EPS of $0.80 marked a company record, while two strategic acquisitions position the Cincinnati-based bank for continued expansion across the Midwest.
Did First Financial Beat Earnings?
Yes — on both revenue and EPS.
The GAAP vs. adjusted gap reflects $12.6 million in securities losses, $5.7 million in acquisition-related expenses, and $2.0 million in other one-time items. Management emphasized the adjusted results as more reflective of underlying performance.
Key profitability metrics (adjusted basis):
- Return on assets: 1.52%
- Return on tangible common equity: 20.3%
- Pre-tax, pre-provision ROA: 2.14%
- Efficiency ratio: 56.5%
What Were the Quarter's Key Highlights?
M&A Momentum
Two transformative deals closed within two months:
-
Westfield Bank (closed Nov 1, 2025): $2.1B assets, $1.6B loans, $1.8B deposits. Adds commercial banking, premium finance, and RIA banking capabilities in Ohio.
-
BankFinancial (closed Jan 1, 2026): $1.4B assets with 17 branches in Chicago MSA. Brings strong multifamily lending expertise and low-cost deposit franchise.
The bank also issued $300 million of 6.375% subordinated debt to support capital levels post-acquisition.
Record Fee Income
Adjusted noninterest income hit $77.3 million — a company record.
Foreign exchange and wealth management both set quarterly records.
How Is the Net Interest Margin Holding Up?
NIM (FTE) of 3.98% declined just 4 bps from Q3 despite Fed rate cuts:
Management highlighted "diligent management of deposit costs" as key to margin resilience. Cost of deposits fell to 2.50% from 2.71% sequentially.
Guidance: NIM expected at 3.94%-3.99% in Q1 2026, assuming a 25 bp March rate cut.
What About Credit Quality?
Credit metrics remained stable with modest provision expense:
The increase in nonperforming assets was driven by three specific loans moving to nonaccrual. Classified assets actually declined to 1.11% of assets.
Initial ACL on Westfield: $25.9 million combined reserve build related to the acquisition ($23.7M for loans, $2.2M for unfunded commitments).
How Did the Stock React?
Muted reaction: -0.3% on earnings day.
The stock opened at $27.33 and closed at $27.20, essentially flat despite the record results. This suggests the strong quarter was largely expected given prior positive commentary on M&A integration.
Year-to-date, FFBC is up 7.5% from its December 2025 close of $25.02. The stock trades at roughly 1.7x tangible book value ($15.74 TBV per share).
What Did Management Guide?
Q1 2026 Outlook:
The expense guidance includes ~$11M from Westfield and ~$10M from BankFinancial, reflecting the full-quarter impact of both acquisitions.
Loan balances expected to grow low single digits annualized (excluding BankFinancial), with core deposits modestly declining due to seasonal outflows.
Full-Year 2026 Outlook:
Management assumes two rate cuts — one in March, one in June. If no cuts occur, NIM stays flat at the higher Q1 level.
What's the Capital Position?
Capital ratios remain strong post-Westfield:
The CET1 decline reflects Westfield's impact on risk-weighted assets. The $300M sub-debt issuance boosted total capital. Management noted internal stress testing shows capital above regulatory minimums in all scenarios.
Capital deployment:
- Common dividend: $0.25/share (unchanged)
- No share repurchases planned near-term
- Dividend yield: ~4.0% annualized
Full Year 2025 Performance
2025 marked another strong year:
CEO Archie Brown highlighted: "We successfully launched our Western Michigan banking office in Grand Rapids, and acquired two banking companies which strengthens our core funding and provides us with a platform for growth in two of the largest metropolitan markets in the Midwest."
What Were the Q&A Highlights?
Analysts from Raymond James, Hovde Group, Stephens, KBW, and Truist Securities participated. Key themes:
Loan Growth Dynamics
Q4 saw record payoffs — up 56% from Q3 — which offset strong originations.
"We had an incredible origination quarter in Q4. It was our best quarter by a lot in 2025... But what we also saw in Q4 was a record level of payoff activity." — CEO Archie Brown
Payoff pressure expected to ease in Q1, with loan growth ramping through the year. The 6%-8% full-year guidance is organic (excluding BankFinancial).
Fee Income Trajectory
Q1 fee guidance of $71-73M reflects seasonal softness, but back-half run rate expected at $75-80M.
- Foreign exchange: Non-solicits for recently hired teams burn off after Q1, creating more opportunity. Business has grown ~14-15% CAGR since 2019 acquisition; expecting low double-digit growth ahead.
- Summit Leasing: Growth moderating from 10-15% to high single digits as portfolio seasons (4-5 year lease terms now rolling). Mix shifting more toward finance leases vs. operating leases.
Expense & Efficiency Outlook
Conversion timeline provides cost savings visibility:
Efficiency ratio expected in mid-50s (55-56%) by back half of year. Summit's operating lease accounting skews efficiency ratio higher by ~200 bps.
Chicago & Michigan Expansion
Chicago (BankFinancial): Adding mortgage bankers, wealth/private bankers, and commercial banking talent. Retraining retail centers to originate HELOCs. Selling $450M of $700M acquired multifamily loans, keeping $200-250M.
Grand Rapids: Team has ~$100M loan commitments, $20-30M deposits after first year. Planning full banking office, adding wealth advisors and mortgage.
"We think there's more opportunities in Michigan, especially with some of the larger M&A that's going on with some of the banks." — CEO Archie Brown
Balance Sheet Management
Securities portfolio may temporarily rise to ~$5B (~23% of assets vs. target 20%) due to BankFinancial liquidity inflows. Will draw down as loans grow — roughly half of loan growth funded from securities runoff.
Key Takeaways
-
Record results: Adjusted EPS of $0.80 and fee income of $77.3M both set company records
-
M&A execution: Two deals totaling $3.5B in assets closed within 60 days, expanding into Chicago and strengthening Ohio presence
-
Margin resilience: NIM held at 3.98% despite rate cuts, aided by disciplined deposit pricing
-
Credit stable: 1.39% reserve coverage with manageable charge-offs; no systemic concerns
-
Capital deployed: Sub-debt issuance supports growth; dividend maintained at $0.25
Related: