GULFPORT ENERGY (GPOR)·Q4 2025 Earnings Summary
Gulfport Energy Beats on All Fronts, Plans >40% Free Cash Flow Growth in 2026
February 24, 2026 · by Fintool AI Agent
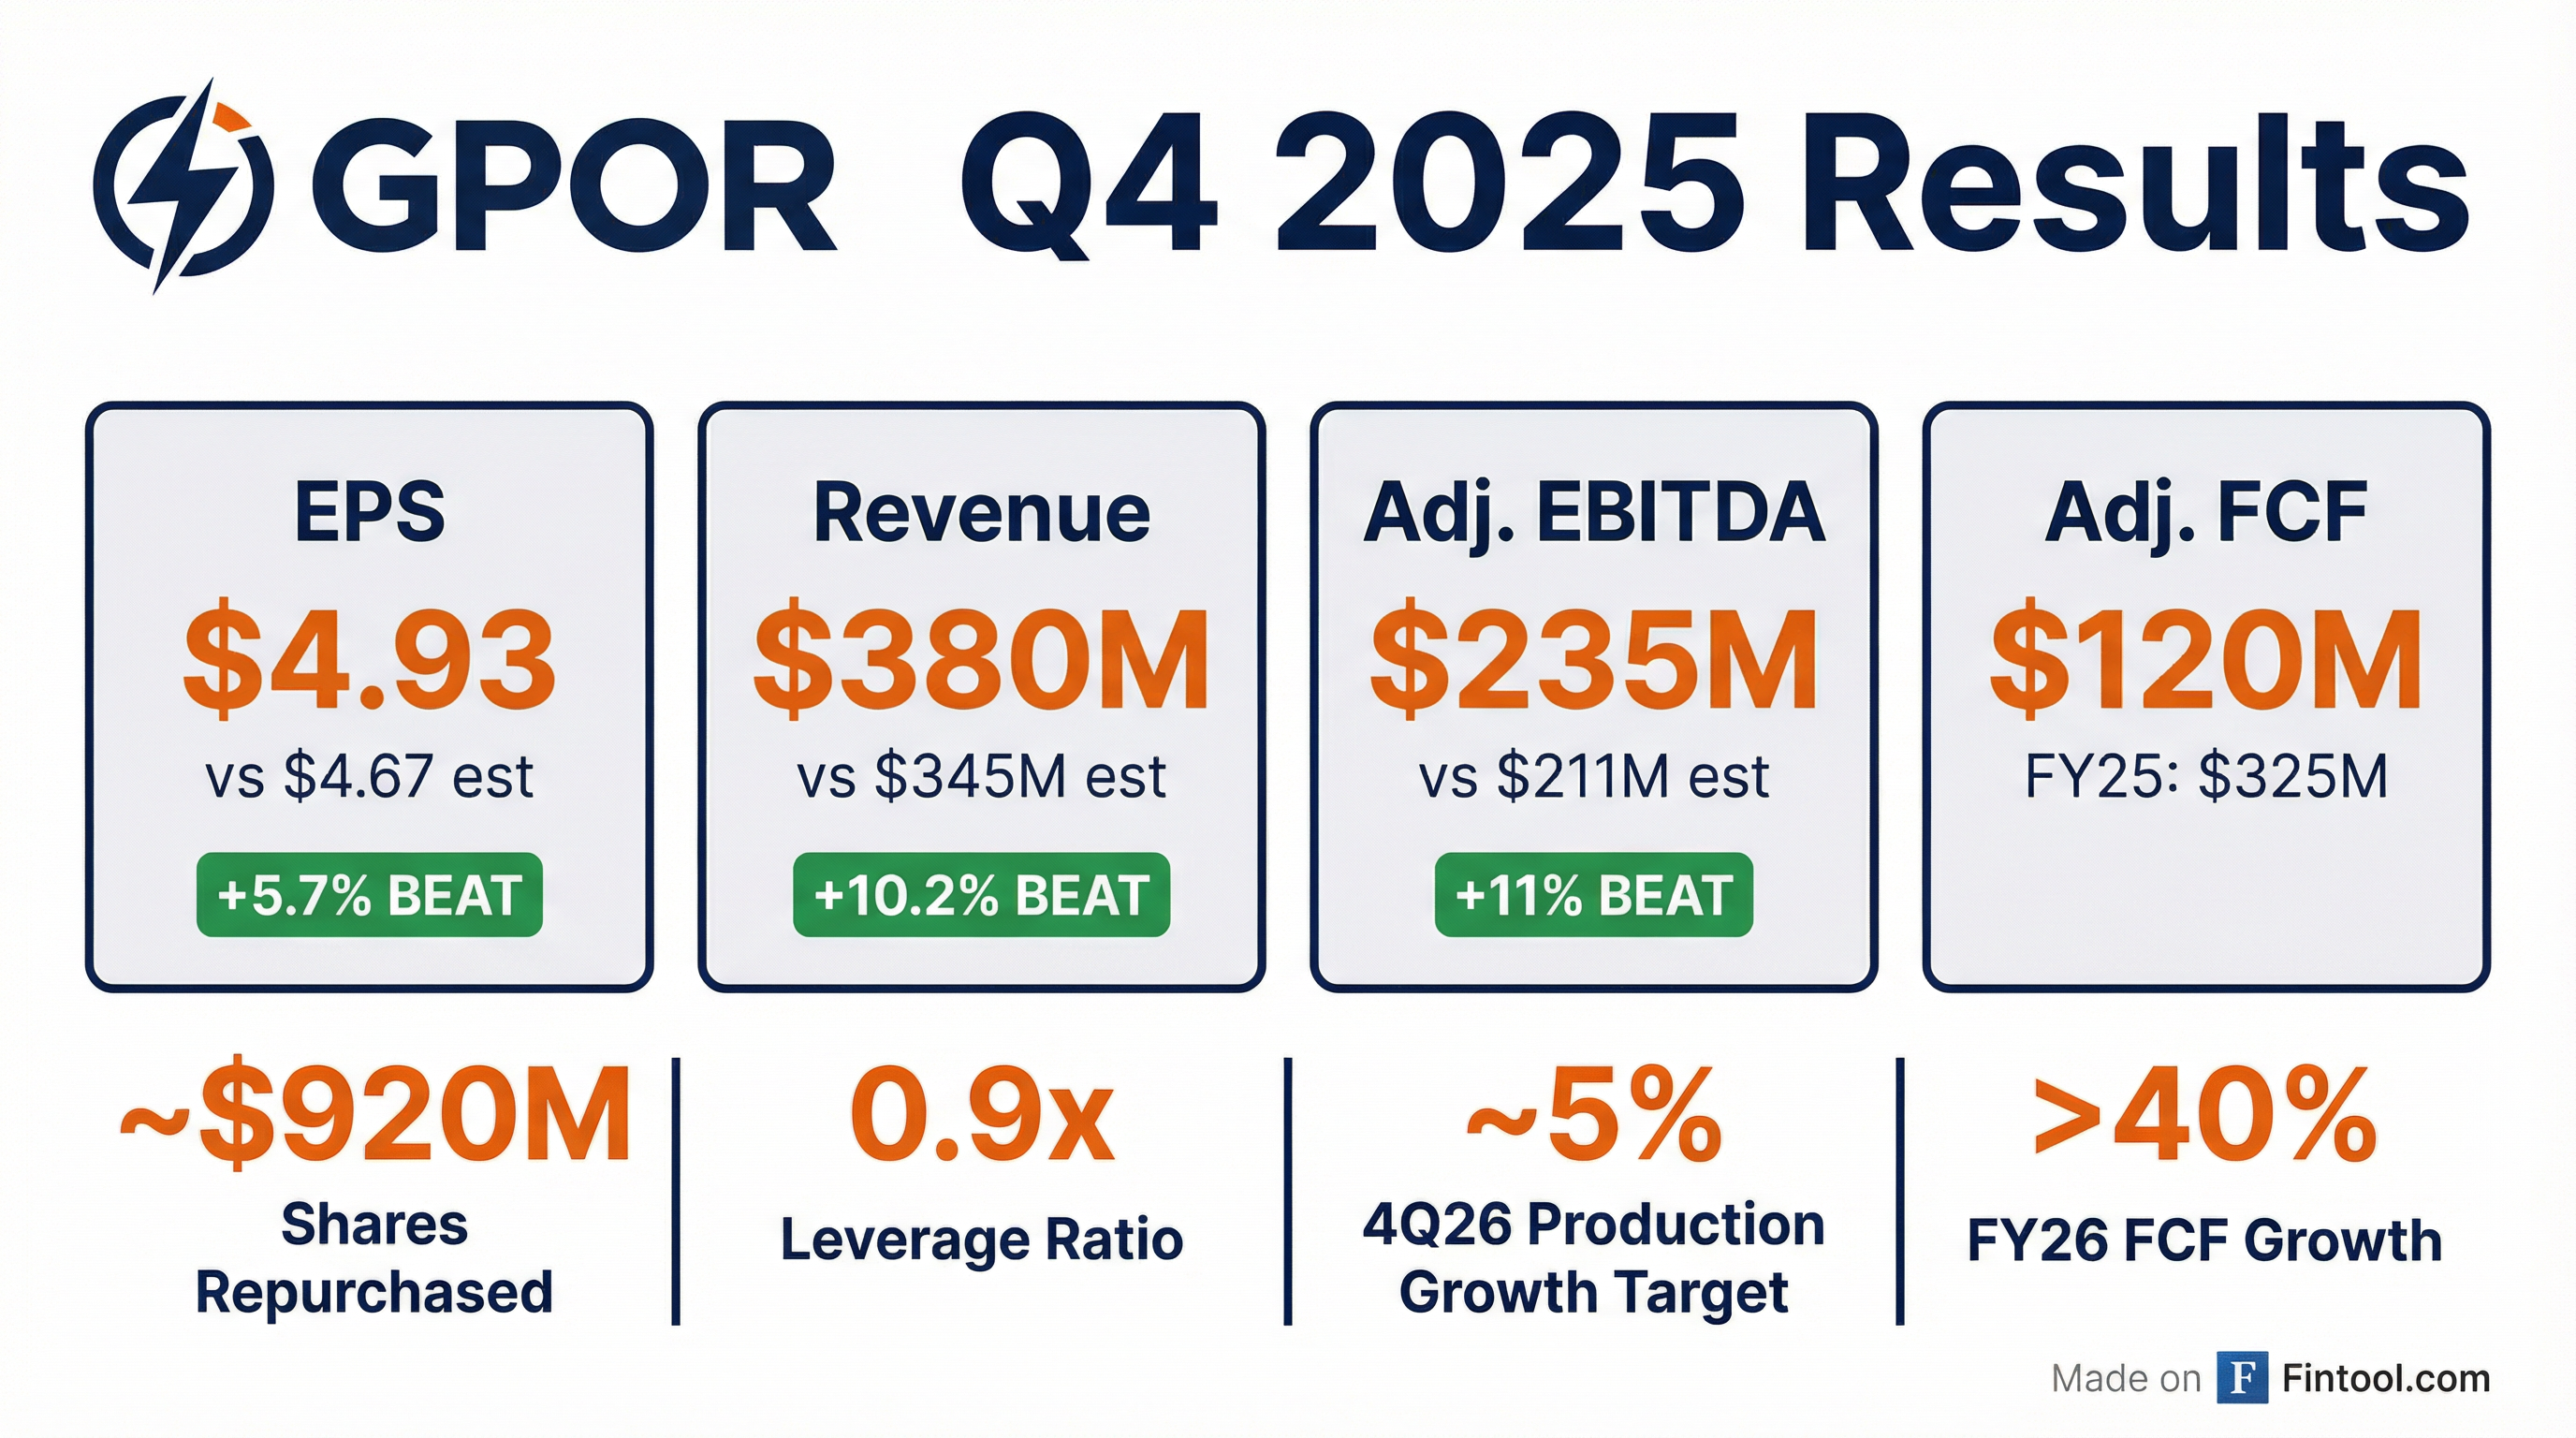
Gulfport Energy (GPOR) delivered a clean beat across the board in Q4 2025, reporting EPS of $4.93 vs. consensus of $4.67 (+5.7%) and revenue of $380M vs. $345M expected (+10.2%). Adjusted EBITDA of $235M exceeded estimates by 11%. The real story is the 2026 outlook: management expects adjusted free cash flow to grow more than 40% year-over-year, supported by improving natural gas prices and continued capital discipline.
Did Gulfport Beat Earnings?
Gulfport delivered beats on all key financial metrics in Q4 2025:
*Values retrieved from S&P Global
This marks the sixth consecutive quarter of EPS beats for Gulfport, with only two quarters of revenue misses in the past eight—both tied to commodity price volatility rather than operational issues.
Full year 2025 results were equally strong:
- Adjusted EBITDA: $879M (vs. $731M in FY 2024, +20% YoY)
- Net Income: $428M (vs. -$261M loss in FY 2024)
- Adjusted Free Cash Flow: $325M (vs. $257M in FY 2024, +26% YoY)
Production by Asset Area (Q4 2025):
What Did Management Guide?
Gulfport provided robust FY 2026 guidance that implies meaningful growth:
Key guidance assumptions at strip pricing ($3.86 gas, $64.19 oil as of 2/19/26) :
- Natural Gas Differential: ($0.15)-($0.30) off NYMEX
- Oil Differential: ($6.00)-($7.00) off WTI
- Cash Costs: $1.35-$1.48/Mcfe (LOE + GP&T + taxes + G&A)
Management noted production will be impacted by known simops/midstream downtime and Winter Storm Fern in early 2026, with volumes expected to strengthen in 2H2026 as new wells come online.
How Did the Stock React?
GPOR shares closed at $196.38 on February 24, 2026, down 1.2% on the day. The stock is trading:
- -1.8% below its 50-day moving average ($198.03)
- +3.6% above its 200-day moving average ($189.63)
- -13.0% below its 52-week high of $225.78
Year-to-date, GPOR has been range-bound as natural gas prices remain volatile. The stock briefly touched $225 in early 2026 as Henry Hub approached $4.00/MMBtu but has pulled back as gas prices softened.
What Changed From Last Quarter?
Improved:
- Free cash flow trajectory: >40% FCF growth guidance for 2026 is a step-up from the ~26% growth achieved in 2025
- Inventory depth: Gross undeveloped inventory now exceeds 700 locations, up >40% since year-end 2022
- Leverage: Net debt/EBITDA improved to ~0.9x from 0.97x at year-end 2024
- Share count reduction: Retired ~7.4M shares cumulative at avg. $125.19/share
Watch Items:
- Near-term production headwinds: Q1 2026 impacted by simops, midstream downtime, and winter storm
- Lower D&C capital: $365-390M in 2026 vs. $474M in 2025, though efficiency gains offset volume impact
Capital Allocation: A Shareholder-First Approach
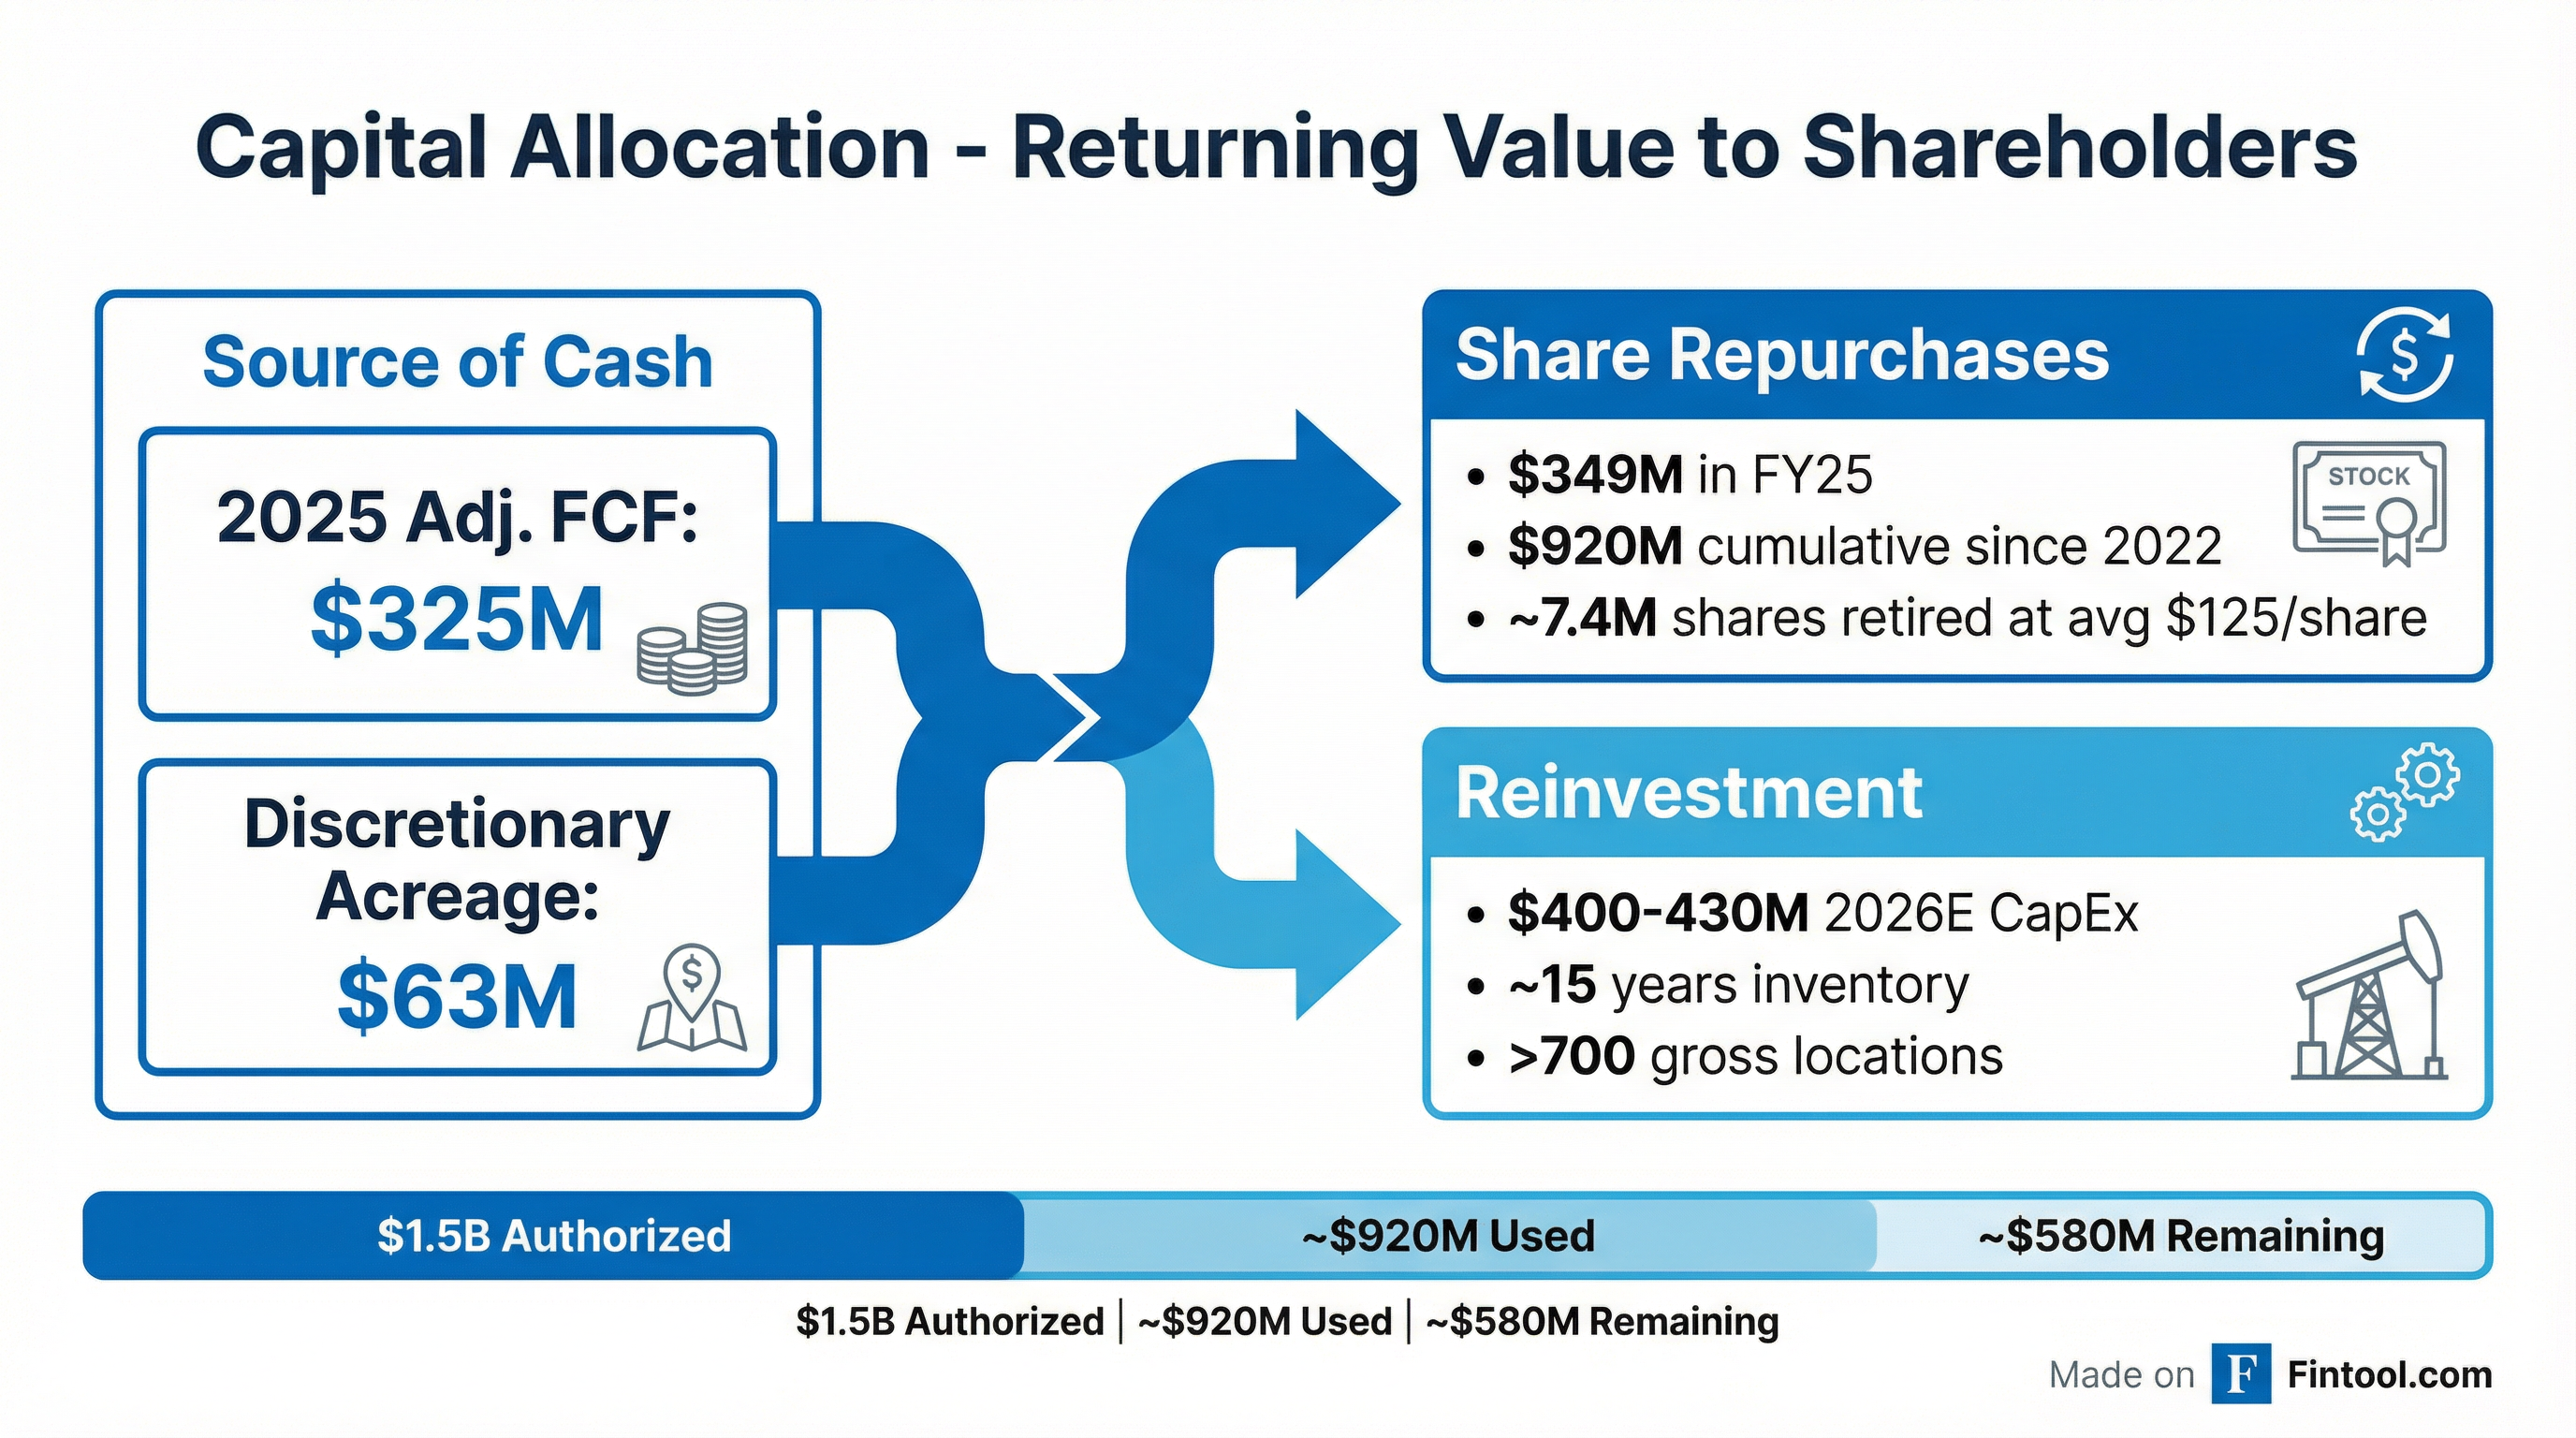
Gulfport has returned virtually all free cash flow to shareholders over the past three years:
Management plans to repurchase >$140M of common stock in Q1 2026 alone, funded by adjusted free cash flow and revolver capacity while maintaining leverage at approximately 1.0x or below.
Remaining buyback capacity: ~$580M of the $1.5B authorization remains available.
Inventory and Development Outlook
Gulfport's inventory expansion story continues to differentiate the company:
Current Inventory Position:
- >700 gross locations across Utica, Marcellus, and SCOOP
- ~15 years of net inventory at attractive rates of return
- Break-evens below $2.50/MMBtu across the portfolio
2026 Development Plan:
Management highlighted continued expansion through:
- Discretionary acreage acquisitions: Targeting $100M cumulative by end of Q1 2026 ($62.9M deployed through YE25)
- Marcellus delineation: Ohio resource viability expanded north, increasing Marcellus inventory by ~200%
- U-development validation: Unlocked ~1 year of dry gas inventory on previously subeconomic acreage
Hedging Position
Gulfport maintains a meaningful hedge book to protect cash flows:
Natural Gas (2026):
- Swaps: ~346,000 MMBtu/d at $3.81/MMBtu
- Collars: ~155,000 MMBtu/d with $3.63 floor / $4.37 ceiling
Natural Gas (2027):
- Swaps: 210,000 MMBtu/d at $3.93/MMBtu
- Collars: 110,000 MMBtu/d with $3.75 floor / $4.27 ceiling
The hedge position provides downside protection while preserving upside exposure to improving gas fundamentals from LNG expansion and data center power demand.
Proved Reserves and PV-10
Gulfport reported year-end 2025 proved reserves of 4.3 Tcfe, up 7% year-over-year:
Reserve composition: 3.6 Tcf natural gas, 23.9 MMBbl oil, 82.8 MMBbl NGLs.
Pricing assumptions: PV-10 calculated using SEC pricing of $3.39/MMBtu Henry Hub and $66.01/bbl WTI (12-month averages).
The 7% reserve increase was driven by extensions and discoveries (+701 Bcfe), partially offset by production (-379 Bcfe) and minor revisions (-38 Bcfe).
Balance Sheet Strength
Gulfport's financial position remains solid:
Risks to Watch
- Natural gas price volatility: Despite hedges, >85% gas weighting means earnings are sensitive to Henry Hub
- Near-term production headwinds: Q1 2026 impacted by simops, midstream downtime, winter storm
- Appalachian basis differentials: In-basin exposure of 30-40% subject to regional pricing
- Concentrated asset base: Utica represents ~73% of proved reserves
Forward Catalysts
- Q1 2026 buyback execution: Management targets >$140M of repurchases
- Marcellus North delineation: First development wells in northern Belmont County in 2026
- Natural gas price trajectory: LNG demand growth and data center power needs could tighten supply
- Potential M&A: Growing Appalachian consolidation trend
The Bottom Line
Gulfport delivered a clean Q4 with beats across all key metrics. The real signal is the 2026 outlook: >40% free cash flow growth, continued aggressive share repurchases, and 5% production growth by year-end. At ~4.8x EV/EBITDA with a top-decile free cash flow yield among natural gas peers , the valuation remains compelling for a disciplined capital allocator with 15 years of sub-$2.50 breakeven inventory.
Related Documents: