Earnings summaries and quarterly performance for HARTFORD INSURANCE GROUP.
Executive leadership at HARTFORD INSURANCE GROUP.
Board of directors at HARTFORD INSURANCE GROUP.
Annette Rippert
Director
Carlos Dominguez
Director
Donna James
Director
Kathleen Winters
Director
Larry De Shon
Director
Matthew Winter
Director
Teresa Roseborough
Director
Thomas Bartlett
Director
Trevor Fetter
Lead Independent Director
Virginia Ruesterholz
Director
Research analysts who have asked questions during HARTFORD INSURANCE GROUP earnings calls.
Andrew Kligerman
TD Cowen
8 questions for HIG
Brian Meredith
UBS
8 questions for HIG
Elyse Greenspan
Wells Fargo
8 questions for HIG
David Motemaden
Evercore ISI
6 questions for HIG
Mike Zaremski
BMO Capital Markets
4 questions for HIG
Rob Cox
Goldman Sachs
4 questions for HIG
Alex Scott
Barclays PLC
3 questions for HIG
C. Gregory Peters
Raymond James
3 questions for HIG
Jian Huang
Morgan Stanley
3 questions for HIG
Joshua Shanker
Bank of America Merrill Lynch
3 questions for HIG
Michael Zaremski
BMO Capital Markets
3 questions for HIG
Ryan Tunis
Cantor Fitzgerald
3 questions for HIG
Charles Peters
Raymond James
2 questions for HIG
Gregory Peters
Raymond James Financial, Inc.
2 questions for HIG
Katie Sakys
Autonomous Research
2 questions for HIG
Meyer Shields
Keefe, Bruyette & Woods
2 questions for HIG
Robert Cox
The Goldman Sachs Group, Inc.
2 questions for HIG
Taylor Scott
BofA Securities
2 questions for HIG
Yaron Kinar
Oppenheimer & Co. Inc.
2 questions for HIG
Paul Newsome
Piper Sandler Companies
1 question for HIG
Wesley Carmichael
Autonomous Research
1 question for HIG
Recent press releases and 8-K filings for HIG.
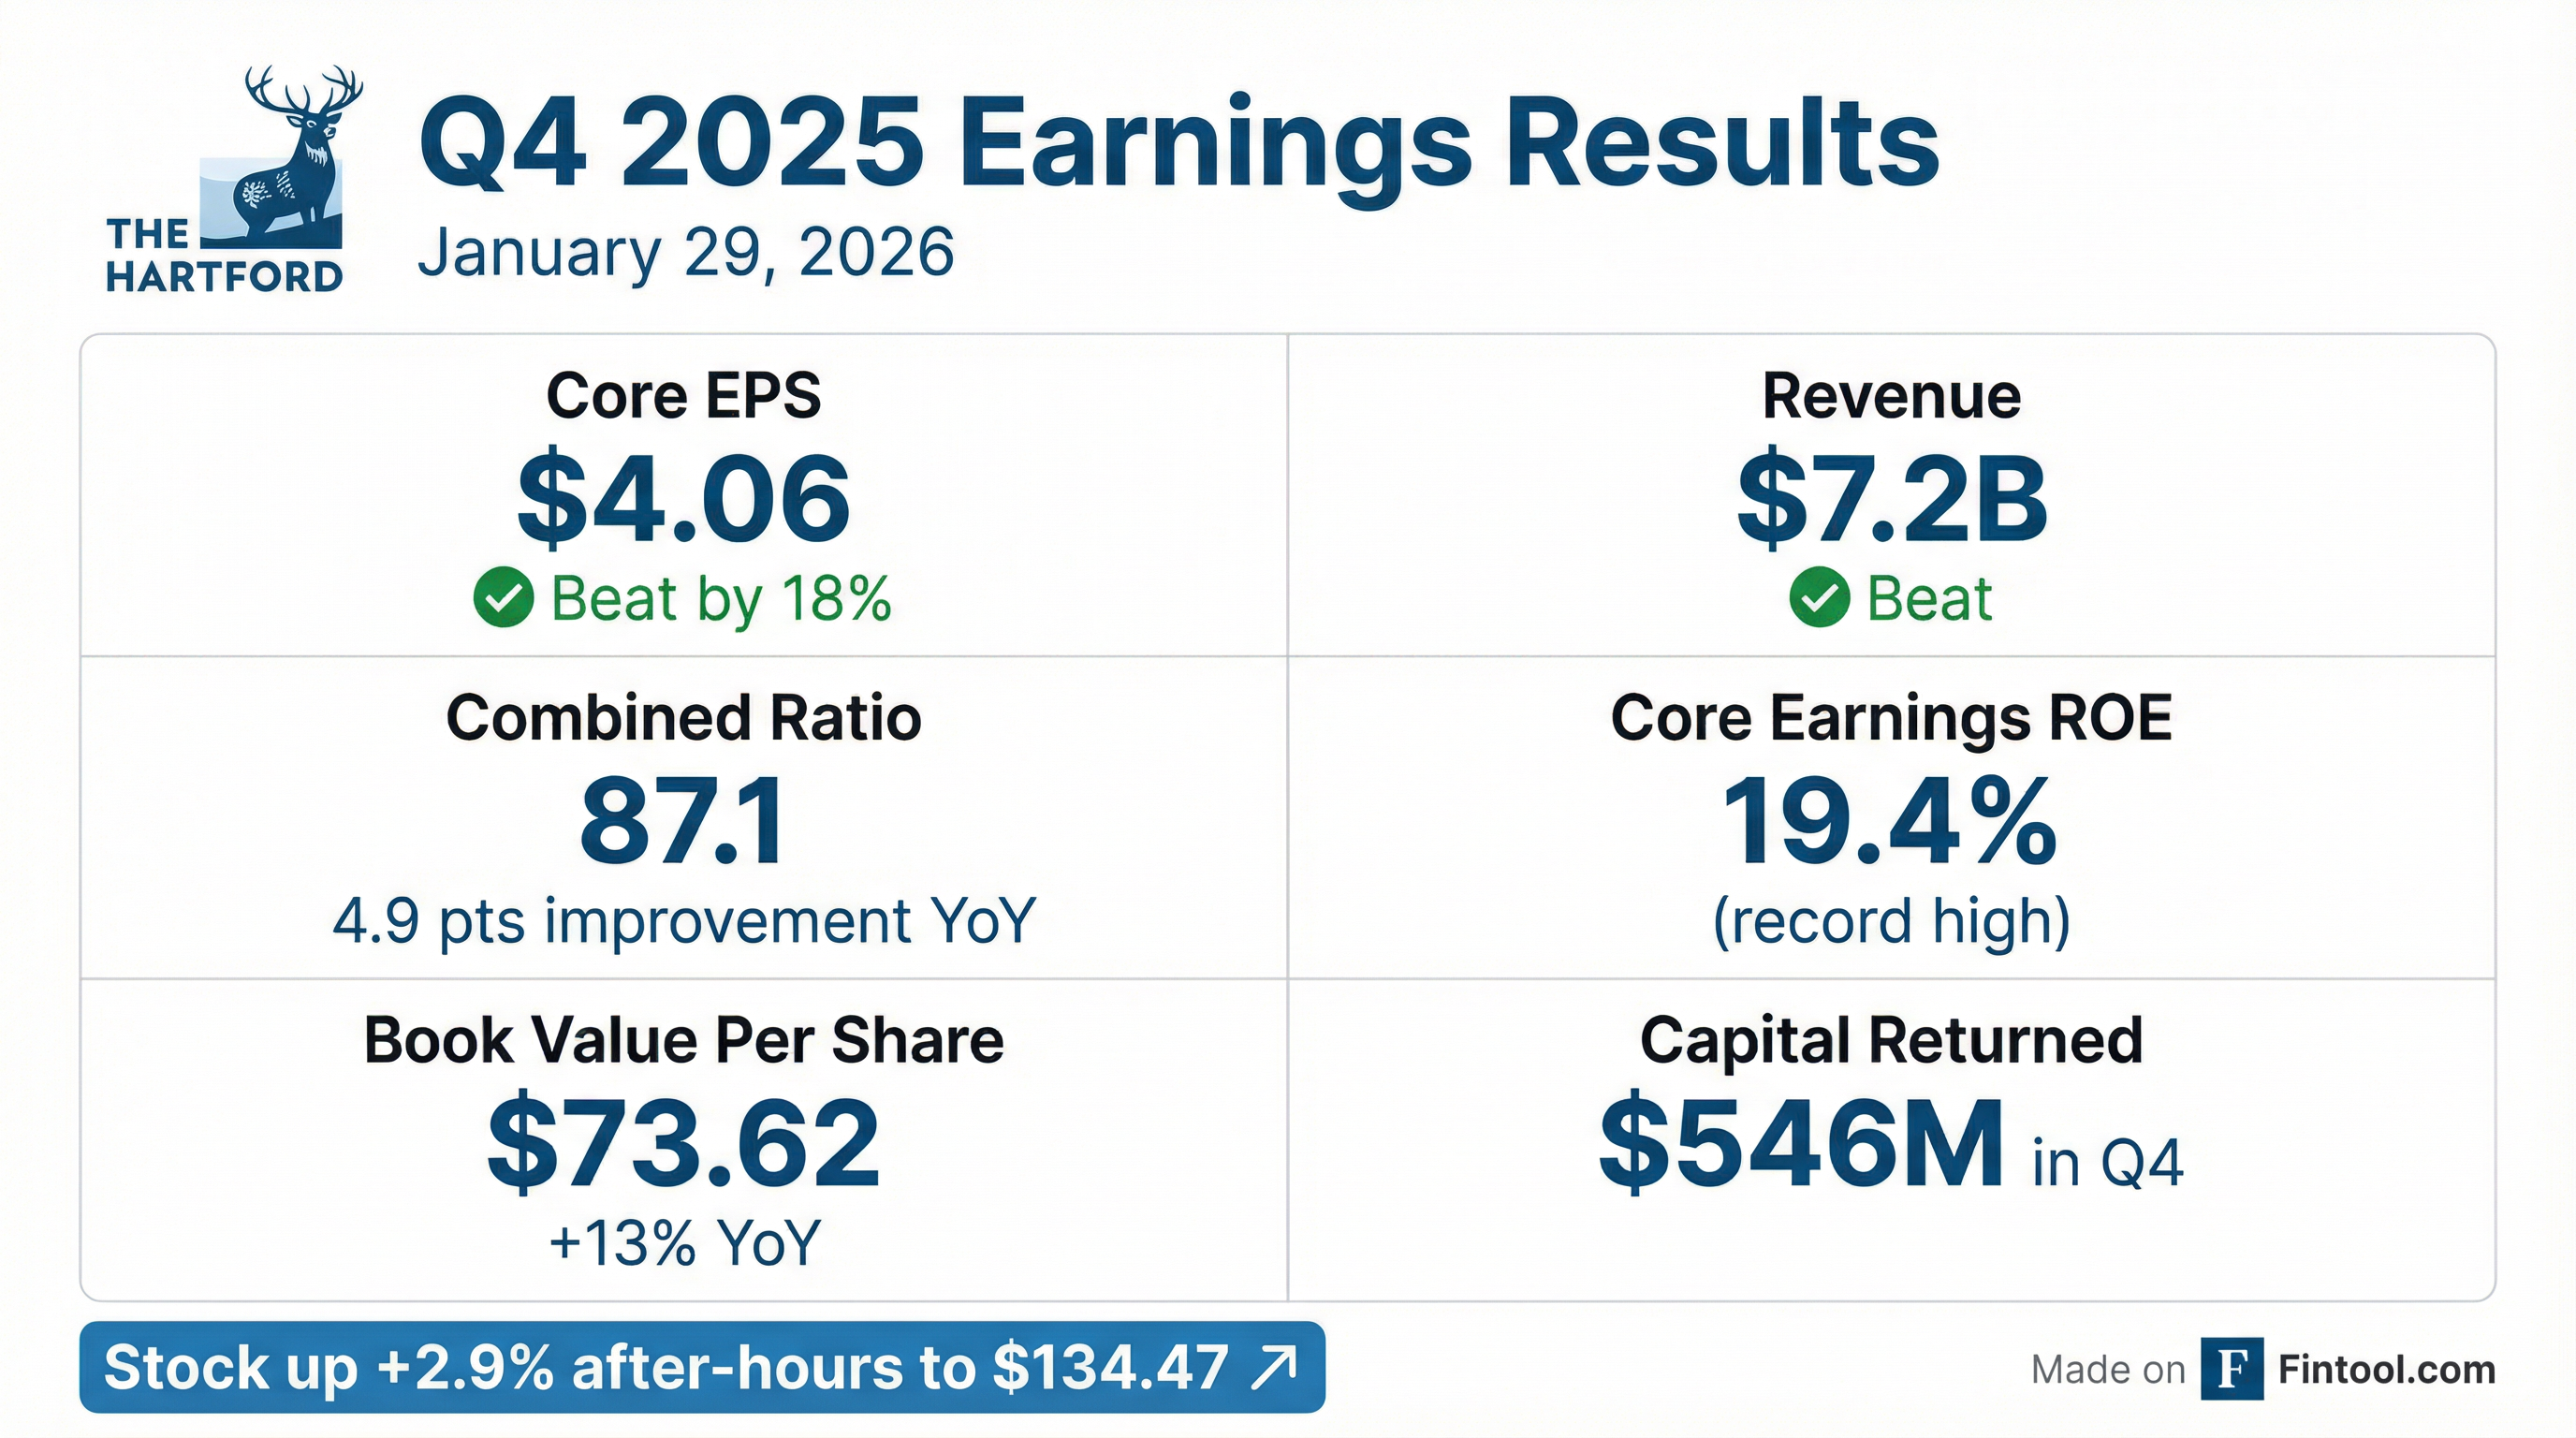
- Core earnings for Q4 were $1.1 billion ($4.06 per diluted share), driving full-year core earnings of $3.8 billion and a 19.4% ROE for 2025.
- Business Insurance delivered 7% written premium growth with $915 million of core earnings and an underlying combined ratio of 88.1%; small business grew premiums 9% at a 87.3% ratio and renewal pricing up 4.3% all-in (7.7% ex-workers’ comp).
- Personal Insurance posted $214 million of core earnings, improved its underlying combined ratio to 84.3%, achieved auto pricing +10.4% and homeowners +11.9%, and saw agency premium growth of 15% despite a 2% overall decline.
- P&C reserve development was $177 million favorable (ex-A&E); Asbestos & Environmental reserves increased by $165 million (Asbestos $122 million, Environmental $43 million); Q4 catastrophe results were a $1 million benefit, with full-year CATs at 4.2 points and reinsurance renewals lowering costs on a risk-adjusted basis.
- Continued investment in AI and digital platforms is enhancing claims (medical record summarization), underwriting, and operations, underpinning the firm’s multi-year innovation agenda.
- Delivered $3.8 billion in full-year core earnings with a 19.4% core earnings ROE in 2025; Q4 core earnings were $1.1 billion or $4.06 per share.
- Business insurance saw 8% written premium growth for the year and an 88.5 underlying combined ratio; in Q4, premiums grew 7% with an 88.1 combined ratio.
- Personal insurance posted Q4 core earnings of $214 million, an 84.3 underlying combined ratio, and achieved pricing increases of 10.4% (auto) and 11.9% (home).
- Employee benefits delivered a full-year core earnings margin of 8.2% and Q4 margin of 7.6% on $138 million of core earnings, led by life and disability results.
- Net investment income in Q4 was $832 million (up 17%), portfolio yield of 4.6%, LP returns of 11.4%; repurchased $400 million of shares in Q4 and plans to buy back $450 million per quarter in 2026.
- Core earnings were $1.148 B, up 33% YoY, driving EPS of $4.06, +38% YoY
- P&C net written premiums grew 5% in Q4 (7% in Business Insurance); full-year growth was 7% (8% Business, 4% Personal)
- Combined ratios improved in Q4: Business Insurance at 83.6 (underlying 88.1); Personal Insurance at 79.6 (underlying 84.3)
- Returned $546 M to shareholders in Q4 via $400 M share repurchases and $146 M dividends; net investment income was $832 M
- Core earnings were $1.1 billion (Q4) or $4.06 per diluted share, with full-year core earnings of $3.8 billion and a 19.4% ROE.
- Business Insurance achieved 7% written premium growth in Q4, an underlying combined ratio of 88.1, with Small Business up 9% (CR 87.3); renewal pricing was 4.3% all-in (7.7% ex workers’ comp).
- Personal Insurance delivered core earnings of $214 million, an underlying combined ratio of 84.3, Q4 pricing up 10.4% for auto and 11.9% for homeowners, and agency premium growth of 15%.
- P&C reported net favorable prior-accident-year development of $177 million, increased A&E reserves by $165 million, and saw a $1 million Q4 CAT benefit (full-year CAT at 4.2 points).
- Q4 2025 net income available to common stockholders of $1.1 billion (up 33% YoY) and diluted EPS of $3.98.
- Full year 2025 net income available to common stockholders of $3.8 billion (up 23% YoY) and diluted EPS of $13.32.
- Return on equity of 22.0% net income ROE and 19.4% core earnings ROE for 2025.
- Property & Casualty written premiums rose 5% in Q4 and 7% for the year; Business Insurance premiums grew 7% in Q4 and 8% for the year, with Q4 combined ratio of 83.6 (full year 88.3) and Personal Insurance Q4 combined ratio of 79.6 (full year 91.9).
- Returned $546 million of capital in Q4 (including $400 million of share repurchases and $146 million of dividends) and $2.2 billion for the full year (including $1.6 billion of repurchases and $592 million of dividends).
- Generated 18.4% core earnings ROE on a trailing-12-month basis and maintained an 88.6 underlying combined ratio in business insurance, underscoring disciplined underwriting and strong profitability.
- Plans to sustain high-teens ROE with growth across SME commercial (including $3.3 billion in property exposure), group benefits delivering 8–9% returns, and personal lines expansion via Prevail rollout in 30 states by early 2027.
- Committed $1.3 billion to technology in 2025 and pursuing an AI-first three-year roadmap targeting claims, underwriting, and operations to drive efficiency and digital capabilities.
- Capital strategy remains consistent: fund growth and tech investments, maintain a growing dividend, execute share buybacks, preserve AA ratings, and keep M&A as a low priority.
- Hartford generated a 18.4% core earnings ROE on a trailing-12-month basis and expects this performance to be sustainable into 2026.
- Business insurance underwriting remains robust with an 88.6% underlying combined ratio YTD and management expects to continue outperforming this benchmark.
- The investment portfolio yield is projected to be in line with 2025 levels for 2026, with alternative investments (limited partnerships) returning 7–9%, driving higher overall portfolio yield.
- Small commercial grew 10% in 2025, leveraging technology to process 75% of admitted lines without human touch (targeting 90%), enhancing underwriting speed and accuracy.
- Personal lines margins have reached targets; modest PIF count growth is expected, led by homeowners, while the Prevail agency platform is rolling out to 30 states by early 2027.
- 18.4% core earnings ROE on a trailing 12-month basis, driven by SME focus and robust margins, with management viewing this level as sustainable into 2026
- Underlying combined ratio of 88.6 targeted in business insurance, with confidence in outperforming through disciplined pricing across property, workers’ comp and specialty lines
- $1.3 billion technology budget (including $500 million in AI and cloud initiatives) aimed at processing 75% of admitted lines without human touch, enhancing underwriting, claims and operational efficiency
- Prudent capital deployment with a 15% dividend increase, ongoing share repurchases and recent AA/AA- financial strength upgrades, while prioritizing growth funding and technology investment
- The Hartford reported Q3 core earnings of $1,077 million ($3.78/share) and a trailing twelve-month ROE of 18.4%.
- Business Insurance delivered 9% written premium growth (small business +11%, middle/large +10%) with an underlying combined ratio of 89.4.
- Personal Insurance core earnings were $143 million with an underlying combined ratio of 90, homeowners ratio of 74.4, auto results improved by 3.6 points, and written premiums grew 2%.
- The quarterly dividend was increased 15% to $0.60, and 3.1 million shares were repurchased for $400 million, leaving $1.95 billion in buyback authorization.
- Net investment income totaled $759 million, portfolio yield was 4.6%, limited partnership returns were 6.7%, and both S&P and Moody’s upgraded the company’s ratings.
- Delivered record $1.1 billion core earnings ( $3.78 per diluted share) with a 18.4% trailing twelve-month ROE.
- Business Insurance posted 9% written premium growth with an 89.4% underlying combined ratio.
- Personal Insurance improved to a 90% underlying combined ratio, achieving 11.3% auto and 12.6% homeowners renewal pricing increases.
- Employee Benefits generated $149 million core earnings with an 8.3% core earnings margin.
- Capital management actions included a 15% dividend increase to $0.60 per share and $400 million of share repurchases in the quarter.
Quarterly earnings call transcripts for HARTFORD INSURANCE GROUP.
Ask Fintool AI Agent
Get instant answers from SEC filings, earnings calls & more