Earnings summaries and quarterly performance for IDEXX LABORATORIES INC /DE.
Executive leadership at IDEXX LABORATORIES INC /DE.
Jonathan Mazelsky
President and Chief Executive Officer
Andrew Emerson
Executive Vice President, Chief Financial Officer and Treasurer
George Fennell
Executive Vice President, Global CAG Commercial
Martin Smith
Executive Vice President, Global Operations and R&D
Michael Erickson
Executive Vice President and General Manager, Point of Care Diagnostics and Telemedicine
Michael Johnson
Executive Vice President and Chief Human Resources Officer
Michael Lane
Executive Vice President and General Manager, Global Reference Laboratories, Diagnostic Solutions and Information Technology
Michael Schreck
Executive Vice President and General Manager, Veterinary Software and Services, Corporate Accounts and Customer Experience
Sharon Underberg
Executive Vice President, General Counsel and Corporate Secretary
Tina Hunt
Executive Vice President, Global Strategy and Commercial
Board of directors at IDEXX LABORATORIES INC /DE.
Anne Szostak
Director
Bruce Claflin
Director
Daniel Junius
Director
Irene Chang Britt
Director
Jay Hooley
Director
Karen Peacock
Director
Lawrence Kingsley
Independent Non-Executive Board Chair
Sam Samad
Director
Sophie Vandebroek
Director
Stuart Essig
Director
Research analysts who have asked questions during IDEXX LABORATORIES INC /DE earnings calls.
Erin Wright
Morgan Stanley
7 questions for IDXX
Brandon Vazquez
William Blair & Company, L.L.C.
6 questions for IDXX
Daniel Clark
Leerink Partners
6 questions for IDXX
Christopher Schott
JPMorgan Chase & Co.
5 questions for IDXX
Jonathan Block
Stifel Financial Corp.
5 questions for IDXX
Michael Ryskin
Bank of America Merrill Lynch
4 questions for IDXX
David Westenberg
Piper Sandler
3 questions for IDXX
John Block
Stifel
3 questions for IDXX
Navann Ty
BNP Paribas S.A.
3 questions for IDXX
Andrea Alfonso
UBS
2 questions for IDXX
Chris Schott
JPMorgan Chase & Company
2 questions for IDXX
Daniel Christopher Clark
Leerink Partners
2 questions for IDXX
Keith Davos
Jefferies
2 questions for IDXX
Michael Riskin
Bank of America
2 questions for IDXX
Mike Ryskin
Bank of America
2 questions for IDXX
Navann Ty Dietschi
BNP Paribas
2 questions for IDXX
Ryan Daniels
William Blair & Company, L.L.C.
2 questions for IDXX
Jon Block
Stifel, Nicolaus & Company, Incorporated
1 question for IDXX
Katarina Markovic
JPMorgan Chase & Co.
1 question for IDXX
Recent press releases and 8-K filings for IDXX.
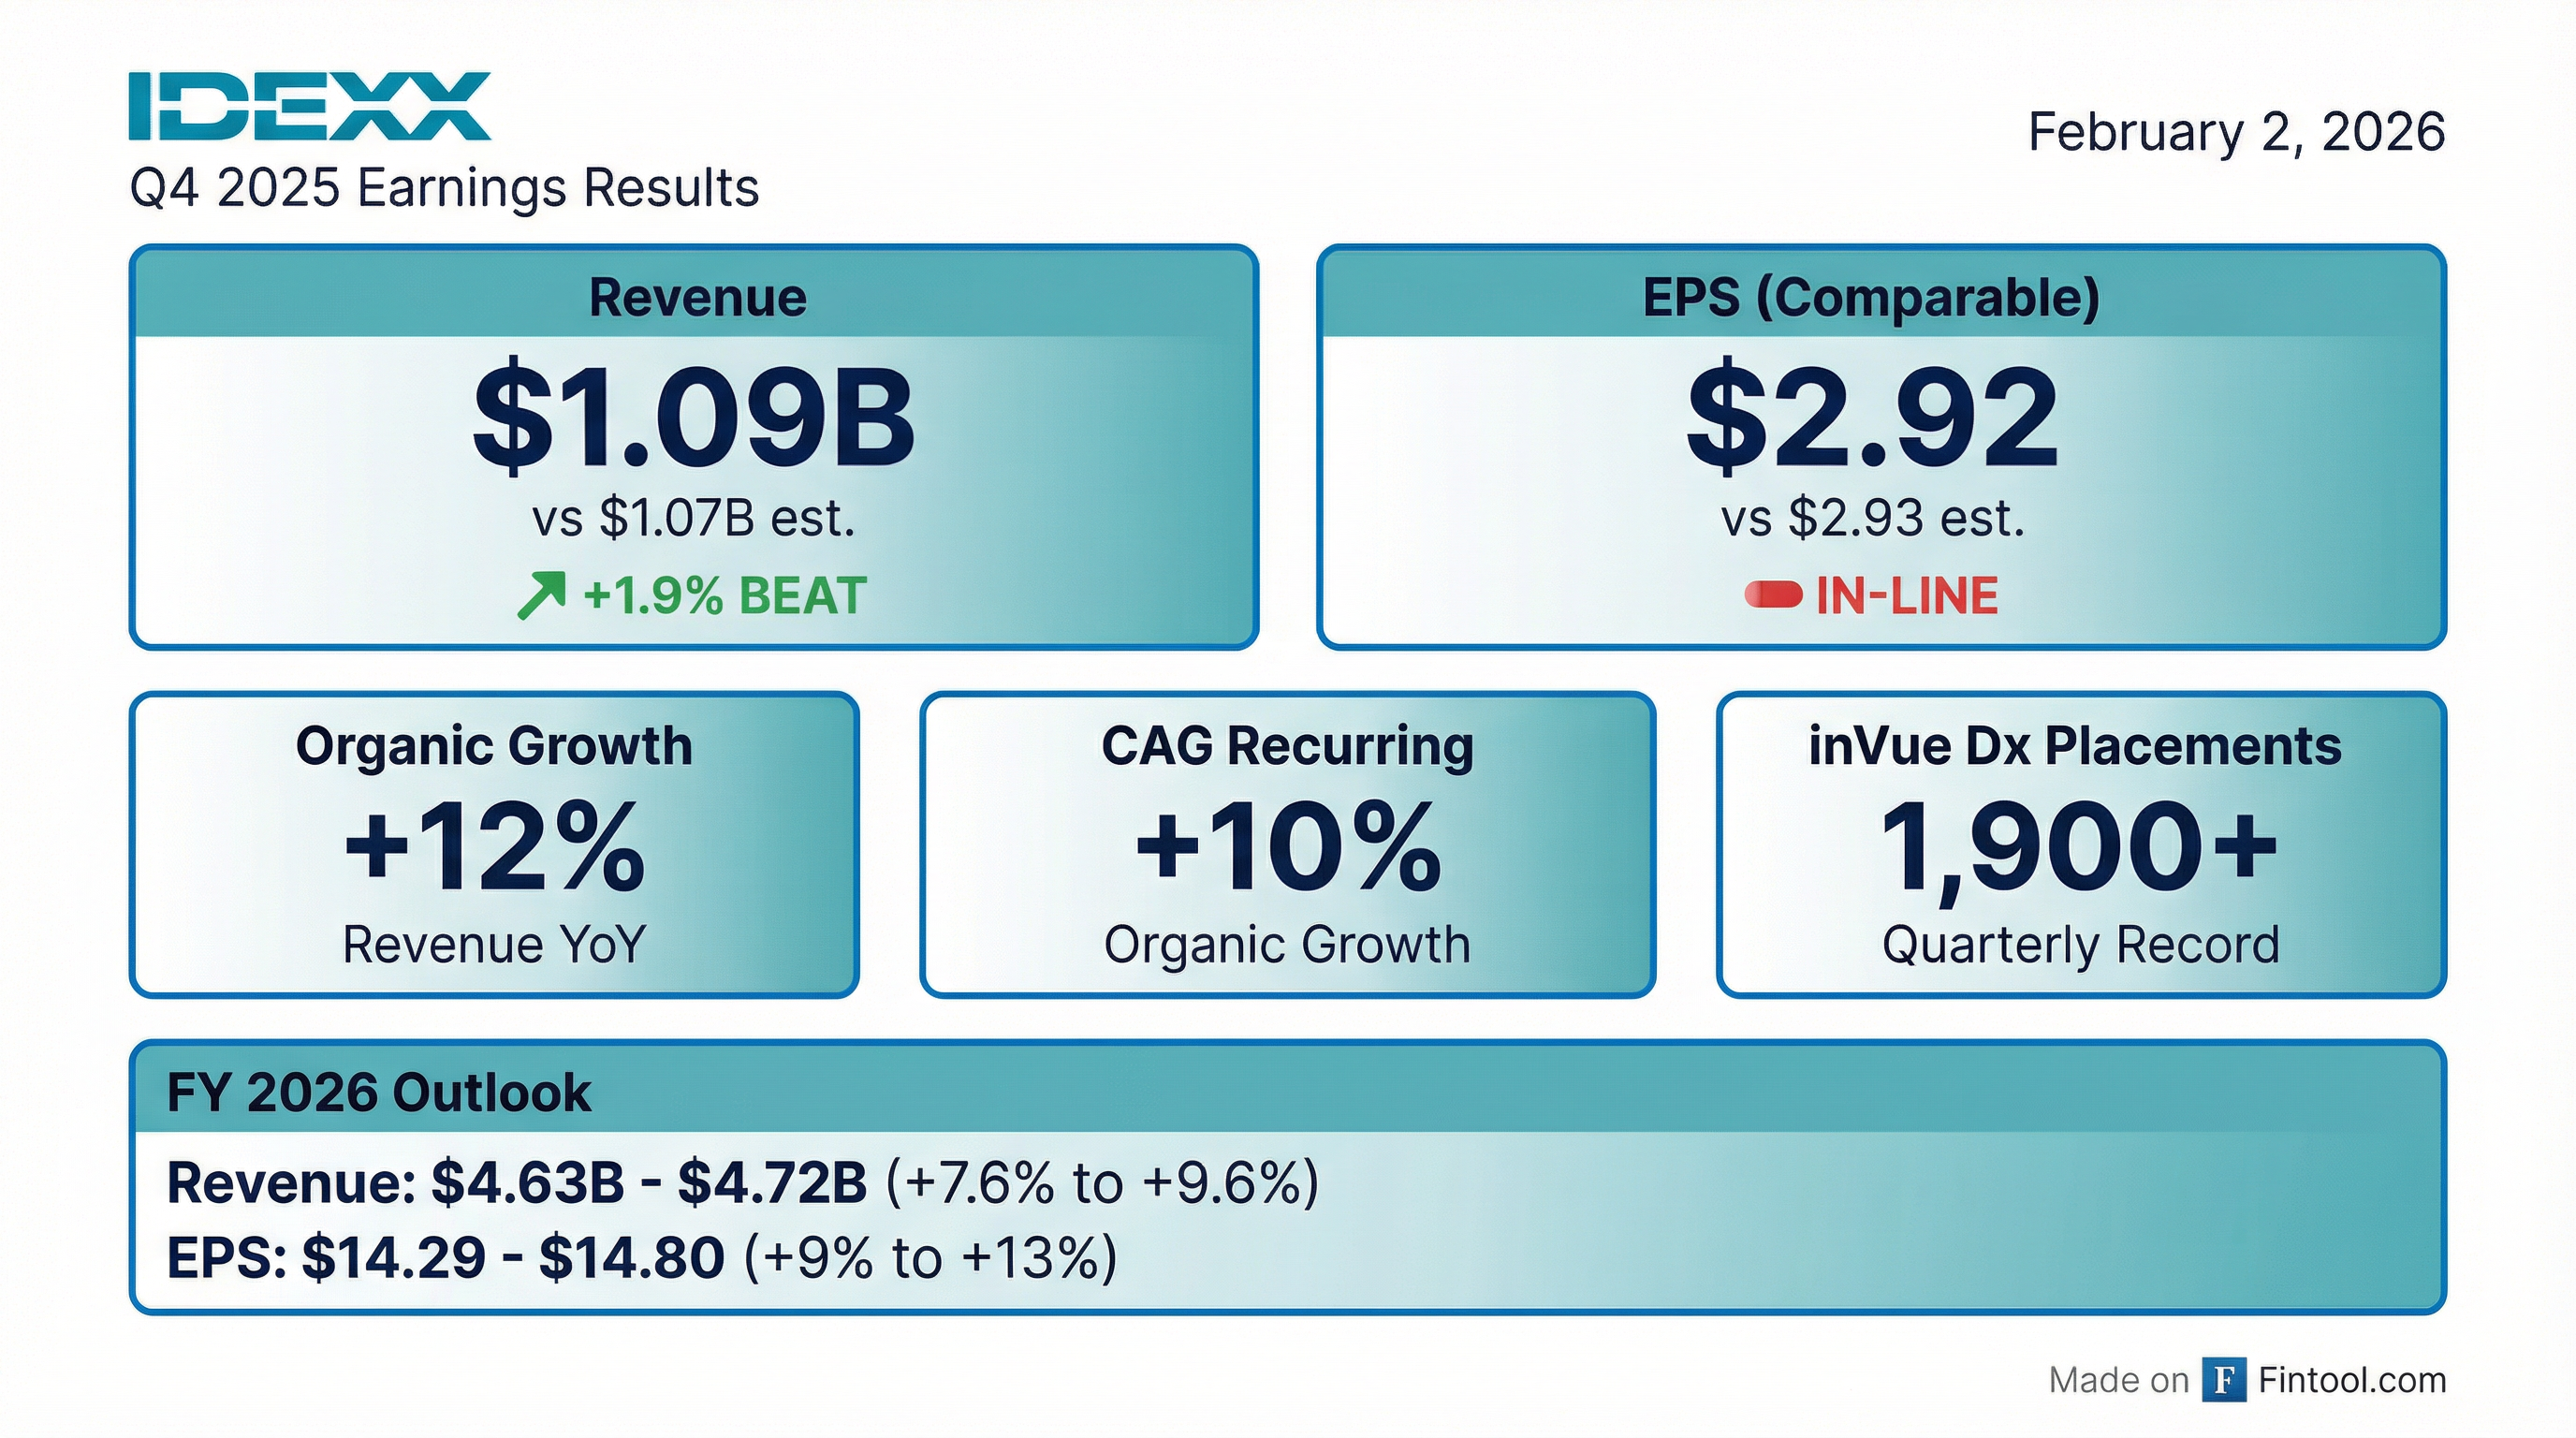
- 2025 performance: Delivered 12% organic revenue growth in Q4 and full-year double-digit organic gains, driving a 90 bp comparable operating margin improvement.
- 2026 outlook: Planning 8–10% organic recurring revenue growth (midpoint ~9%, +100 bp vs. 2025) and targeting 5,500 inVue Dx instrument placements (vs. 4,500 planned in 2025).
- inVue Dx momentum: Exceeded 6,400 placements in 2025, contributing ~200 bp to revenue growth; recurring pull-through of $3,500–$5,500 per instrument, with controlled rollout of FNA capabilities.
- Pipeline & pricing: Launching Cancer Dx mast cell mid-year and globalizing lymphoma assays; expecting a modest 4% net price realization headwind in 2026 while expanding menu (e.g., Cortisol, Pancreatic Lipase).
- Management continuity: With Mike Erickson’s CEO transition and Andrew Emerson as CFO, IDEXX reaffirms its innovation-driven strategy and robust executive leadership.
- In Q4, IDEXX delivered 12% organic revenue growth, achieved double-digit full-year organic growth, record instrument placements, 12% install-base expansion and comparable operating margin improvement.
- For 2026, IDEXX plans 8–10% diagnostic recurring revenue growth, 5,500 instrument placements, anticipates a 2% decline in US clinical visits, 5% global volume growth, and 30–80 bps margin expansion.
- The inVue Dx platform saw ~6,400 placements in 2025 (vs. 4,500 guide), contributing ~200 bps to revenue growth; pull-through is $3.5–5.5k per unit, with FNA mast cell introduction and Cancer Dx at 6,000 customers (18% new).
- IDEXX announced a CEO transition to Mike Erickson and CFO Andrew Emerson’s promotion, emphasizing strategic continuity and ongoing innovation.
- 12% organic revenue growth in Q4 and double-digit full-year 2025 performance with 90 bps operating-margin expansion, driven by record premium instrument placements and strong international volume growth.
- 2026 targets include 8–10% organic recurring-revenue growth (midpoint 9%), 5,500 instrument placements (versus 4,500 planned in 2025) and 30–80 bps margin improvement.
- Innovation platforms achieved over 6,000 inVue Dx placements and 6,000 Cancer Dx customers in 2025, with 18% of Cancer Dx users new to IDEXX and ongoing FNA mast-cell rollout.
- Despite US clinical visits down 1.7% in Q4, IDEXX anticipates a 2% visits decline in 2026 but 5% global volume growth, underpinned by higher diagnostic utilization per visit.
- Q4 revenue rose 14% reported and 12% organically, driven by double-digit top-line gains and a 10% organic increase in CAG Diagnostics’ recurring revenues.
- Q4 EPS was $3.08, up 17% on a comparable basis, while full-year EPS reached $13.08, up 14% on a comparable basis; full-year operating margin expanded to 31.6%, up 90 bps.
- Instrument placements hit record levels, with over 1,900 inVue Dx in Q4 and nearly 6,400 placements for the full year, supporting a 12% expansion in the global premium instrument install base.
- 2026 guidance calls for $4.632–4.72 billion in revenue (up 7.6–9.6% reported, 7–9% organic) and EPS of $14.29–14.80, with CAG Diagnostics recurring revenue expected to grow 8–10% organically.
- Capital return included $1.2 billion to repurchase 2.4 million shares at an average of $506, reducing diluted shares by 2.7% in 2025.
- Revenue up 14% y/y (12% organic), driven by 10% organic growth in CAG Diagnostics recurring revenues; record premium instrument placements in Q4 with over 1,900 inVue Dx, supporting 69% organic growth in CAG Diagnostics instrument revenues; Q4 EPS $3.08, +17% on a comparable basis.
- Full-year 2025: 10% organic revenue growth (8% in CAG Diagnostics recurring), global premium instrument install base +12%, operating margin 31.6% (+90 bps), EPS $13.08 (+14%), free cash flow $1.1 billion, and $1.2 billion share repurchases (2.4 million shares).
- Q4 premium instrument placements totaled 6,567 (+42% y/y); full-year placements ~22,500, including ~6,400 inVue Dx; inVue Dx contributed $75 million in 2025 instrument revenue, adding ~200 bps to company growth.
- 2026 guidance: revenue of $4.632–4.72 billion (+7.6–9.6% reported, 7–9% organic), CAG Diagnostics recurring revenues +8–10% organic, operating margin 32.0–32.5%, and targeted placement of 5,500 inVue Dx instruments.
- Q4 revenue increased 14% reported and 12% organically; full-year organic revenue grew 10%. Q4 EPS was $3.08, up 17% on a comparable basis; FY EPS was $13.08, up 14% comparably.
- Full-year operating margin reached 31.6% (+90 bps on a comparable basis); Q4 gross margin was 60.3% (up 60 bps comparably) and Q4 operating profit rose 21% reported, 17% comparably.
- Free cash flow totaled $1.1 billion (100% of net income); the company repurchased $1.2 billion of shares, reducing diluted shares by 2.7% year-over-year.
- 2026 guidance: revenue of $4.632–4.72 billion (up 7.6–9.6% reported, 7–9% organic); EPS of $14.29–14.80 (10–14% comparable); operating margin of 32.0–32.5%. Q1 ’26 revenue growth is guided at 11.5–13.5% reported and 9–11% organic.
- IDEXX Laboratories reported Q4 revenue of $1.09 billion, up 14% y/y, and delivered EPS that beat or matched forecasts.
- Operating margin expanded 150 bps to 28.9%, while recurring CAG Diagnostics revenue grew 12% to $849.7 million and CAG segment revenue rose 15% to $998.5 million.
- The company achieved record instrument placements—over 1,900 IDEXX inVue Dx systems—expanding the premium installed base 12%, and launched IDEXX Cancer Dx for canine lymphoma.
- For 2026, IDEXX guided to $4.63–4.72 billion in revenue and $14.29–14.80 in EPS, with expected high-single-digit organic growth and midpoints above analyst averages.
- IDEXX delivered Q4 revenue of $1,091 million, up 14% reported and 12% organic, driven by CAG Diagnostics recurring revenue growth of 12% reported and 10% organic.
- Q4 EPS of $3.08, a reported increase of 18% and 17% comparable, with operating margin expanding 150 bps reported (120 bps comparable) year-over-year.
- Full-year 2025 revenue of $4,304 million, up 10% as reported and organic; EPS of $13.08, up 23% reported and 14% comparable.
- 2026 guidance: revenue of $4,632 M–$4,720 M (growth of 7.6–9.6% reported; 7.0–9.0% organic) and EPS of $14.29–$14.80 (+9–13% reported; +10–14% comparable).
- Fourth-quarter revenue of $1,091 million, up 14% reported and 12% organic, driven by Companion Animal Group diagnostics and Water segment growth.
- Fourth-quarter EPS of $3.08, an 18% increase reported (17% on a comparable basis), supported by a 150 bps expansion in operating margin.
- Full year 2025 revenue of $4,304 million, up 10% reported and organic; full year EPS of $13.08, up 23% reported and 14% on a comparable basis, reflecting margin expansion.
- Provided 2026 guidance of $4,632–$4,720 million in revenue (7.6–9.6% reported; 7.0–9.0% organic) and EPS of $14.29–$14.80 (9–13% reported; 10–14% comparable).
- Michael (Mike) Erickson, PhD, will become President and Chief Executive Officer effective May 12, 2026, succeeding Jay Mazelsky in the role.
- Jay Mazelsky will transition to Executive Chair of the Board on May 12, 2026, and will retire following the annual shareholders’ meeting in May 2027, collaborating with Dr. Erickson to ensure a smooth handover.
- Dr. Erickson, who joined IDEXX in 2011 and currently serves as Executive VP and GM of Global Point of Care Diagnostics and Telemedicine, will also join the Board upon his appointment.
- Lawrence D. Kingsley, the Board’s Independent Non-Executive Chair, will serve as Lead Director during the transition period.
Quarterly earnings call transcripts for IDEXX LABORATORIES INC /DE.
Ask Fintool AI Agent
Get instant answers from SEC filings, earnings calls & more