Earnings summaries and quarterly performance for REALTY INCOME.
Executive leadership at REALTY INCOME.
Sumit Roy
President and Chief Executive Officer
Gregory J. Whyte
Executive Vice President, Chief Operating Officer
Jonathan Pong
Executive Vice President, Chief Financial Officer, and Treasurer
Mark E. Hagan
Executive Vice President, Chief Investment Officer
Michelle Bushore
Executive Vice President, Chief Legal Officer, General Counsel, and Secretary
Neil M. Abraham
Executive Vice President, Chief Strategy Officer and President, Realty Income International
Shannon Kehle
Executive Vice President, Chief People Officer
Board of directors at REALTY INCOME.
A. Larry Chapman
Director
Gerardo I. Lopez
Director
Gregory T. McLaughlin
Director
Jeff A. Jacobson
Director
Kim Hourihan
Director
Mary Hogan Preusse
Director
Michael D. McKee
Non-Executive Independent Chairman of the Board
Priscilla Almodovar
Director
Priya Cherian Huskins
Director
Reginald H. Gilyard
Director
Research analysts who have asked questions during REALTY INCOME earnings calls.
Brad Heffern
RBC Capital Markets
6 questions for O
Ronald Kamdem
Morgan Stanley
6 questions for O
Upal Rana
KeyBanc Capital Markets
6 questions for O
Greg McGinniss
Scotiabank
5 questions for O
Haendel St. Juste
Mizuho Financial Group
5 questions for O
Jay Kornreich
Wedbush Securities
5 questions for O
Linda Tsai
Jefferies
4 questions for O
Michael Goldsmith
UBS
4 questions for O
Omotayo Okusanya
Deutsche Bank AG
4 questions for O
Wesley Golladay
Robert W. Baird & Co.
4 questions for O
Eric Borden
BMO Capital Markets
3 questions for O
Jason Wayne
Barclays
3 questions for O
Smedes Rose
Citigroup
3 questions for O
James Emmer
Evercore ISI
2 questions for O
John Kaczynski
Wells Fargo
2 questions for O
Joshua Dennerlein
BofA Securities
2 questions for O
Ryan Caviola
Green Street
2 questions for O
Spenser Glimcher
Green Street Advisors, LLC
2 questions for O
Alec Feygin
Robert W. Baird & Co. Incorporated
1 question for O
Anthony Paolone
JPMorgan Chase & Co.
1 question for O
Bennett Rose
Citigroup
1 question for O
Catherine Greg
UBS
1 question for O
Daniel Byun
Bank of America
1 question for O
Elmer Chang
Scotiabank
1 question for O
Jason Wen
Barclays
1 question for O
John Kilichowski
Wells Fargo & Company
1 question for O
Linda Yu Tsai
Jefferies Financial Group Inc.
1 question for O
Matti Fares
Citigroup Inc.
1 question for O
Ravi Babin
Mizuho Financial Group
1 question for O
Rich Hightower
Barclays
1 question for O
R.J. Milligan
Raymond James
1 question for O
Ryan Taboo
Green Street
1 question for O
Spenser Allaway
Green Street
1 question for O
Wes Golladay
Baird
1 question for O
William John Kilichowski
Wells Fargo
1 question for O
Recent press releases and 8-K filings for O.
- Portfolio scale: enterprise value of ~$82 billion, 15,511 properties across 10 countries, $5.3 billion in annualized base rent, and 98.9% occupancy rate.
- Net leverage: net debt of $29.3 billion with net debt to annualized adjusted EBITDAre of 5.5×, backed by A3/A- credit ratings.
- AFFO per share: diluted AFFO per share of $4.19 in 2025, up from $4.00 in 2024, representing approximately 4.8% year-over-year growth.
- Dividend profile: declared annualized dividend per share of $3.240, yielding ~5.7%, with 113 consecutive quarterly increases and a 31-year streak of annual dividend growth at a 4.2% CAGR.
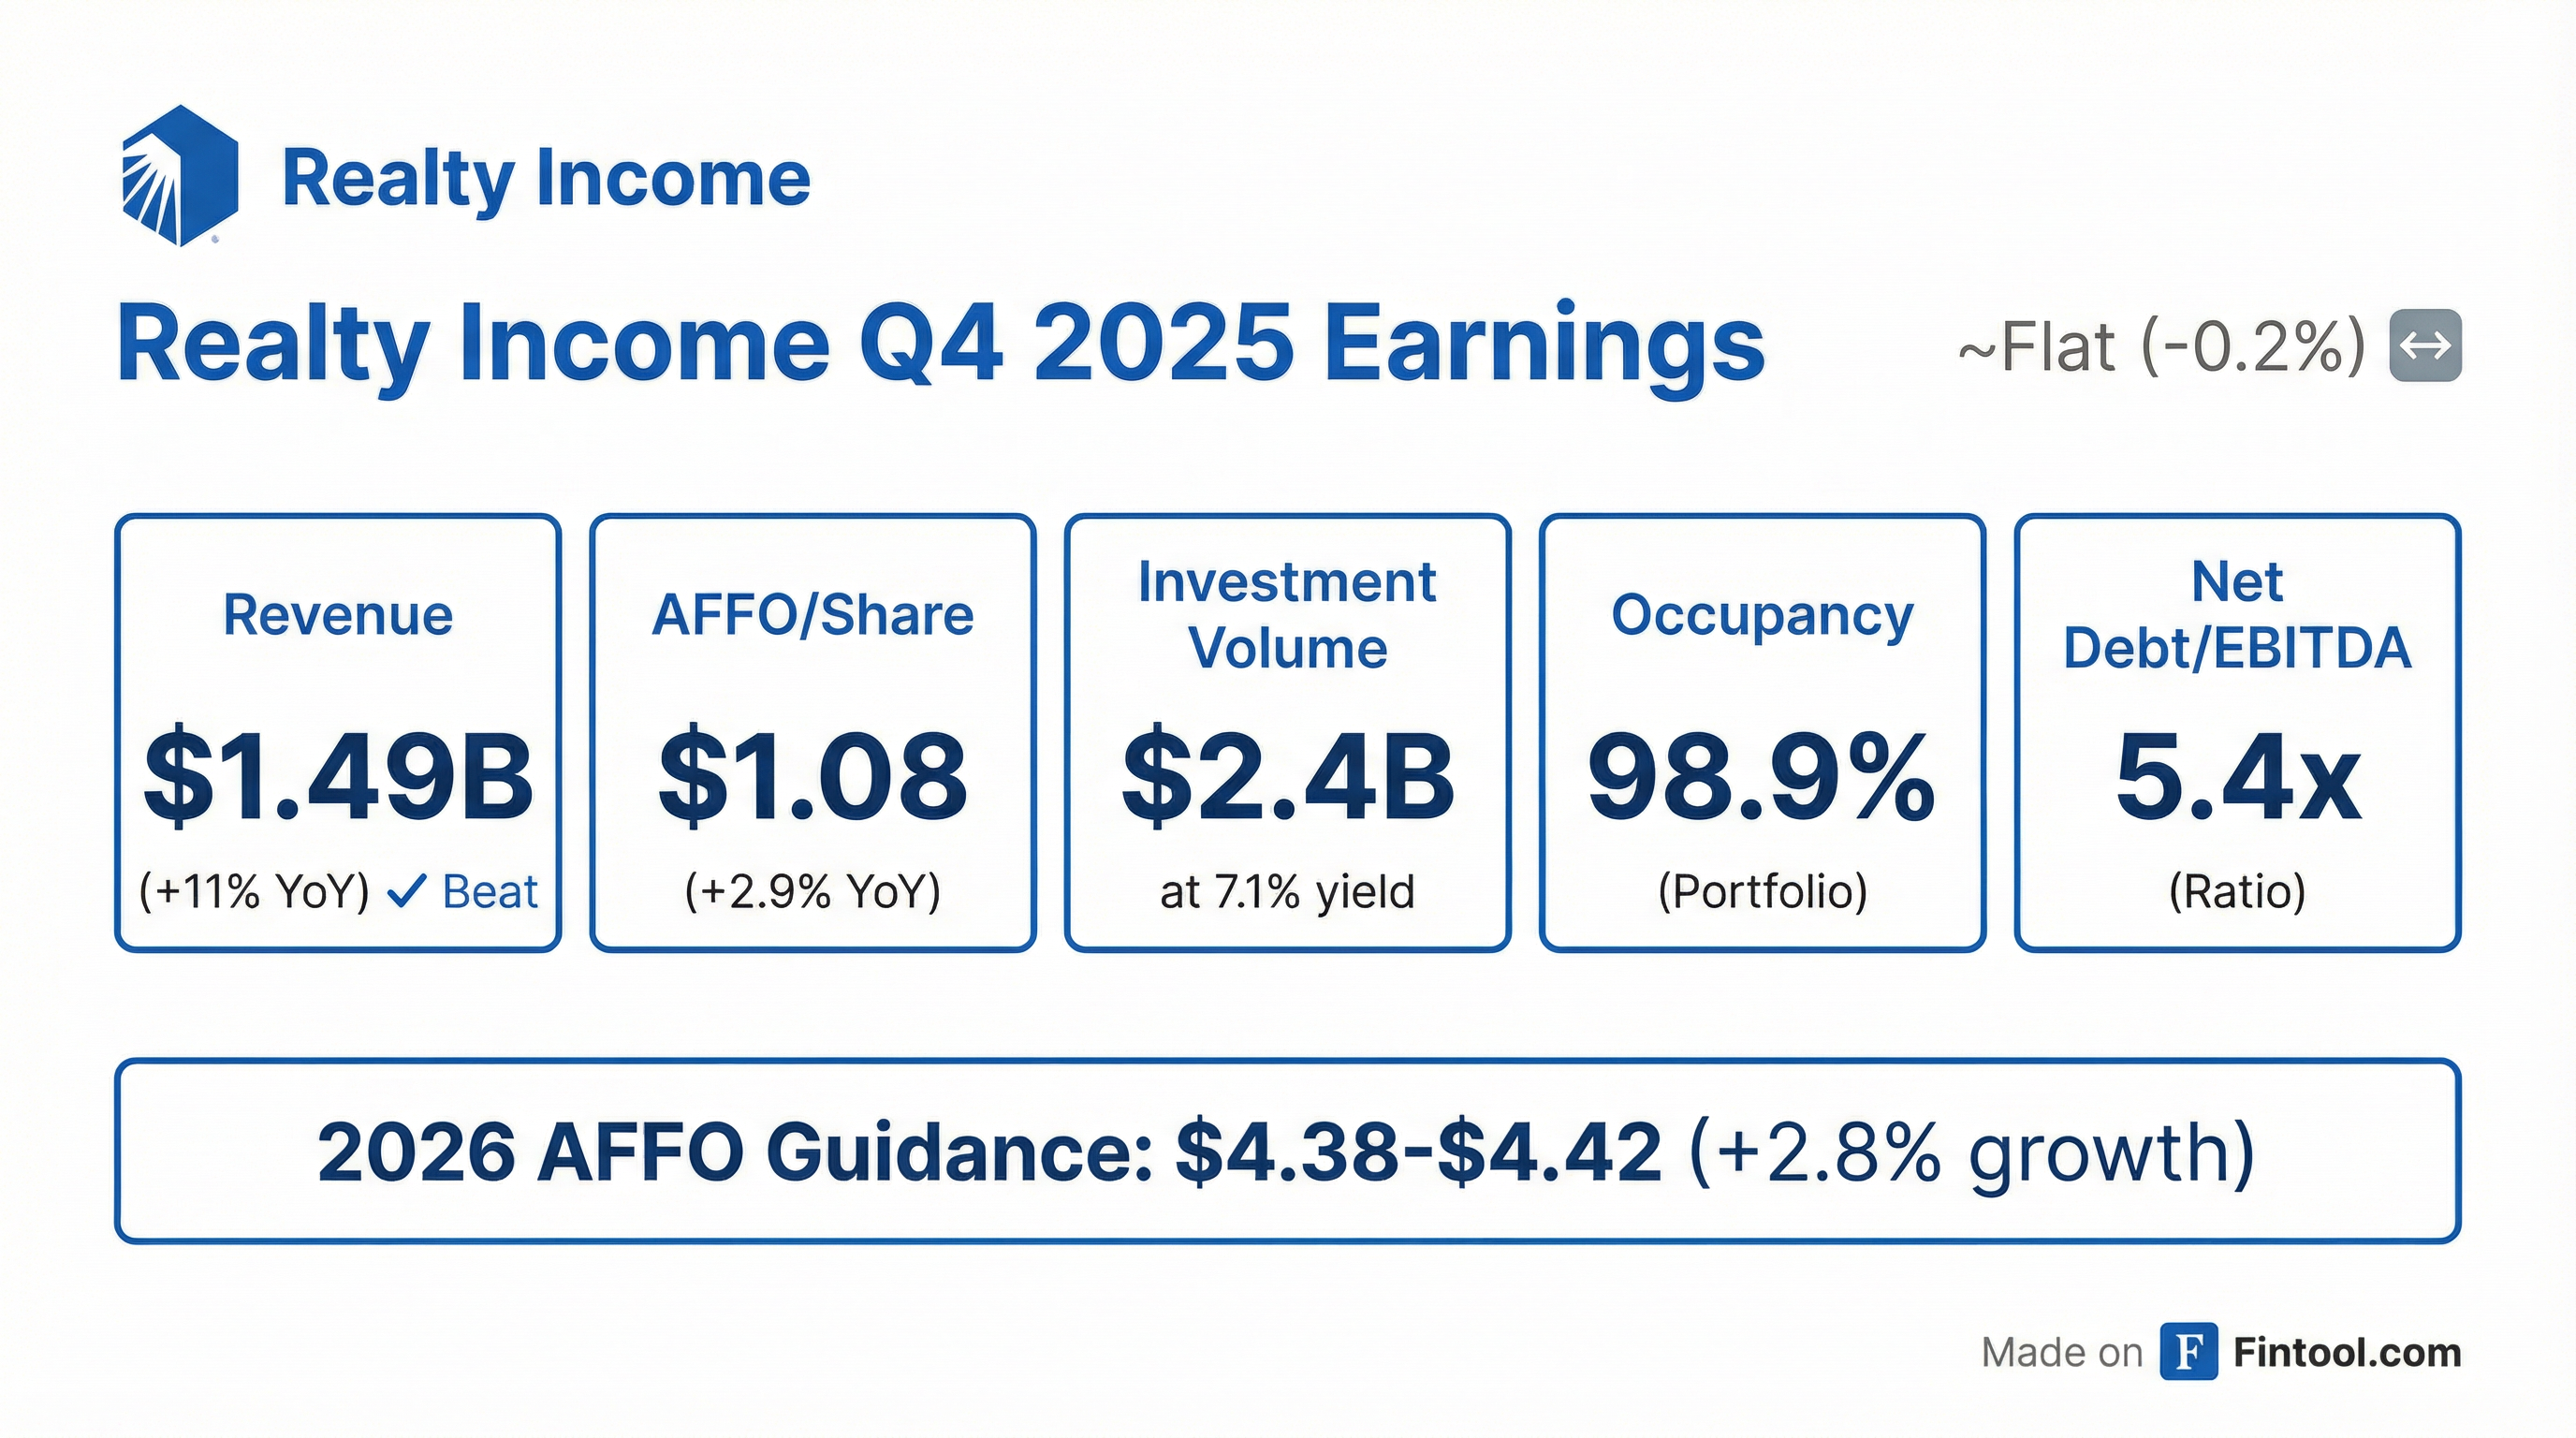
- Delivered AFFO per share of $1.08 in Q4 and $4.28 for FY 2025, with 98.9% occupancy and 103.9% rent recapture reinforcing portfolio stability.
- Deployed approximately $2.4 billion (pro rata $2.3 billion) in Q4 at a 7.1% initial cash yield; full-year acquisitions totaled $6.3 billion (pro rata $6.2 billion) at 7.3%, and 2026 investment guidance is $8 billion.
- Ended 2025 with $4.1 billion of pro rata liquidity, net debt/adjusted EBITDA of 5.4×, issued $862 million of 3.5% convertible notes and repurchased $102 million of stock.
- 2026 guidance includes AFFO per share of $4.38–$4.42 and credit-loss assumptions of 40–50 bps of rental revenue.
- Launched a $1.5 billion open-end perpetual fund, formed a programmatic $1.5 billion JV with GIC for build-to-suit industrial, and expanded into Mexico under a strategic partnership.
- AFFO per share of $1.08 in Q4 and $4.28 for FY 2025; portfolio occupancy at 98.9% with 103.9% rent recapture.
- Q4 acquisitions of $2.4 billion gross ($2.3 billion pro rata) at a 7.1% initial cash yield; FY 2025 acquisitions of $6.3 billion gross ($6.2 billion pro rata) at 7.3% yield; sold 425 properties for $744 million.
- Ended year with over $4.1 billion pro rata liquidity and net debt/EBITDA of 5.4×; issued $862 million convertible note at 3.5%, using $102 million to repurchase shares and repaying a $500 million note.
- 2026 guidance: AFFO per share of $4.38–$4.42, $8 billion of investment capacity, and 40–50 bps of credit losses versus 70 bps in 2025.
- Entered Mexico industrial market and U.S. build-to-suit JV with GIC ($1.5 billion), closing first $58.5 million transaction in Dallas.
- Realty Income delivered AFFO per share of $1.08 in Q4 and $4.28 for FY 2025, with 98.9% occupancy and 103.9% rent recapture.
- The company deployed $2.4 billion in Q4 (and $6.3 billion for FY 2025) at 7.1% (7.3% pro rata) initial cash yield, and sold 425 properties for $744 million to redeploy capital.
- Balance sheet strengthened with $4.1 billion of liquidity, net debt/adj. EBITDA of 5.4×, and a $862 million convertible note issuance at 3.5%, partially used to repurchase shares and refinance higher-cost debt.
- 2026 guidance includes AFFO per share of $4.38–$4.42, an $8 billion investment plan, credit-loss assumption of 40–50 bps, lease termination income of $30–40 million, and margin targets of 1.5% property expenses and 20–23 bps cash G&A.
- The firm launched a $1.5 billion U.S. open-end perpetual fund and entered strategic partnerships with GIC and Blackstone for industrial build-to-suit and preferred equity investments.
- Realty Income reported Q4 2025 net income of $296.1 million ( $0.32 per share ) and AFFO of $1.08 per share.
- For the year ended December 31, 2025, net income was $1.06 billion ( $1.17 per share ) and AFFO was $4.28 per share.
- Investment activity totaled $2.4 billion in Q4 2025 (pro-rata $2.3 billion at a 7.1% yield) and $6.3 billion for the full year (pro-rata $6.2 billion at 7.3%).
- Leverage remained at 5.4x Net Debt to annualized pro forma Adjusted EBITDAre, and the company settled 14.0 million ATM shares for $817.8 million in Q4.
- Subsequent to quarter end, issued $862.5 million of 3.50% convertible notes due 2029, raised $1.5 billion for its inaugural Open-End Core Plus Fund, and guided 2026 AFFO of $4.38–$4.42 per share.
- In Q4 2025, Realty Income generated $296.1 million of net income available to common stockholders ( $0.32/share ) and $1.08 of AFFO per share; for the full year, net income was $1.1 billion ( $1.17/share ) and AFFO was $4.28 per share.
- The company invested $2.4 billion in Q4 (pro-rata share $2.3 billion) at a 7.1% initial cash yield; full-year investments totaled $6.3 billion (pro-rata $6.2 billion) at 7.3% yield.
- 2026 guidance includes AFFO per share of $4.38–$4.42, investment volume of ~$8.0 billion, and same-store rent growth of 1.0%–1.3%.
- As of December 31, 2025, the company had $4.1 billion of available liquidity on a pro-rata basis and in January 2026 issued $862.5 million of 3.500% convertible senior notes due 2029.
- 2025 investment-volume guidance raised to $5.5 billion; full-year AFFO/share guidance also increased
- Strategic growth moves: logistics partnership with GIC targeting >$1.5 billion, $200 million industrial commitment in Mexico, and $862.5 million convertible note placement
- Q4 2025 results due Feb 24, 2026, with consensus EPS ~$0.66 and AFFO ~$1.08; analysts will watch for 2026 AFFO guidance and progress on the $5.5 billion target
- Stock near a 52-week high of $67, up ~19% YTD, with a monthly $0.27 dividend (≈4.9% yield; ex-dividend Feb 27, 2026)
- Realty Income and GIC form a $1.5 billion+ JV to develop build-to-suit U.S. logistics assets under long-term net leases to investment-grade tenants.
- Realty Income commits $200 million to finance and acquire a U.S. dollar-denominated industrial portfolio in Mexico City and Guadalajara—its first investment in Mexico.
- GIC closes as cornerstone investor in Realty Income’s U.S. Core Plus fund, advancing the company’s private capital initiative to diversify funding sources and expand its investable universe.
- Realty Income closed its private offering of $862.5 million aggregate principal amount of 3.500% convertible senior notes due 2029, including full exercise of a $112.5 million option.
- Net proceeds were approximately $845.5 million, which Realty Income plans to use for general corporate purposes, including debt repayment, hedging, property development and acquisitions.
- Approximately $101.9 million of the net proceeds were used to repurchase 1.8 million shares of common stock concurrently with the offering.
- The notes are initially convertible into common stock at a rate of 14.4051 shares per $1,000 principal amount.
- Realty Income closed a private offering of $862.5 million aggregate principal amount of 3.500% convertible senior notes due 2029, including full exercise of a $112.5 million additional-notes option.
- Net proceeds were approximately $845.5 million, of which $101.9 million funded the repurchase of ~1.8 million common shares concurrently with pricing.
- The company intends to use the majority of proceeds for general corporate purposes, including repayment of indebtedness (notably $500 million of 5.050% senior notes due January 13, 2026), borrowings under credit facilities, property development, acquisitions and hedging.
- The notes and any common shares issuable upon conversion are unregistered under the Securities Act and were sold to qualified institutional buyers under Rule 144A.
Quarterly earnings call transcripts for REALTY INCOME.
Ask Fintool AI Agent
Get instant answers from SEC filings, earnings calls & more