Earnings summaries and quarterly performance for PULTEGROUP INC/MI/.
Executive leadership at PULTEGROUP INC/MI/.
Ryan R. Marshall
President and Chief Executive Officer
James L. Ossowski
Executive Vice President and Chief Financial Officer
Kevin A. Henry
Executive Vice President and Chief People Officer
Matthew Koart
Executive Vice President and Chief Operating Officer
Todd N. Sheldon
Executive Vice President, General Counsel and Corporate Secretary
Board of directors at PULTEGROUP INC/MI/.
André J. Hawaux
Director
Brian P. Anderson
Director
Bryce Blair
Director
Cheryl W. Grisé
Director
John R. Peshkin
Director
Kristen Actis-Grande
Director
Lila Snyder
Director
Scott F. Powers
Director
Thomas J. Folliard
Non-Executive Chairman of the Board
Research analysts who have asked questions during PULTEGROUP INC/MI/ earnings calls.
John Lovallo
UBS Group AG
8 questions for PHM
Michael Rehaut
JPMorgan Chase & Co.
8 questions for PHM
Stephen Kim
Evercore ISI
8 questions for PHM
Alan Ratner
Zelman & Associates
7 questions for PHM
Anthony Pettinari
Citigroup Inc.
6 questions for PHM
Kenneth Zener
Seaport Research Partners
6 questions for PHM
Sam Reid
Wells Fargo
5 questions for PHM
Matthew Bouley
Barclays PLC
4 questions for PHM
Matthew Bouley
Barclays
4 questions for PHM
Carl Reichardt
BTIG, LLC
3 questions for PHM
Jay McCanless
Wedbush Securities
3 questions for PHM
Michael Dahl
RBC Capital Markets
3 questions for PHM
Mike Dahl
RBC Capital Markets
3 questions for PHM
Rafe Jadrosich
Bank of America
3 questions for PHM
Susan Maklari
Goldman Sachs Group Inc.
3 questions for PHM
Trevor Allinson
Wolfe Research, LLC
2 questions for PHM
Truman Patterson
Wolfe Research
2 questions for PHM
Buck Horne
Raymond James Financial, Inc.
1 question for PHM
Christopher Kalata
RBC Capital Markets
1 question for PHM
Ivy Lynne Zelman
Zelman & Associates
1 question for PHM
Paul Przybylski
Wolfe Research, LLC
1 question for PHM
Rafe Chadrosic
Bank of America
1 question for PHM
Richard Reid
Wells Fargo & Company
1 question for PHM
Recent press releases and 8-K filings for PHM.
- On February 20, 2026, PulteGroup completed a public offering of $800 million aggregate principal amount of senior unsecured notes: $400 million 4.250% notes due 2031 and $400 million 4.900% notes due 2036.
- The notes were issued under an Indenture dated February 5, 2026, as supplemented on February 20, 2026, and are unconditionally guaranteed on a senior basis by the Company’s U.S. subsidiaries.
- The 2031 notes mature on March 1, 2031, and the 2036 notes mature on March 1, 2036, with interest payable semi-annually on March 1 and September 1, beginning September 1, 2026.
- Prior to their respective par call dates, the notes are redeemable at a make-whole redemption price; at or after par call dates, they may be redeemed at 100% of principal plus accrued interest.
- In the event of a change of control, PulteGroup must offer to repurchase the notes at 101% of principal plus accrued interest.
- PulteGroup priced an $800 million underwritten offering of senior unsecured notes: $400 million 4.25% notes due March 1, 2031 and $400 million 4.90% notes due March 1, 2036 at a 99.658% public offering price for the 2031 tranche.
- Net proceeds will repay senior notes maturing in March 2026 and redeem $337.3 million of 5.00% notes due 2027 (redeemed March 13, 2026).
- Management aims to stagger and extend maturities, lower interest costs and maintain financial flexibility with any remaining proceeds available for general corporate purposes.
- Analysts hold a “Buy” rating with a $152 price target and Spark AI labels PulteGroup “Outperform,” citing robust margins and liquidity against housing affordability and regional demand risks.
- PulteGroup priced an $800 million underwritten public offering of senior unsecured notes, consisting of $400 million 4.250% notes due March 1, 2031 (priced at 99.658%, yield 4.326%) and $400 million 4.900% notes due March 1, 2036 (priced at 99.038%, yield 5.023%).
- The offering is expected to close on or about February 20, 2026, subject to customary closing conditions.
- Net proceeds will be used to repay $251.9 million principal of 5.500% senior notes due March 2026 and redeem $337.3 million principal of 5.000% senior notes due January 2027 (including premiums and accrued interest); remaining proceeds for general corporate purposes.
- J.P. Morgan Securities LLC, BofA Securities, Inc., Truist Securities, Inc., U.S. Bancorp Investments, Inc., and other firms are serving as joint book-running managers.
- Home sale revenues of $4.5 billion (-5% YoY), 7,821 homes closed (-3%), and $573,000 average sales price (-1%) in Q4 2025.
- Gross margin of 24.7% (including $35 million of land impairments) and incentives at 9.9% of sales versus 7.2% in Q4 2024.
- Net income of $502 million (EPS $2.56) versus $913 million (EPS $4.43) in Q4 2024; full-year 2025 net income of $2.2 billion (EPS $11.12).
- Strong liquidity with $2 billion cash, net debt-to-capital of -3%, and 235,000 lots under control at year-end.
- 2026 guidance: Q1 closings of 5,700–6,100 homes, full-year closings of 28,500–29,000 homes, ASP of $550,000–560,000, and gross margins of 24.5–25.0%.
- Q4 home sale revenues of $4.5 billion (-5% y/y) on 7,821 closings (-3% y/y) with an average selling price of $573,000 (-1% y/y).
- Q4 gross margin of 24.7% versus 27.5% last year, including $35 million of land impairments (80 bps) and incentives of 9.9% of home sale price (7.2% LY).
- Q4 net income of $502 million or $2.56 per share, down from $913 million or $4.43 PS in Q4 2024; FY 2025 net income of $2.2 billion or $11.12 PS.
- Year-end liquidity and capital allocation: $2 billion cash, net debt-to-capital of -3% ; repurchased 10.6 million shares for $1.2 billion in 2025, with $983 million remaining authorization.
- 2026 guidance: 28,500–29,000 home closings; ASP of $550,000–$560,000; gross margin 24.5%–25.0%; SG&A 9.5%–9.7% of revenue; tax rate ~24.5%.
- Reported net income of $502 million, or $2.56 per share, in Q4 2025.
- Home sale revenues declined 5% to $4.5 billion; Q4 closings were 7,821 homes (-3% YoY) with an average sales price of $573,000.
- Q4 home sale gross margin contracted to 24.7% from 27.5% a year ago; incentives rose to 9.9% of revenues (vs. 7.2% in Q4 2024).
- Issued Q1 2026 guidance for 5,700–6,100 closings, 24.5–25.0% gross margin, and average sales price of $550–560K.
- Returned capital with repurchases of 2.4 million shares for $300 million in Q4 (10.6 million shares/$1.2 billion full-year) and ended 2025 with $2.0 billion cash and an 11.2% debt-to-capital ratio.
- PulteGroup closed 2025 with home sale revenues of $16.7 billion, gross/operating margins of 26.3%/16.9%, net income of $2.2 billion, and cash flow from operations of $1.9 billion.
- In Q4 2025, the company delivered $4.5 billion in home sale revenues on 7,821 closings and reported a 24.7% gross margin (including $35 million of land impairments).
- For 2026, PulteGroup guides to 28,500–29,000 home closings, an average sales price of $550,000–$560,000, gross margins of 24.5%–25.0%, and SG&A of 9.5%–9.7% of revenue.
- The balance sheet remains strong with $2 billion of cash, a net debt-to-capital ratio of –3%, and 235,000 lots under control; the company also plans to divest its off-site manufacturing operations, recording an $81 million charge in Q4.
- PulteGroup reported net income of $502 million, or $2.56 per diluted share, in Q4 2025, compared with $913 million, or $4.43 per share, in Q4 2024.
- Q4 home sale revenues were $4.48 billion from 7,821 closings at an average selling price of $573,000, down 5% and 1%, respectively, year-over-year.
- Net new orders increased 4% to 6,428 homes with a value of $3.5 billion, and the ending backlog was 8,495 homes valued at $5.3 billion.
- The Company repurchased 2.4 million shares for $300 million in Q4, ended the quarter with $2.0 billion of cash, and maintained a debt-to-capital ratio of 11.2%.
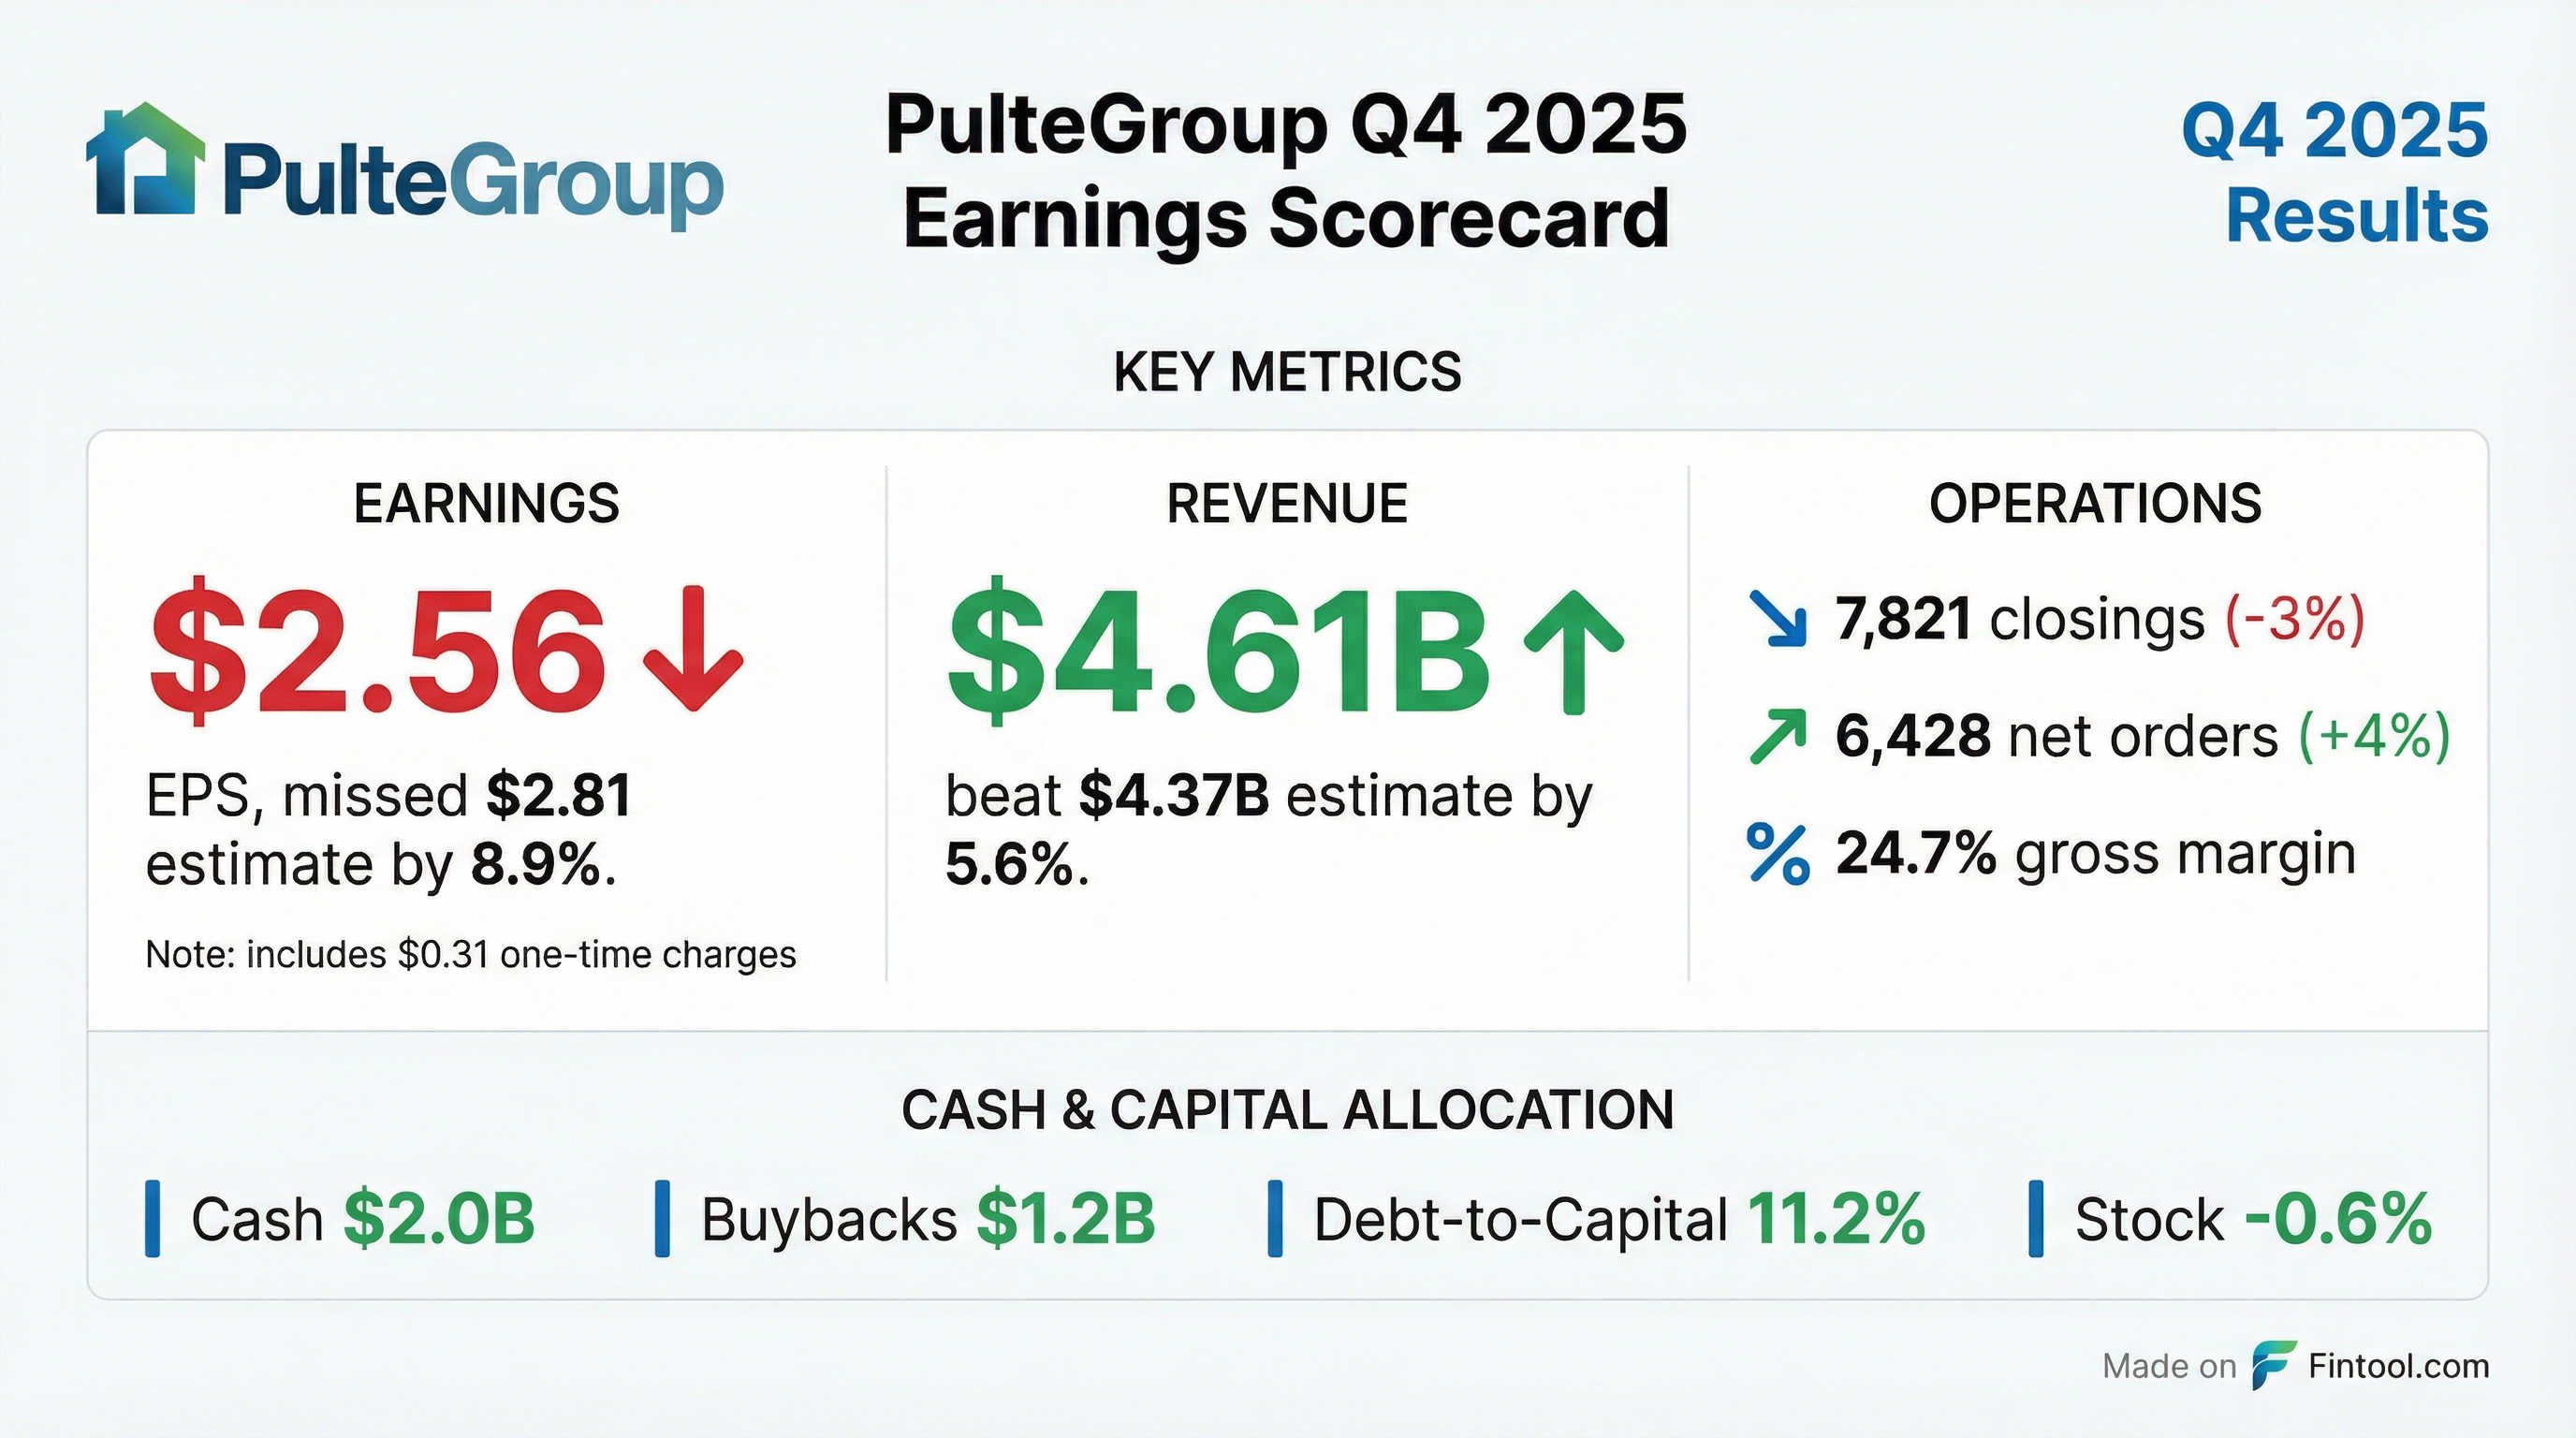
- $502 million net income, or $2.56 EPS in Q4 2025
- $4.5 billion home sale revenues from 7,821 closings; average sales price of $573,000
- 6,428 net new orders (+4% YoY) valued at $3.5 billion
- Home sale gross margin of 24.7%, down from 27.5%, including $35 million of land impairment charges
- Invested $1.4 billion in land acquisition and repurchased $300 million of common shares
- PulteGroup reported TTM ended 9/30/25 ROE of 21%, land & development spend of $5.3 B, cash from operations of $1.7 B, and returned $1.4 B to shareholders.
- It operates 968 active communities across 26 states (47 markets), has delivered ~30 K homes TTM, with ASP $569 K and home sales gross margin 27%.
- The strategy emphasizes disciplined land underwriting (42% owned, 58% optioned lots), integrated design/build processes, and data-driven market segmentation for risk-adjusted returns.
- The balance sheet remains strong with $1.5 B cash, $12.8 B equity and an 11.2% debt-to-capital ratio as of 9/30/25.
Quarterly earnings call transcripts for PULTEGROUP INC/MI/.
Ask Fintool AI Agent
Get instant answers from SEC filings, earnings calls & more