Earnings summaries and quarterly performance for PACKAGING CORP OF AMERICA.
Executive leadership at PACKAGING CORP OF AMERICA.
Mark Kowlzan
Chief Executive Officer
Charles Carter
Executive Vice President — Mill Operations
Kent Pflederer
Executive Vice President and Chief Financial Officer
Ray Shirley
Senior Vice President — Corporate Engineering and Process Technology
Thomas Hassfurther
Executive Vice President — Corrugated Products
Board of directors at PACKAGING CORP OF AMERICA.
Research analysts who have asked questions during PACKAGING CORP OF AMERICA earnings calls.
Anthony Pettinari
Citigroup Inc.
8 questions for PKG
Gabe Hajde
Wells Fargo & Company
8 questions for PKG
George Staphos
Bank of America
8 questions for PKG
Mark Weintraub
Seaport Research Partners
8 questions for PKG
Philip Ng
Jefferies
8 questions for PKG
Charlie Muir-Sands
BNP Paribas
6 questions for PKG
Michael Roxland
Truist Securities
6 questions for PKG
Anojja Shah
UBS Group AG
3 questions for PKG
Mike Roxland
Truist Securities
2 questions for PKG
Ryan Fox
Bloomberg
2 questions for PKG
Recent press releases and 8-K filings for PKG.
- Reiterated $70/ton containerboard price increase from January levels, aiming for full implementation amid continued strong corrugated demand.
- Corrugated shipments rose 4.5% in January and 3% in February year-over-year, with bookings up 7–8%, while winter storms cost $6 million (~$0.05/share) in January production and logistics impacts.
- Integration of Greif mills advancing: Massillon and Riverville mills achieved a combined run rate of 800,000 tons within five months, enhancing cost efficiency and product quality; full systems integration expected in the next 6–7 months.
- Committed to energy self-sufficiency by relocating three 50 MW gas turbines to Riverville, Jackson (AL), and DeRidder mills—targeting four mills off the grid to mitigate escalating electricity costs.
- Reiterated a $70/ton containerboard price increase from January; January shipments were up 4.5%, February up 3%, and bookings rose 7–8%, while winter storms cost $6 million (≈ $0.05/share) in January.
- Greif mill acquisition fully integrated into PCA’s engineering processes; combined run rate climbed from ≈ 600 K to 800 K+ tons in five months, boosting cost efficiency and product quality.
- Committed to energy self-sufficiency by acquiring three 50 MW gas turbines—one each for Riverville, Jackson and DeRidder mills—enabling four of ten mills to operate off-grid and mitigate surging electricity costs (Washington rates up 89%).
- Since 2017, $5.2 billion invested in box plants and mills to quadruple labor productivity and maintain low-cost leadership; succession and technical depth reinforced by recruiting engineers from 55–60 universities and promoting internal talent.
- 2025 net sales of $9.0 B, up 7.2% from 2024; non-GAAP EPS of $9.84 and EBITDA of $1,862 M, a 13.7% increase; packaging margin at 22.1%.
- Generated $729 M of free cash flow in 2025, supporting capital investments and M&A.
- Completed acquisition of Greif Containerboard on August 31, 2025 for $1.8 B, financed with $1 B term loans and $500 M notes, at a 7.9× LTM EBITDA multiple with $60 M of expected synergies.
- Achieved 39% corrugated volume growth in 2025, outperforming the industry which declined 2%.
- PCA reaffirmed a $70/ton January containerboard price increase, with full implementation underway and no signs of price erosion in the buy/sell markets.
- Corrugated demand remains robust, with January shipments up 4.5%, February up 3%, and bookings up 7–8%, despite a winter storm impact of $6 million (~$0.05/share).
- Integration of the Greif mills has driven combined run-rate capacity to 800,000+ tons, enhancing product quality and cost efficiency within five months of closing.
- Since 2017, PCA has invested $5.2 billion in mill and box plant recapitalization, achieving up to 4× labor productivity increases and 30% volume growth on a legacy basis.
- To insulate against rising power costs, PCA is acquiring three 50 MW gas turbines for installation at Riverville, Jackson, and DeRidder mills, enabling self-generation at 4 of 10 mills.
- The Board approved a $1.25 per share regular quarterly dividend on common stock.
- Dividend is payable to shareholders of record as of March 13, 2026, with a payment date of April 15, 2026.
- PCA is the third largest producer of containerboard products and a leading producer of uncoated freesheet paper in North America.
- The company operates ten paper mills and 91 corrugated products plants and related facilities.
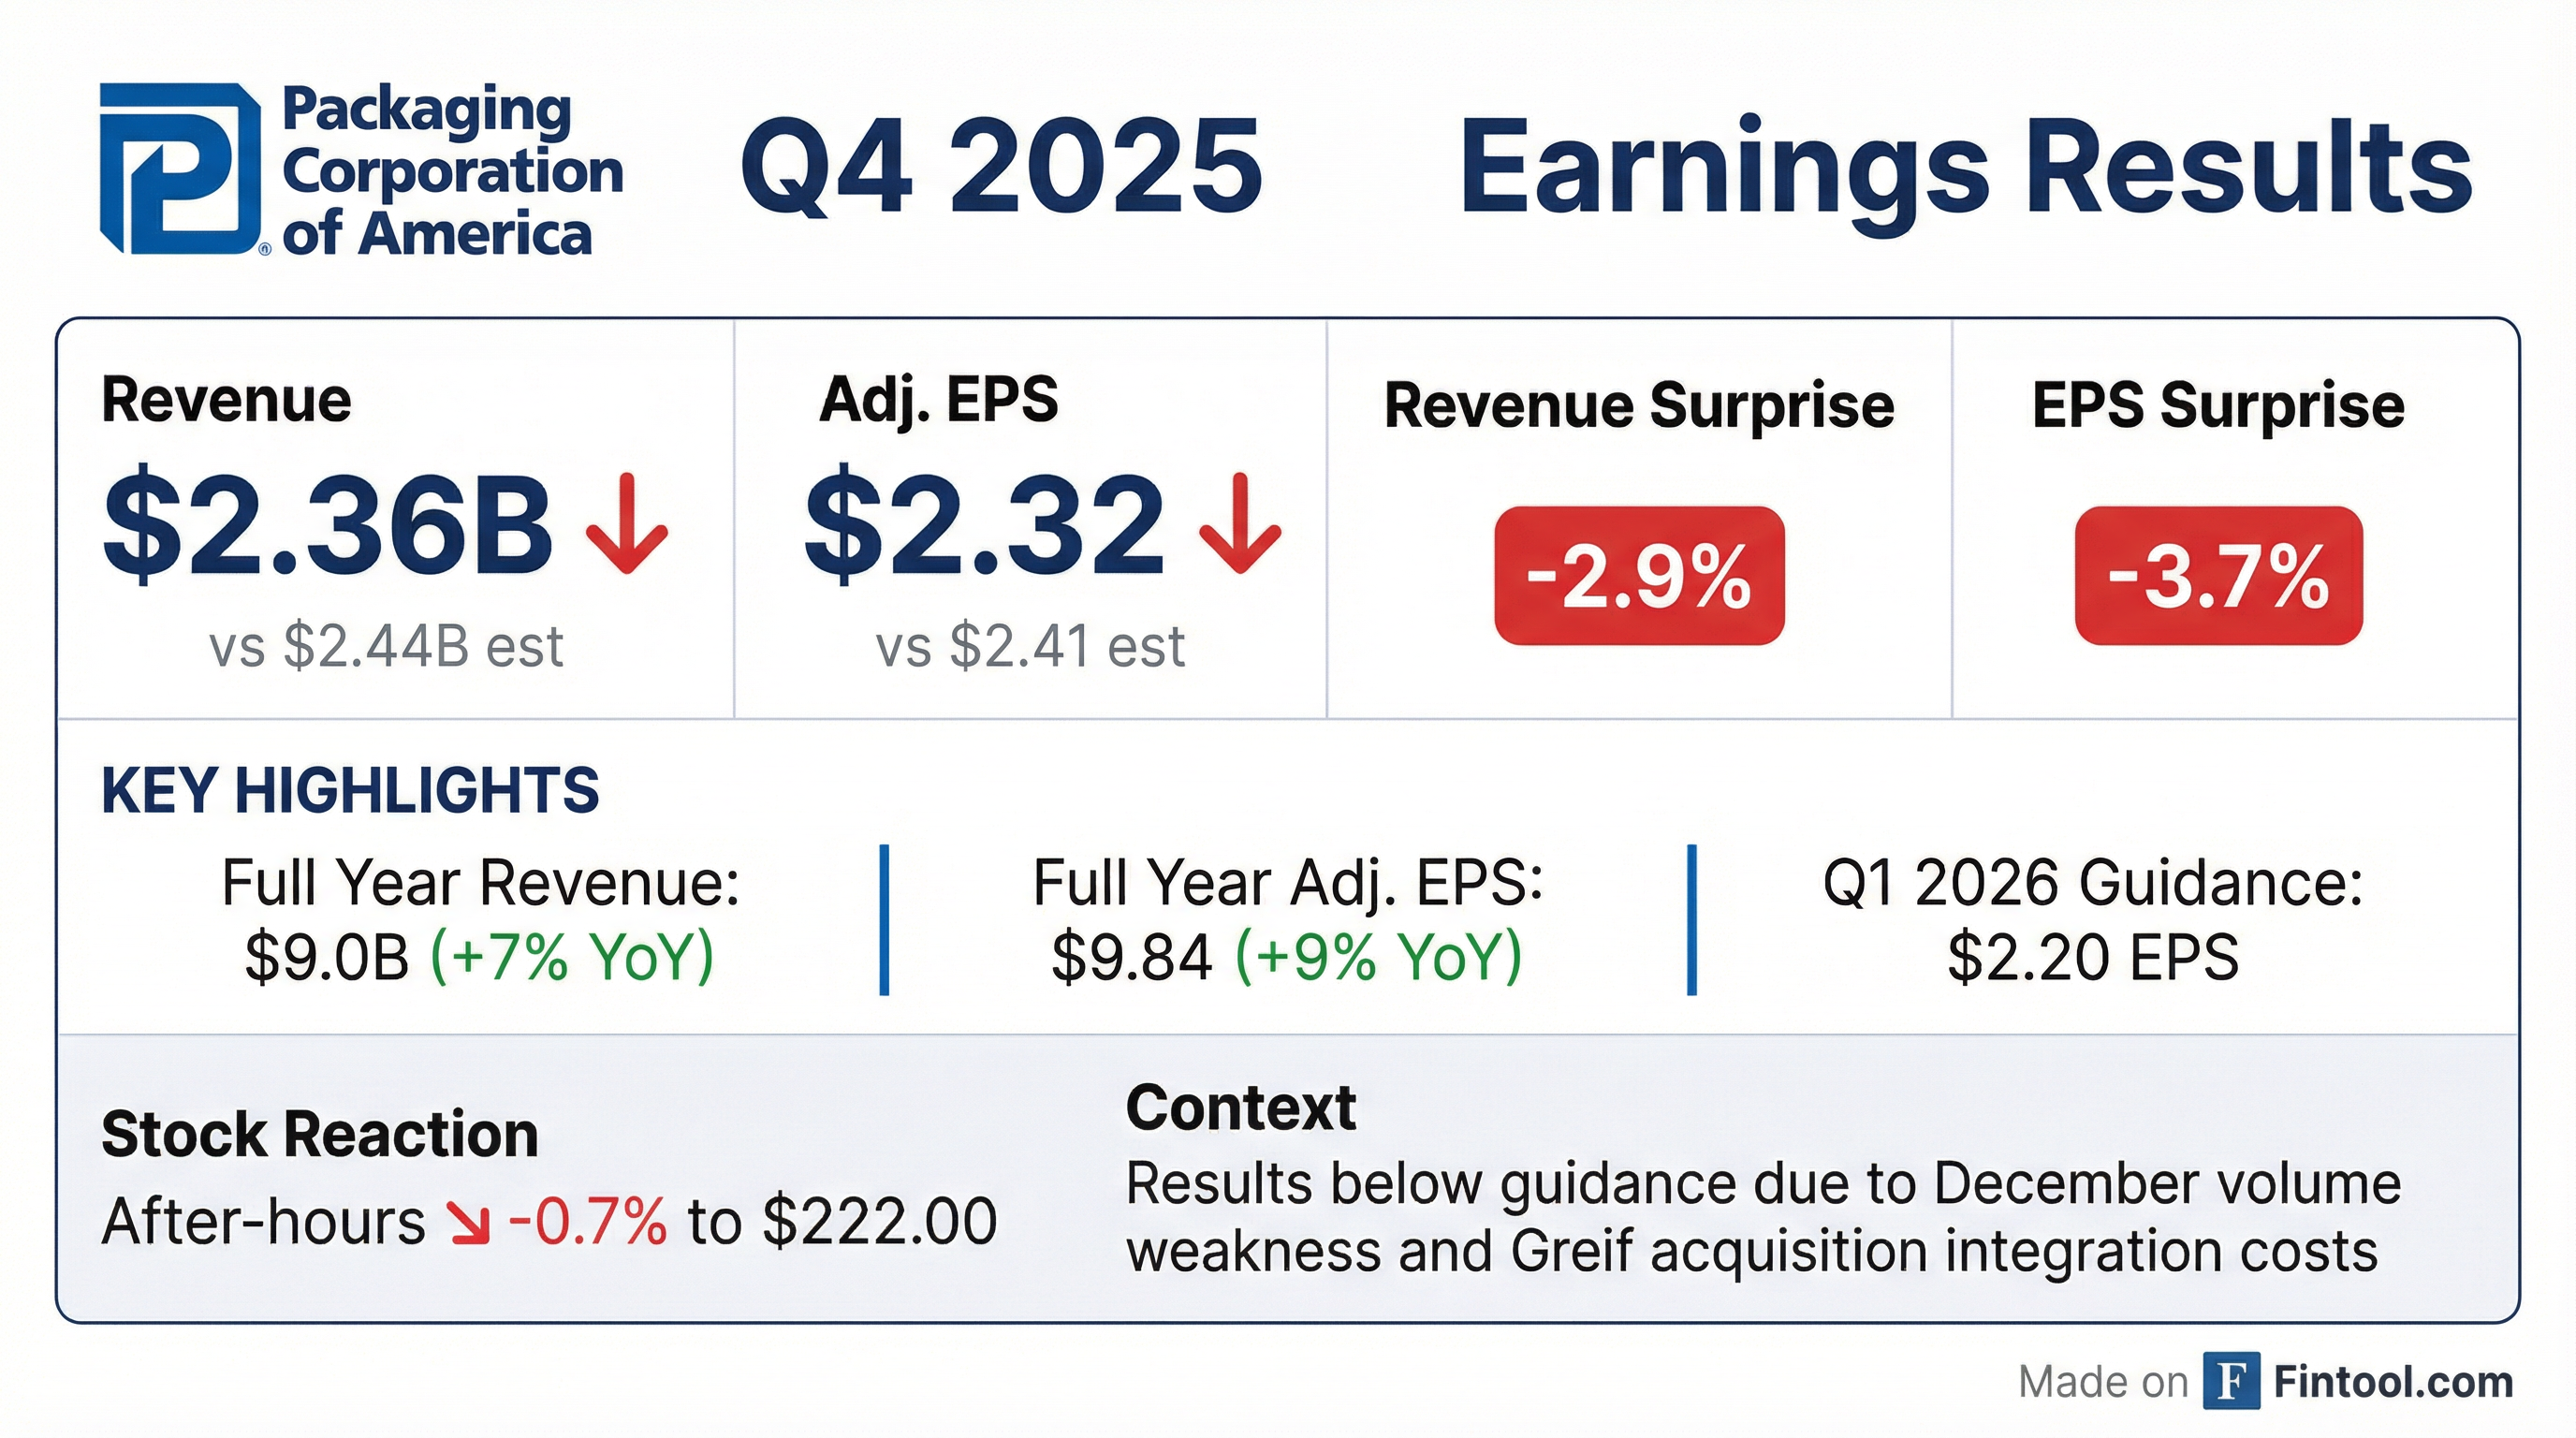
- In Q4 2025, net income excluding special items was $209 million ( $2.32 per share) on net sales of $2.4 billion, and adjusted EBITDA was $486 million, versus $222 million ($2.47) on $2.1 billion and $439 million in Q4 2024.
- Packaging segment Q4 EBITDA excluding special items was $476 million on net sales of $2.2 billion (21.7% margin), up from $426 million on $2.0 billion (21.5%) in Q4 2024.
- Acquired Greif containerboard operations incurred a Q4 loss of $0.05 per share due to extended outages, but integration of these mills is underway with reliability improvements at Massillon and Riverville and key systems integration activities in progress.
- For 2026, PCA forecasts $450 million in dividends, $840–$870 million in total CapEx, ~$700 million DD&A, $139 million interest expense, a 25% effective tax rate, and expects annual mill outages to cost $1.39 per share.
- PCA plans $250 million of capex over 2026–28 for gas turbine installations at Jackson, AL and Riverville, VA to achieve energy independence and mid- to high-teen returns, with board approval sought in Q1.
- Q4 2025 net sales of $2.4 billion; net income excluding special items of $209 million or $2.32 EPS, down from $222 million or $2.47 EPS in Q4 2024
- Full-year 2025 net sales of $9.0 billion and EBITDA excluding special items of $1.86 billion, versus $8.4 billion sales and $1.64 billion EBITDA in 2024
- Q4 packaging segment EBITDA ex-special items of $476 million on $2.2 billion sales (21.7% margin); full-year margin 22.1% on $8.3 billion sales
- Q4 cash from operations of $443 million; CapEx of $319 million; free cash flow of $124 million; repurchased $153 million of shares and paid $112 million in dividends
- 1Q 2026 earnings guidance of $2.20 per share excluding special items
- Q4 ex-special items net income of $209 million ($2.32/share) vs $222 million ($2.47) in Q4 2024; net sales of $2.4 billion vs $2.1 billion; EBITDA of $486 million vs $439 million.
- Full-year 2025 ex-special items earnings of $888 million ($9.84/share) vs $815 million ($9.04); sales of $9.0 billion vs $8.4 billion; EBITDA of $1.86 billion vs $1.64 billion.
- Packaging segment Q4 EBITDA of $476 million on $2.2 billion sales (21.7% margin); FY EBITDA $1.83 billion on $8.3 billion (22.1%); Paper segment Q4 EBITDA $37 million on $154 million sales (24.2%); FY EBITDA $148 million on $615 million (24.1%).
- Q1 2026 guidance of $2.20/share excl. special items; expect full-capacity operations, seasonal volume decline, benefit from March price increases, and some winter storm impacts.
- 2026 outlook: CapEx of $840-870 million, $450 million dividends, ~$139 million interest expense; planned outages totalling ~$1.39/share impact.
- Q4 net sales were $2.4 billion (up from $2.1 billion in Q4 2024) with net income of $102 million ($1.13 EPS) and $209 million ($2.32 EPS) excluding special items.
- For the full year, net sales reached $9.0 billion vs $8.4 billion, with net income of $774 million ($8.58 EPS) and $888 million ($9.84 EPS) excluding special items.
- In Q4, the Packaging segment reported $173.3 million operating income (GAAP) and $309.2 million excluding special items; the Paper segment contributed $32.7 million.
- PCA repurchased 760,000 shares at an average price of $201 per share during Q4 2025.
- The company provided Q1 2026 EPS guidance of $2.20 per share excluding special items, expecting higher volume, prices and increased costs.
- Packaging Corp of America reported Q4 2025 GAAP net income of $102 million (EPS $1.13) and adjusted net income of $209 million (EPS $2.32); Q4 net sales rose to $2.4 billion from $2.1 billion a year ago.
- Full year 2025 GAAP net income was $774 million (EPS $8.58) and adjusted net income was $888 million (EPS $9.84); full year net sales increased to $9.0 billion from $8.4 billion in 2024.
- The company expects Q1 2026 earnings of $2.20 per share, driven by higher packaging volumes and price increases, with seasonally slower demand and scheduled maintenance factored in.
Quarterly earnings call transcripts for PACKAGING CORP OF AMERICA.
Ask Fintool AI Agent
Get instant answers from SEC filings, earnings calls & more