Earnings summaries and quarterly performance for Palantir Technologies.
Executive leadership at Palantir Technologies.
Alexander Karp
Detailed
Chief Executive Officer
CEO
DG
David Glazer
Detailed
Chief Financial Officer and Treasurer
JB
Jeffrey Buckley
Detailed
Chief Accounting Officer
RT
Ryan Taylor
Detailed
Chief Revenue Officer and Chief Legal Officer
SS
Shyam Sankar
Detailed
Chief Technology Officer and Executive Vice President
SC
Stephen Cohen
Detailed
President and Secretary
Board of directors at Palantir Technologies.
Research analysts who have asked questions during Palantir Technologies earnings calls.
Recent press releases and 8-K filings for PLTR.
Palantir showcases AI-driven industry deployments and partnerships at AIPCon 9
PLTR
Product Launch
New Projects/Investments
- Palantir introduced ShipOS, an AI-enabled operating system deployed with two shipbuilders, three public shipyards, and 18 suppliers to provide real-time schedule visibility, flag material risks, and automate change cascades in naval shipbuilding.
- Strategic partnerships highlighted include World View’s AI Flight Director for stratospheric mission planning compressed from two weeks to hours , and collaborations with SAP and Accenture on RISE with SAP migrations achieving over 99% validation accuracy and 70% timeline and cost reductions.
- Demonstrated edge-compute capabilities through the Armada modular AI data center, enabling Palantir Foundry deployments in remote or disconnected environments with low-latency processing.
- Customer case studies: GE Aerospace increased engine output by 26% in 2025 via supply chain digital ontology and automation ; Centrus Energy gained real-time visibility into centrifuge builds, eliminating an 8-week data lag ; and the DoD’s Maven Smart System cut multi-hour integration tasks to minutes through unified data connections.
- Palantir signaled a shift toward rapid, iterative engagements—delivering initial solutions in days and scaling across value chains in 30-day sprints, culminating in 12-month enterprise integration roadmaps.
4 days ago
Palantir unveils sovereign edge AI deployment architecture
PLTR
Product Launch
- Palantir, NVIDIA, Dell, and Armada introduced a reference architecture for air-gapped, edge-deployed AI workloads offering split-second latency for mission-critical scenarios such as emergency response.
- The turnkey solution uses Palantir Apollo, Rubix microservices, and pre-installed NVIDIA libraries, achieving field deployment to first-run in about three weeks.
- It ensures data sovereignty with on-site data control and integrated cybersecurity, sending only metadata to the cloud to reduce operational costs.
- Supports deployment of open-source and NVIDIA foundation models, forming a substrate for agent-driven systems at the edge globally.
4 days ago
Palantir unveils ShipOS and expands AI partnerships
PLTR
Product Launch
New Projects/Investments
- Palantir unveiled ShipOS, an AI-powered operating system for the U.S. Navy’s shipbuilding enterprise, providing real-time visibility across shipyards, suppliers, and automated schedule and cost impact analyses for engineering change notices.
- The company introduced AI Flight Director with World View, reducing stratospheric mission planning from weeks to minutes by leveraging AI-driven trajectory simulations and live telemetry for station-keeping platforms.
- Palantir and Accenture partnered with SAP to embed Palantir’s AI foundation into S/4HANA migrations, offering real-time enterprise insights and accelerating AI adoption across client SAP landscapes.
- Palantir’s Ontology-based sustainment platform at GE Aerospace for the J85 engine surfaced parts constraints and delivered AI-driven remediation, contributing to a 26% increase in engine output in 2025.
- Centrus Energy deployed Palantir’s industrial operating system to unify program schedules, workforce, and supply chain data for uranium enrichment, automating root-cause analyses and reducing process delays from weeks to minutes.
4 days ago
Palantir announces strategic partnership with LG CNS
PLTR
New Projects/Investments
- Palantir and LG CNS have deepened a strategic partnership to accelerate AI Transformation (AX) across LG Group, formalized at Palantir's AIPCon.
- The collaboration builds on Palantir's late 2025 deployment within an LG affiliate for quality management and is now set to expand enterprise-wide.
- A dedicated Forward Deployed Engineering (FDE) team will be embedded within LG CNS to identify and execute high-value AX use cases across LG's diversified industries.
- Palantir’s Chief Revenue and Legal Officer Ryan Taylor highlighted the joint ambition to create an AI-powered enterprise with LG Group, while LG CNS CEO Shin-gyoon Hyun emphasized the global expansion of their AX business.
5 days ago
Palantir, defense and energy stocks rally amid Iran tensions
PLTR
- U.S. equities rose midday Monday as investors largely brushed aside escalating tensions with Iran: Nasdaq 100 +0.3%, S&P 500 +0.1%; 10-year Treasury yield +11 bp to ~4.07%; oil up ~5.1% to ~$70/Bbl.
- Defense and energy sectors led gains, with the SPDR S&P Aerospace & Defense ETF +2% and energy sector +1.3%.
- Palantir topped the S&P 500, jumping ~6.5% as investors rewarded defense-tech firms supplying AI-driven scenario modeling.
- Palantir’s analytics leverage Anthropic’s Claude to crunch hypothetical battlefield scenarios and project potential outcomes.
- Small-cap stocks outperformed, with the Russell 2000 climbing 0.5% to 2,645.61; other markets saw the U.S. dollar +0.9%, gold +0.5% to $5,300/oz, silver –6% to $88/oz, and bitcoin +5.2% to $69,150.
Mar 2, 2026, 4:11 PM
Palantir receives UBS upgrade and Rosenblatt initiates coverage
PLTR
- UBS upgraded Palantir to Buy with a $180 price target, calling the ~35% pullback a “very compelling entry point” and forecasting ~70% revenue growth in 2026 with mid-50% margins
- UBS noted shares trade at approximately 50× 2027 free-cash-flow and sees about 32% upside from the prior close of $135.94
- Rosenblatt initiated coverage with a Buy rating and $150 price target, branding Palantir a market-disrupting AI software leader despite the analyst’s one-year average return of –2.6%
- Palantir shares are down roughly 23–24% year to date amid broader tech sector weakness
Feb 26, 2026, 9:30 PM
Revel raises $150M Series B funding
PLTR
New Projects/Investments
- Revel secured $150 million in Series B financing, led by Index Ventures, with participation from Redpoint Ventures, Thrive Capital, Felicis, Abstract Ventures, and notable angel investors.
- Proceeds will fund team expansion, continued product development, and broader market deployment.
- The Revel platform offers visual hardware configuration, live telemetry monitoring, and safe real-time commands via its Python-inspired RevelCode language, designed for deterministic execution in high-consequence environments.
- Early traction includes deployments with Impulse Space, Radiant Nuclear, and Astro Mechanica across aerospace, defense, robotics, and advanced energy sectors.
Feb 26, 2026, 2:00 PM
Palantir partners with Rackspace to operationalize Foundry and AIP
PLTR
New Projects/Investments
- The partnership enables deployment of Palantir Foundry and AIP into production in weeks or months instead of months or years, leveraging Rackspace’s managed operations model.
- Rackspace will provide a regulated operating framework for consistent security, operational controls, and compliance from edge to core to cloud, including hosting in private and UK sovereign data centers.
- The collaboration starts with 30 Palantir-trained engineers at Rackspace, expanding to over 250 engineers within 12 months to support data migration and ongoing operations.
- Customers receive an integrated end-to-end service—covering infrastructure hosting, data migration, implementation services, and continuous managed operations—tailored for regulated and data-sensitive industries.
Feb 19, 2026, 12:15 AM
Palantir reports CEO’s $17.2M private jet expenses
PLTR
Executive Compensation
Revenue Acceleration/Inflection
Guidance Update
- CEO Alex Karp was reimbursed $17.2 million in 2025 for private jet use, up from $7.7 million in 2024.
- Jefferies estimates this implies 2,457 flight hours on a mid-sized jet (28% of the year) or 1,147 hours on a G650 (13%), raising internal controls and governance questions.
- Investor Michael Burry has taken a short position and criticized the disclosure, projecting a potential share drop to $50–$60, while some analysts remain bullish.
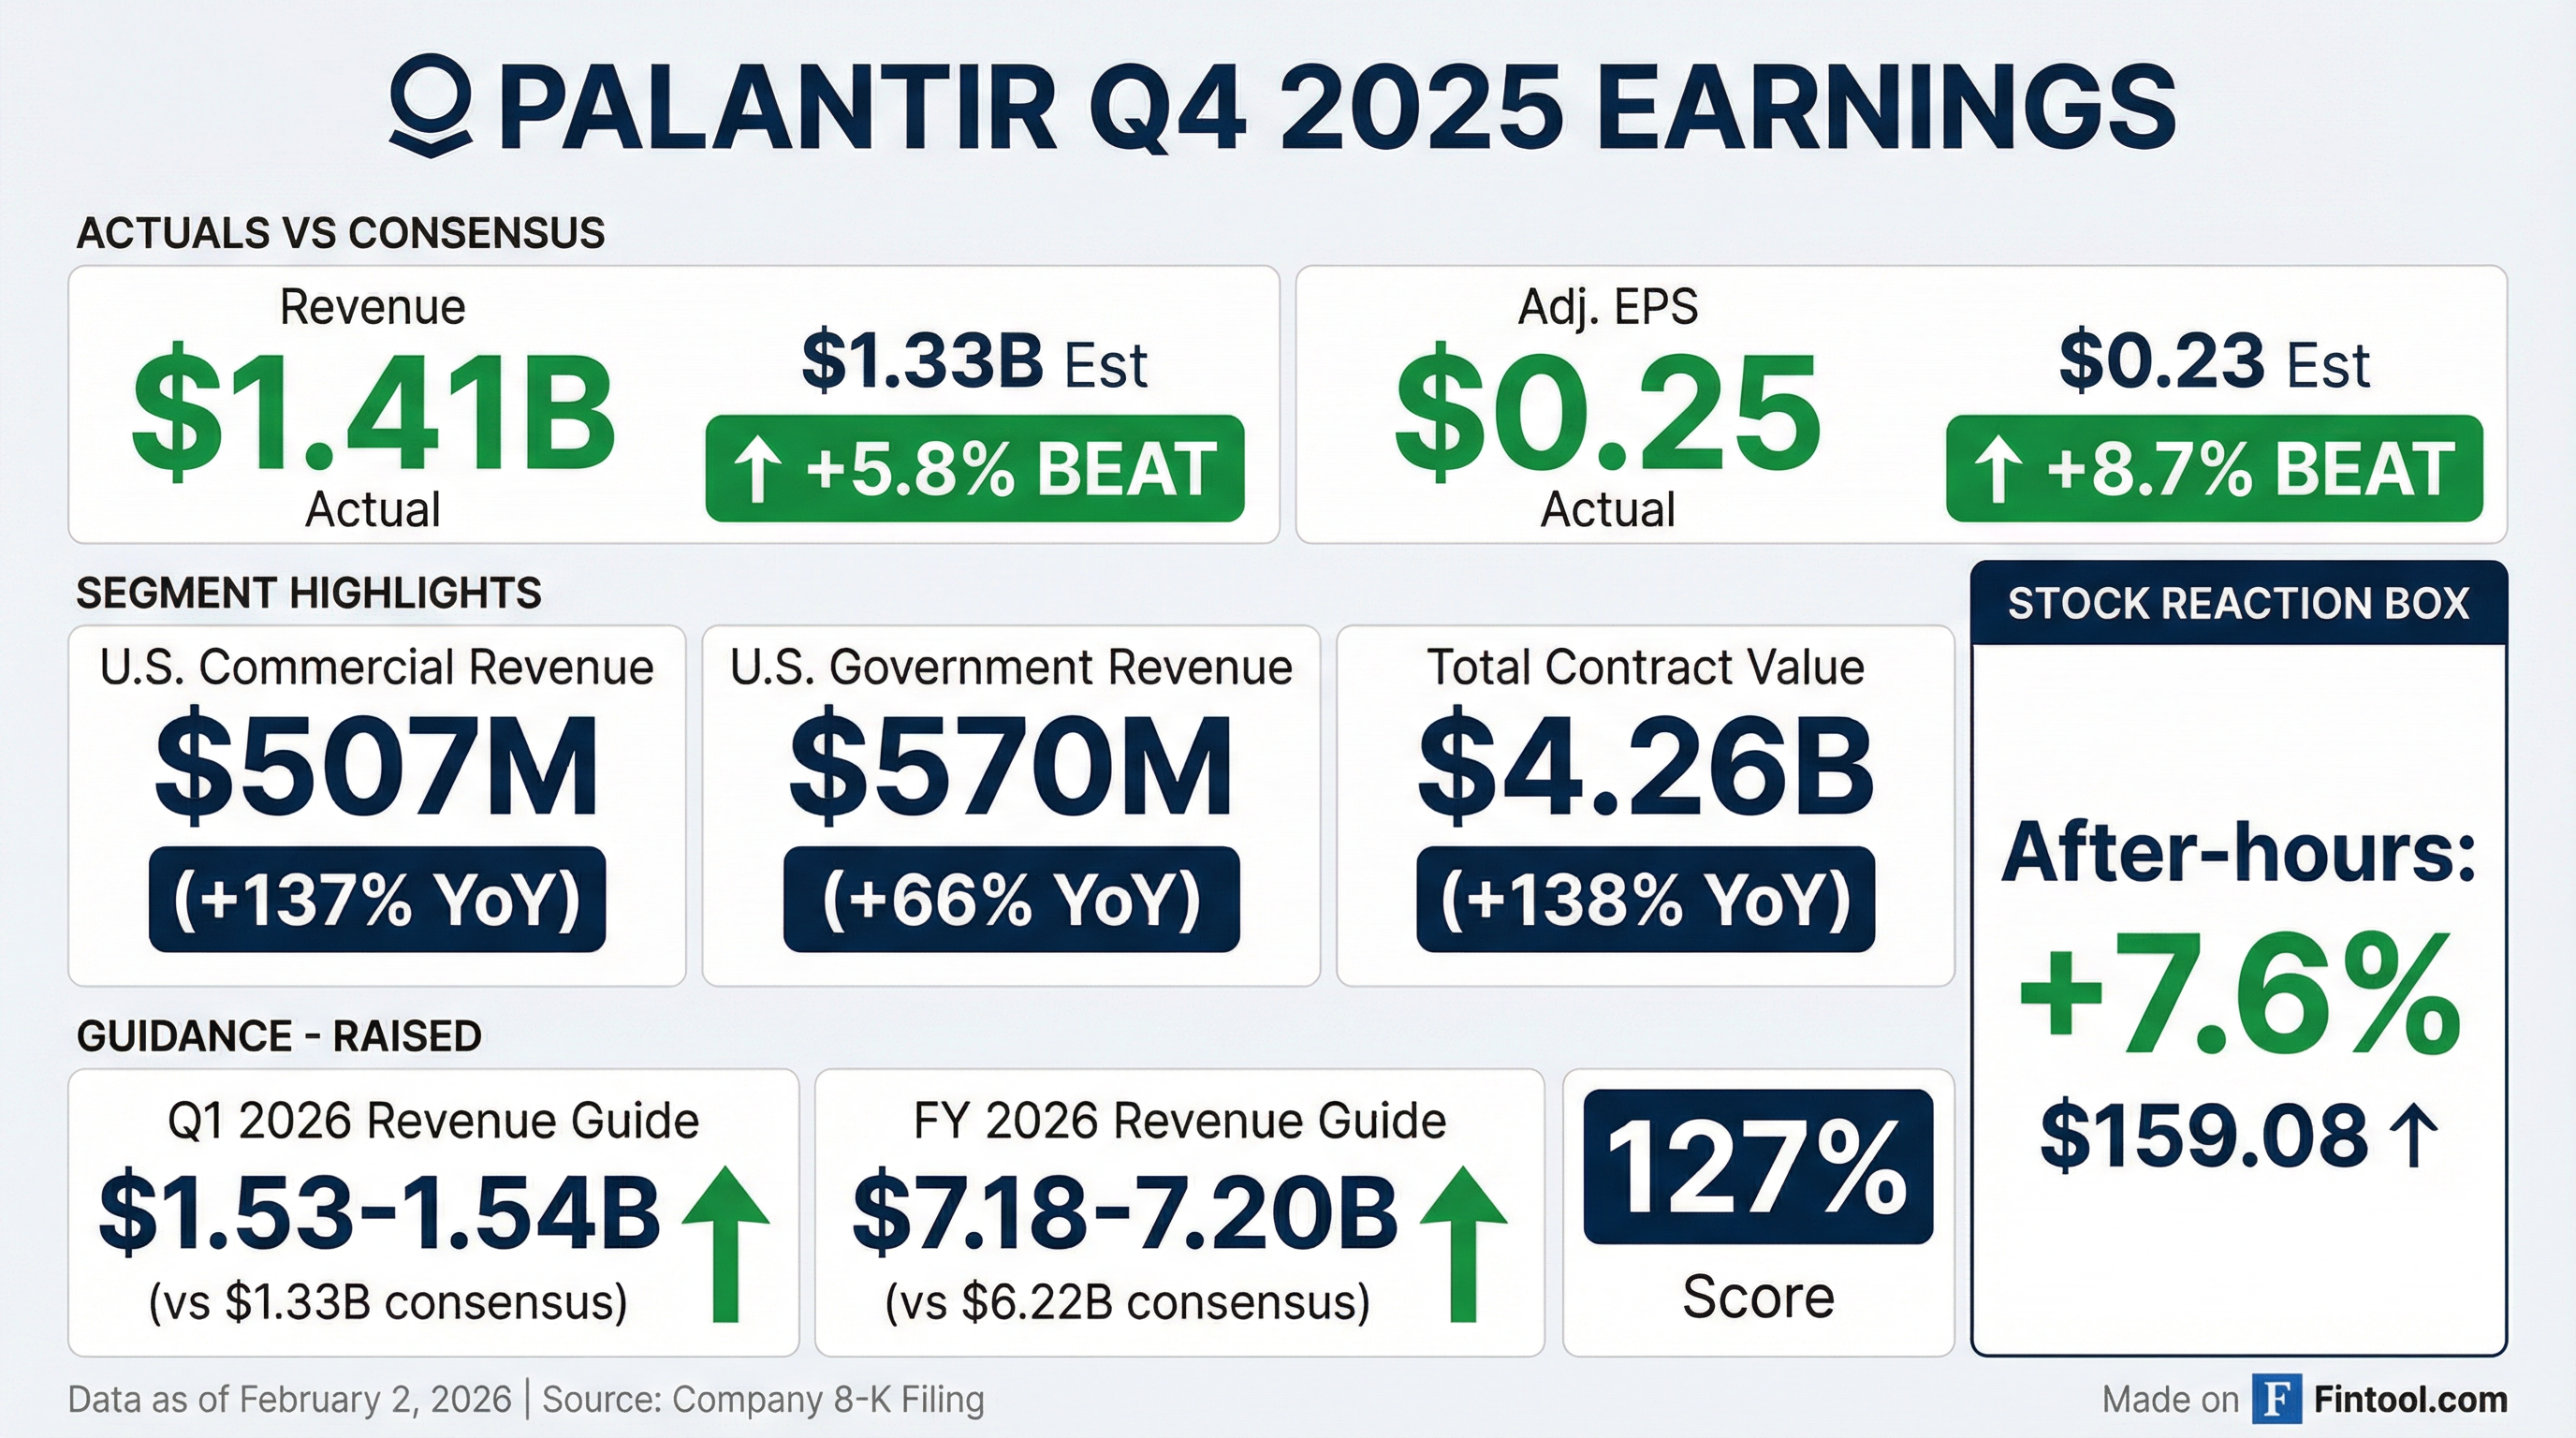
- Palantir delivered a ~70% year-over-year Q4 revenue surge and nearly doubled its 2026 guidance, accompanied by a Mizuho upgrade to Outperform with a $195 price target.
Feb 18, 2026, 5:25 PM
Palantir gains DISA authorization for government edge deployments
PLTR
New Projects/Investments
- Palantir secured expanded Provisional Authorizations from DISA for its Palantir Federal Cloud Service (PFCS) Forward at Impact Levels 5 and 6, enabling on-premises and tactical edge deployment of its full software stack including Apollo, Gotham, Foundry and AIP.
- The hardware-agnostic “authorize once, use many” package is designed to reduce site-specific security assessments and shorten the time to Authorization to Operate across enterprise data centers and mobile/vehicle configurations.
- Palantir reported Q4 2025 revenue of $1.41 billion (up 70% YoY) and adjusted EPS of $0.25, and guided 2026 revenue to $7.18–7.20 billion (approx. 61% growth).
- Analysts upgraded the stock following the announcement, with Daiwa Capital Markets raising its rating to Buy and setting a $180 target, while independent outlets highlighted a market cap of $323.38 billion, 82.37% gross margin and strong balance-sheet ratios.
Feb 12, 2026, 12:56 PM
Fintool News
In-depth analysis and coverage of Palantir Technologies.

Policy & Geopolitics
Pentagon Summons Anthropic CEO for Ultimatum Over AI Guardrails
Feb 23

Corporate
Palantir Exits Denver for Miami, Completing Second HQ Migration in Six Years
Feb 18
Corporate
Palantir Crushes Q4 With 70% Revenue Surge, Issues Jaw-Dropping 2026 Guidance
Feb 2

Corporate
Palantir Lands Biggest Korea Deal Yet: Hundreds of Millions from HD Hyundai
Jan 20
Quarterly earnings call transcripts for Palantir Technologies.
Ask Fintool AI Agent
Get instant answers from SEC filings, earnings calls & more